Our results show the cross-racial differences between the skeletal growth patterns of Asian and Hispanic children and skeletal growth patterns of white and African American children.
Abstract
Purpose:
To collect up-to-date data in healthy children to create a digital hand atlas (DHA) that can be used to evaluate, on the basis of the Greulich and Pyle atlas method, racial differences in skeletal growth patterns of Asian, African American, white, and Hispanic children in the United States.
Materials and Methods:
This retrospective study was HIPAA compliant and approved by the institutional review board. Informed consent was obtained from all subjects or their guardians. From May 1997 to March 2008, a DHA containing 1390 hand and wrist radiographs obtained in male and female Asian, African American, white, and Hispanic children with normal skeletal development was developed. The age of subjects ranged from 1 day to 18 years. Each image was read by two pediatric radiologists working independently and without knowledge of the subject's chronologic age, and evaluation was based on their experience with the Greulich and Pyle atlas. Statistical analyses were performed with the paired-samples t test and analysis of variance to study racial differences in growth patterns. P ≤ .05 indicated a significant difference.
Results:
Bone age (P ≤ .05) was significantly overestimated in Asian and Hispanic children. These children appear to mature sooner than their African American and white peers. This was seen in both male and female subjects, especially in girls aged 10–13 years and boys aged 11–15 years.
Conclusion:
Ethnic and racial differences in growth patterns exist at certain ages; however, the Greulich and Pyle atlas does not recognize this fact. Assessment of bone age in children with use of the Greulich and Pyle atlas can be improved by considering the subject's ethnicity.
© RSNA, 2008
Assessment of bone age is a clinical procedure used in pediatric radiology to evaluate skeletal maturity on the basis of bone growth in the left hand and wrist, as seen on a radiograph. The determination of skeletal maturity (also referred to as bone age) plays an important role in the diagnosis and treatment of endocrinologic abnormalities and growth disorders in children (1,2). In clinical practice, the method most commonly used to assess bone age is matching of a radiograph of the left hand and wrist with the Greulich and Pyle atlas (3), which contains a reference set of standard hand images collected in the 1950s in healthy white children who were members of the middle or upper class population.
Over the past 30 years, many authors have questioned the appropriateness of using the Greulich and Pyle atlas for bone age assessment in contemporary children. In 1975, Roche et al (4) showed that the average child in the United States was less physically mature than the children in the Greulich and Pyle atlas. In 1996, Ontell et al (5) examined the applicability of the Greulich and Pyle standards to ethnically diverse children. However, these studies and various others (6–8) did not provide a large-scale systematic method for validation. Thus, the purpose of our study was to collect up-to-date data in healthy children to create a digital hand atlas (DHA) that can be used to evaluate, on the basis of the Greulich and Pyle atlas method, racial differences in skeletal growth patterns of Asian, African American, white, and Hispanic children in the United States.
MATERIALS AND METHODS
The protocol of this retrospective study was approved and has been renewed annually by the institutional review boards of our institutions, and written informed consent was obtained from all subjects or their legal guardians. This study was compliant with the Health Insurance Portability and Accountability Act. Subject anonymity was achieved by replacing the subject name and other traceable information with a data encryption method.
Subject Recruitment
During the past 10 years (May 1997 to March 2008), a DHA has been developed that contains 1390 hand and wrist radiographs obtained in healthy Asian, African American, white, and Hispanic boys and girls. All subjects (age range, 1 day to 18 years) were recruited from public schools in Los Angeles County, California, starting in the late 1990s (9–15).
Case Selection Criteria
Before the hand was examined with radiography, a physical examination was performed to determine the health and Tanner maturity index (16) of the subject to ensure that he or she was healthy and that his or her skeletal development was normal. Height, trunk height, and weight were measured and used to calculate the body mass index.
Image Acquisition
Each radiograph of the hand and wrist was obtained with a rigorous data collection protocol (9). The radiographs were obtained with an x-ray generator (Polyphos 50; Siemens, Erlangen, Germany) at 55 kVp and 1.2 mAs. The radiation dose delivered per image was less than 1 mrem (0.01 mSv), which is equivalent to approximately 1 day of natural background radiation. The hand was adjusted to the correct position, which required the subject to keep his or her fingers spread apart and maintain hand straightness as much as possible; no hand jewelry was worn. The distance between the x-ray tube and the image cassette was 40 inches. The hand of a normal child was less than 1 inch thick; therefore, the magnification factor was approximately 1.
Image Interpretation
After a radiograph of the hand was acquired in each subject, two experienced pediatric radiologists (each with more than 25 years of experience in bone age assessment) performed independent readings based on Greulich and Pyle atlas standards. During reading, radiologists were blinded to the subject's chronologic age, race, and other pertinent information.
The subject's bone age, as determined by the radiologist, was compared with the subject's chronologic age. The image was selected and accepted to the DHA only if the difference between the subject's bone age, as determined by the radiologist, and the subject's chronologic age was less than 3 years. The acceptance rate was higher than 90%.
Image Digitization
For data analysis, Web-based image and data distribution, and communication in the clinical environment and public domain, each accepted radiograph (subject name and identification were covered with black tape) was digitized into the Digital Imaging and Communications in Medicine (DICOM) format by using a laser film digitizer (Array, Tokyo, Japan); furthermore, each subject's information (excluding his or her name and identification, as well as any other traceable data) was put in the DICOM header (17–19). We used the following parameters: 12 bits per pixel, optical density of 0.0–4.0, and 100-μm pixel spacing. The size of the image corresponded to the size of the original radiograph. Table 1 contains the pertinent information of four 14-year-old boys of different races. The corresponding radiographs of their hands are shown in Figure 1.
Table 1.
Pertinent Information in Four 14-year-old Boys of Different Races
Note.—The DICOM header includes the subject's demographic and health-related information, as well as the bone age assigned by the radiologists. These data, along with the corresponding image, can be retrieved from the Web-based DHA.
Figure 1a:
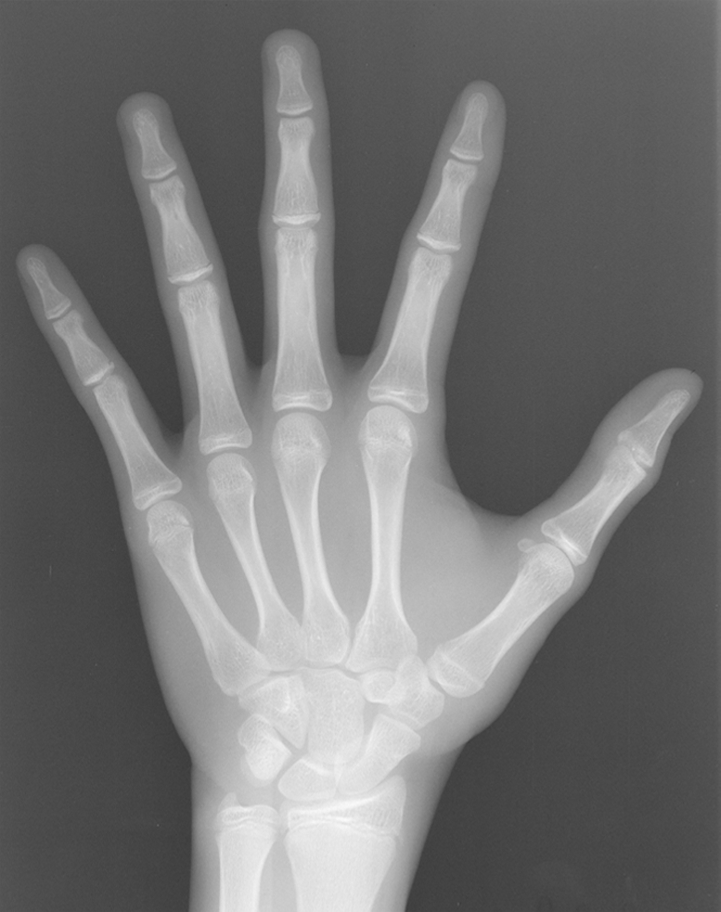
Examples of radiographs obtained in (a) a 14.13-year-old Asian boy, (b) a 14.46-year-old African American boy, (c) a 14.79-year-old white boy, and (d) a 14.64-year-old Hispanic boy. Corresponding demographic data and bone age, as assigned by two radiologists, are included in the DICOM image header (Table 1).
Figure 1b:
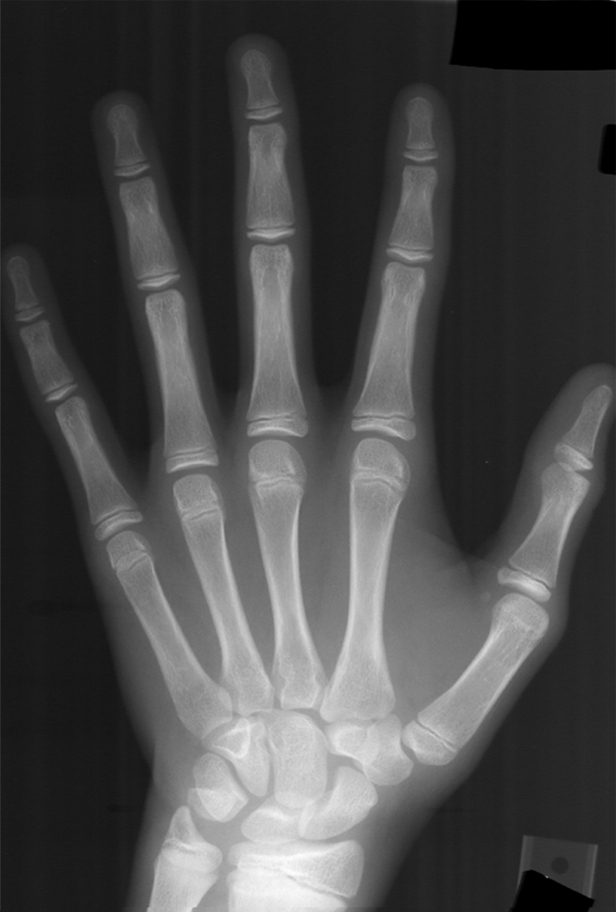
Examples of radiographs obtained in (a) a 14.13-year-old Asian boy, (b) a 14.46-year-old African American boy, (c) a 14.79-year-old white boy, and (d) a 14.64-year-old Hispanic boy. Corresponding demographic data and bone age, as assigned by two radiologists, are included in the DICOM image header (Table 1).
Figure 1c:
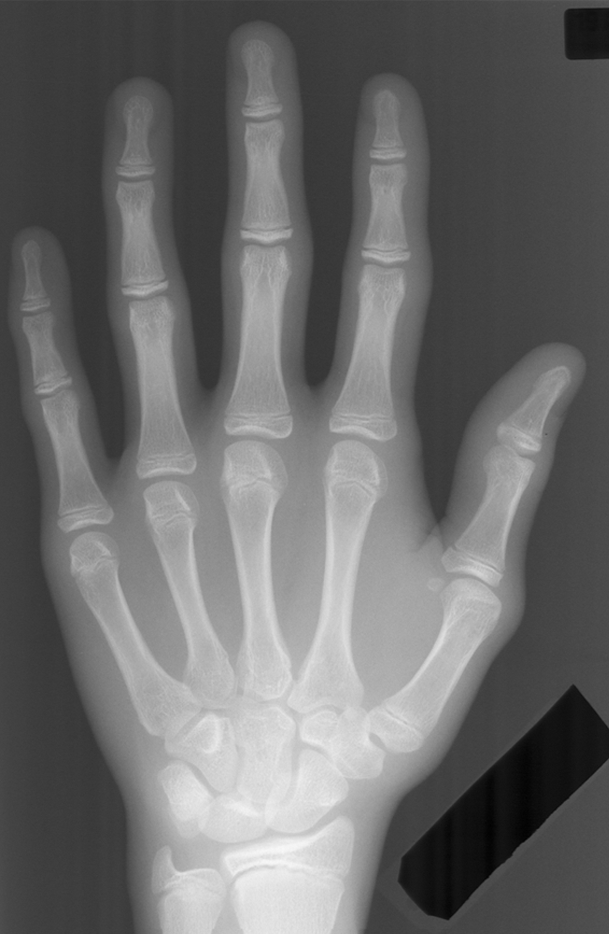
Examples of radiographs obtained in (a) a 14.13-year-old Asian boy, (b) a 14.46-year-old African American boy, (c) a 14.79-year-old white boy, and (d) a 14.64-year-old Hispanic boy. Corresponding demographic data and bone age, as assigned by two radiologists, are included in the DICOM image header (Table 1).
Figure 1d:
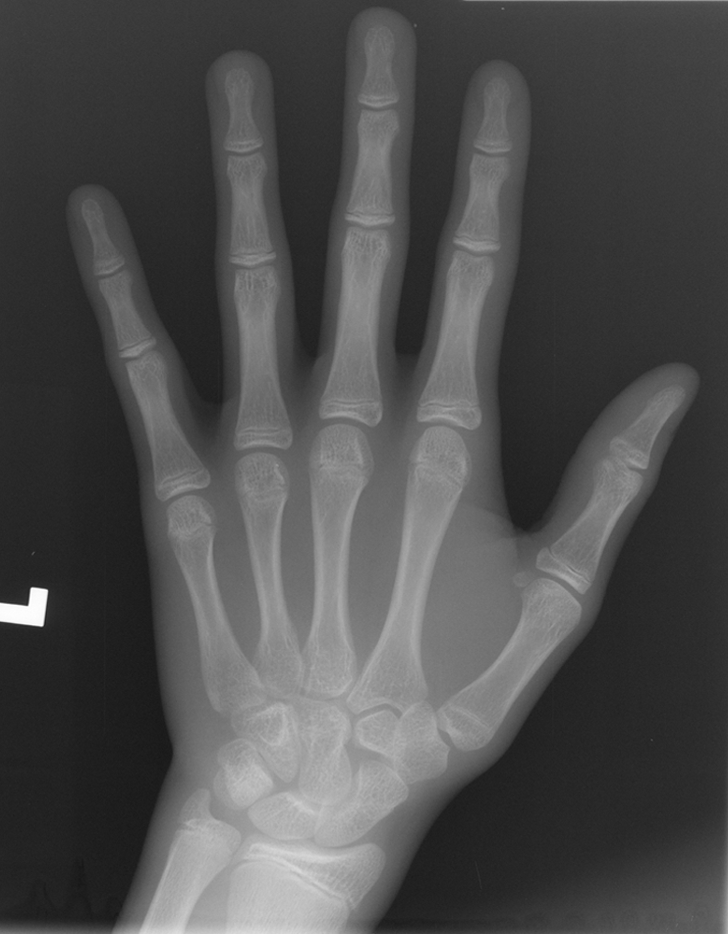
Examples of radiographs obtained in (a) a 14.13-year-old Asian boy, (b) a 14.46-year-old African American boy, (c) a 14.79-year-old white boy, and (d) a 14.64-year-old Hispanic boy. Corresponding demographic data and bone age, as assigned by two radiologists, are included in the DICOM image header (Table 1).
Data Collection Summary
There were two cycles of data collection, each of which had eight categories (Asian boys, Asian girls, African-American boys, African-American girls, white boys, white girls, Hispanic boys, and Hispanic girls). Each category contained 19 age groups (one for subjects younger than 1 year and 18 set at 1-year intervals for subjects aged 1–18 years). The two pediatric radiologists independently read all images obtained in each cycle. Cycle 1 consisted of 1103 digitized hand images with demographic data. Five cases for each younger age group (1–9 years) and 10 cases for each older age group (10–18 years) were included. The sample sizes were chosen to achieve a precision of approximately 0.20 for all age groups, with a 95% confidence interval when using the digital hand atlas to compare bone age with chronologic age. Precision is defined as the confidence interval width divided by the estimated mean value of chronologic age. Subjects younger than 1 year were considered infants, and their data were not used for analysis.
In order to study the active growth period in children aged 5–14 years more carefully to yield better statistics, data were collected in 287 subjects during the second cycle after the first cycle had been completed. Thus, a total of 1390 cases were included in the DHA. The breakdown of cases was as follows: 167 Asian girls, 167 Asian boys, 174 African American girls, 184 African American boys, 166 white girls, 167 white boys, 183 Hispanic girls, and 182 Hispanic boys. These 1390 cases were used to derive the results described in this article.
Statistical Analysis
Statistical analysis was performed with computer software (SPSS, version 15.0 for Windows; SPSS, Chicago, Ill). Graphs were generated with third-party software (KaleidaGraph 3.5; Synergy Software, Reading, Pa). Two types of analysis, the paired-samples t test and analysis of variance, were performed by using chronologic age as the reference standard. Data from subjects in the newborn group were not used for analysis. P ≤ .05 indicated a significant difference.
Data acquired in both cycles for each race and a given sex were combined with data for the entire age range (1–18 years), and the paired-samples t test was performed on a case-by-case basis to find the mean difference between the average bone age of two readings and the chronologic age. This resulted in eight categories for comparison: Asian boys, Asian girls, African American boys, African American girls, white boys, white girls, Hispanic boys, and Hispanic girls, each depicting the overall view of differences between the radiologists' average bone age reading against the chronologic age for subjects of each race and sex.
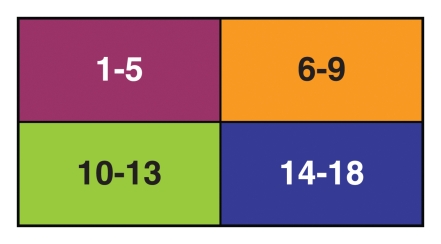
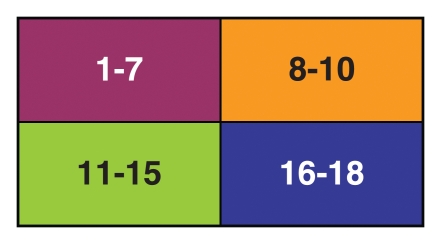
On the basis of the effects of the growth factor and sexual hormones, as well as our observations in the phalangeal, carpal, and wrist joint regions (9–15), we divided the entire growth age ranging from 1 year to 18 years into four age subsets, as shown in Figure 2. These subsets were used to study differences in growth patterns of children of different races in a given subset. Analysis of variance was used to study the cross-racial comparisons for a given subset of growth range on the basis of differences between chronologic age and bone age.
Figure 2a:
Charts show the four divided age subsets for (a) girls and (b) boys. These charts provide a road map for use in the study of racial differences during different growth periods. In a, purple indicates 1–5 years of age; orange, 6–9 years of age; green, 10–13 years of age; and blue, 14–18 years of age. In b, purple indicates 1–7 years of age; orange, 8–10 years of age; green, 11–15 years of age; and blue, 16–18 years of age.
Figure 2b:
Charts show the four divided age subsets for (a) girls and (b) boys. These charts provide a road map for use in the study of racial differences during different growth periods. In a, purple indicates 1–5 years of age; orange, 6–9 years of age; green, 10–13 years of age; and blue, 14–18 years of age. In b, purple indicates 1–7 years of age; orange, 8–10 years of age; green, 11–15 years of age; and blue, 16–18 years of age.
RESULTS
Radiologist Interpretation
Table 2 shows the mean difference in age between the average bone age assigned by two radiologists and the chronologic age for each of the eight categories separated by race and sex. Since we collected data in children with normal skeletal development, the differences with asterisks shown in Table 2 are within 2 standard deviations between the normal chronologic age and the average bone age (see the Case Selection Criteria section) and may not be important from a clinical perspective. However, we were able to conclude that the radiologists had a slight tendency, which was statistically significant, to overestimate bone age in the Asian and Hispanic populations as a whole.
Table 2.
Mean Difference between Bone Age Assigned by Radiologists and Chronologic Age according to Race and Sex
* Mean difference between bone age assigned by radiologists and chronologic age was significant (P ≤ .05).
† Infants (patients younger than 1 year) were excluded from analysis.
Cross-racial Comparisons
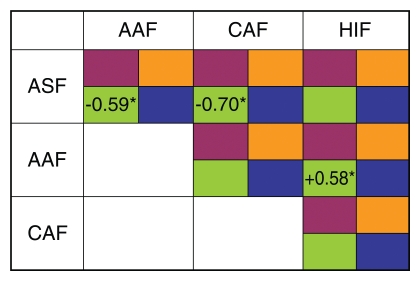
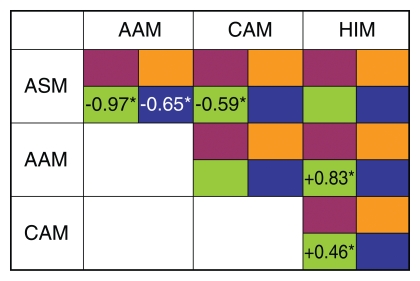
The cross-racial differences assessed with analysis of variance among the four races in the four divided age subsets (Fig 2) are presented in Figure 3.
Figure 3a:
Charts show cross-racial comparisons of (a) girls and (b) boys. Data are shown only if differences are significant (P ≤ .05). Each racial block was divided into four age groups, as described in Figure 2. The plus and minus signs indicate under- and overestimation of bone age, respectively, by radiologists in comparing rows with columns. AAF = African American girl, AAM = African American boy, ASF = Asian girl, ASM = Asian boy, CAF = white girl, CAM = white boy, HIF = Hispanic girl, HIM = Hispanic boy.
Figure 3b:
Charts show cross-racial comparisons of (a) girls and (b) boys. Data are shown only if differences are significant (P ≤ .05). Each racial block was divided into four age groups, as described in Figure 2. The plus and minus signs indicate under- and overestimation of bone age, respectively, by radiologists in comparing rows with columns. AAF = African American girl, AAM = African American boy, ASF = Asian girl, ASM = Asian boy, CAF = white girl, CAM = white boy, HIF = Hispanic girl, HIM = Hispanic boy.
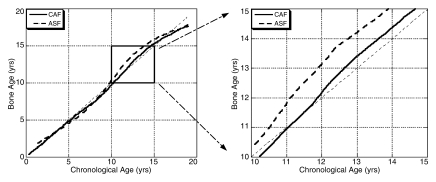
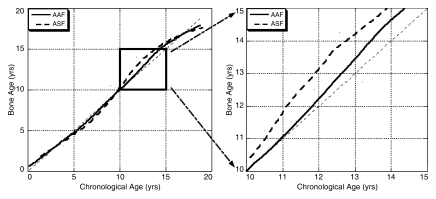
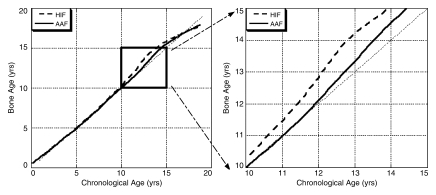
Figure 3a shows that in girls, significant mean differences of average reading between races were observed in the third age subset (10–13 years). Radiologists overestimated bone age in Asian girls in comparison with their African American and white peers by approximately 0.59 year and 0.70 year, respectively. Similarly, radiologists overestimated bone age by 0.58 year in Hispanic girls when compared with African American girls. Figure 4 shows plots of bone age versus chronologic age in Asian girls versus white girls, Asian girls versus African American girls, and Hispanic girls versus African American girls. In each comparison, the figure on the left covers the entire age range (1–18 years), whereas the figure on the right shows a close-up view of the third age subset (10–13 years).
Figure 4a:
Graphs show comparisons of three racial pairs. The x-axis shows the chronologic age, the y-axis shows the average bone age, and the thin 45° dotted line shows the normal standard comparison in (a) Asian girls (ASF) versus white girls (CAF), (b) Asian girls versus African American girls (AAF), and (c) Hispanic girls (HIF) versus African American girls. The graphs on the left show the plots for the entire age range, whereas the graphs on the right are close-up plots for the third age subset (10–13 years).
Figure 4b:
Graphs show comparisons of three racial pairs. The x-axis shows the chronologic age, the y-axis shows the average bone age, and the thin 45° dotted line shows the normal standard comparison in (a) Asian girls (ASF) versus white girls (CAF), (b) Asian girls versus African American girls (AAF), and (c) Hispanic girls (HIF) versus African American girls. The graphs on the left show the plots for the entire age range, whereas the graphs on the right are close-up plots for the third age subset (10–13 years).
Figure 4c:
Graphs show comparisons of three racial pairs. The x-axis shows the chronologic age, the y-axis shows the average bone age, and the thin 45° dotted line shows the normal standard comparison in (a) Asian girls (ASF) versus white girls (CAF), (b) Asian girls versus African American girls (AAF), and (c) Hispanic girls (HIF) versus African American girls. The graphs on the left show the plots for the entire age range, whereas the graphs on the right are close-up plots for the third age subset (10–13 years).
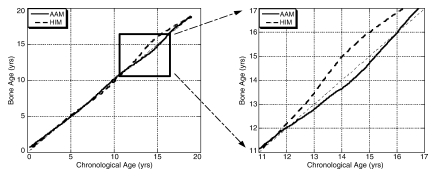
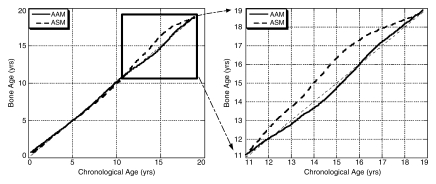
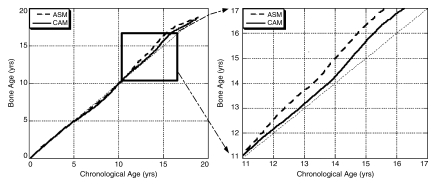
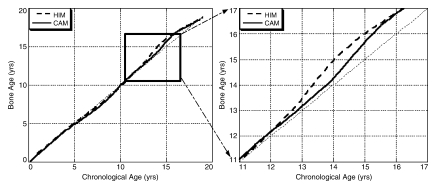
Similar patterns were also observed in boys (Fig 3). In the third age subset (11–15 years), significant overestimation of bone age of 0.97 year and 0.83 year was observed in Asian and Hispanic boys, respectively, when compared with African American boys. Overestimation of 0.65 year continued until the fourth age subset (16–18 years) when Asian boys were compared with African American boys. Furthermore, comparison of white boys with Asian and Hispanic boys in the third age subset (11–15 years) resulted in significant overreading of 0.59 year and 0.46 year, respectively. Figure 5 shows bone age versus chronologic age in four racial pairs: (a) Hispanic boys versus African American boys, (b) Asian boys versus African American boys, (c) Asian boys versus white boys, and (d) Hispanic boys versus white boys.
Figure 5a:
Comparisons (as in Fig 4) of (a) Hispanic (HIM) versus African American boys (AAM), (b) Asian (ASM) versus African American boys; (c) Asian versus white boys (CAM); and (d) Hispanic versus white boys. Left: entire age range. Right: third age subset (11–15 years) (a, c, d) and third and fourth age subsets (11–18 years) (b).
Figure 5b:
Comparisons (as in Fig 4) of (a) Hispanic (HIM) versus African American boys (AAM), (b) Asian (ASM) versus African American boys; (c) Asian versus white boys (CAM); and (d) Hispanic versus white boys. Left: entire age range. Right: third age subset (11–15 years) (a, c, d) and third and fourth age subsets (11–18 years) (b).
Figure 5c:
Comparisons (as in Fig 4) of (a) Hispanic (HIM) versus African American boys (AAM), (b) Asian (ASM) versus African American boys; (c) Asian versus white boys (CAM); and (d) Hispanic versus white boys. Left: entire age range. Right: third age subset (11–15 years) (a, c, d) and third and fourth age subsets (11–18 years) (b).
Figure 5d:
Comparisons (as in Fig 4) of (a) Hispanic (HIM) versus African American boys (AAM), (b) Asian (ASM) versus African American boys; (c) Asian versus white boys (CAM); and (d) Hispanic versus white boys. Left: entire age range. Right: third age subset (11–15 years) (a, c, d) and third and fourth age subsets (11–18 years) (b).
DISCUSSION
An up-to-date DHA for four ethnic groups has been developed with 1390 hand and wrist radiographs obtained in Asian, African American, white and Hispanic boys and girls with normal skeletal development aged between 1 day and 18 years. Each case was read by two pediatric radiologists working independently on the basis of the Greulich and Pyle atlas standard. The normality and consistency of the data were ensured by radiologists' readings and a rigorous quality assurance data collection protocol. Hand radiographs were digitized and stored in the DICOM format, which facilitates image viewing and transmission in the clinical environment for training and image-assisted daily clinical operation.
Previous studies, in which researchers examined the applicability of the Greulich and Pyle atlas for use in contemporary children, have been performed: Mora et al (7) examined 534 children of European and African descent, and Ontell et al (5) collected data in 765 trauma patients of four races. Both of these studies are similar to our study in that they involved use and evaluation of the Greulich and Pyle atlas in each of the racial groups. However, in neither study did the authors compare cross-racial differences. Our study differed from the aforementioned studies in that our study consisted of a robustly designed database of 1390 carefully chosen healthy subjects and we compared cross-racial growth differences.
By using the DHA, we observed differences in the readings of two pediatric radiologists in subjects of four races on the basis of the Greulich and Pyle atlas standard, and we recorded these differences systematically. Our results show the cross-racial differences between skeletal growth patterns of Asian and Hispanic children and skeletal growth patterns of white and African American children. Radiologists assigned a bone age that was relatively close to the chronologic age of African American and white children. However, bone age and chronologic age were significantly different in Asian and Hispanic children. Cross-racial differences in four age subsets indicate that Asian and Hispanic children mature earlier than African American and white children. This holds true for girls and boys, especially those aged 10–13 years and 11–15 years, respectively.
Genetic differences, diet, and nutritional intake may influence variations in the bone growth pattern. This calls into question the applicability of the Greulich and Pyle atlas as a reference for children of different races. Our results suggest that bone age assessment in children can be improved by considering the ethnic population. An institutional review board–approved clinical validation study of the usefulness of the DHA is being performed at our institution (Los Angeles County Women's and Children's Hospital, Los Angeles, Calif).
Our study had limitations that should be considered in future research. First, all subjects enrolled in this study were from the Los Angeles metropolitan area. Further studies with data collection from different geographic regions are necessary to study regional factors in skeletal development. Second, mixed ethnicity was not considered. This issue should be addressed in future studies, with a view toward comparison of skeletal development in children with mixed ethnicity with that in children of their parents' ethnicities. Third, we investigated the effect of ethnicity in only those children whose skeletal development was considered normal on the basis of the Greulich and Pyle atlas. Fourth, a subject's ethnicity is usually unavailable in daily practice. This limits future applications of the DHA in clinical practice. This issue needs to be addressed in patient care when enough attention has been brought to the racial factor in bone age assessment in children.
The DHA provides an up-to-date standard with which to classify normal bone growth and development in children. Currently, the DHA is accessible from the World Wide Web for online learning and teaching. Also, a computer-assisted bone age assessment system for use with the DHA has been developed and distributed to several international institutions (20) for use in a multicenter study.
Advances in Knowledge.
A digital hand atlas (DHA) of 1390 hand-wrist radiographs obtained in Asian, African American, white, and Hispanic boys and girls with normal skeletal development has been developed to provide an up-to-date standard with which to assess growth and development and is accessible at http://www.ipilab.org/BAAweb .
Radiologists assigned a bone age that was relatively close to the chronologic age in African American and white children; however, cross-racial differences indicated that Asian and Hispanic children mature sooner than do African American and white children, especially between 10 and 13 years of age in girls and between 11 and 15 years of age in boys.
Implication for Patient Care.
The discovery of cross-racial differences at different age ranges sheds light on the possibility that bone age assessment in children can be improved by considering a child's ethnicity, especially when accurate assessment of bone age is crucial to patient care (optimal surgical intervention in children with leg length discrepancies).
Acknowledgments
We thank the National Institutes of Health for supporting this research; the Bone Development Group at the Childrens Hospital, Los Angeles, Calif, for data collection; and James Hill, MD, JD, for his assistance in the literature search and manuscript revision.
Received March 10, 2008; revision requested May 1; revision received April 3; accepted June 20; final version accepted July 9.
Authors stated no financial relationship to disclose.
Funding: This work was supported by the National Institutes of Health (grants R01 LM06270, R01 EB000298).
From the 2007 RSNA Annual Meeting.
Supported by National Institutes of Health grants R01 LM 06270 and R01 EB 00298: 97-08.
Abbreviations:
- DHA
- digital hand atlas
- DICOM
- Digital Imaging and Communications in Medicine
References
- 1.Tanner JM, Healy MJR, Goldstein H, Cameron N.Assessment of skeletal maturity and prediction of adult height (TW3 method). London, England: Saunders, 2001 [Google Scholar]
- 2.Kirks D.Practical pediatric imaging. In: Diagnostic radiology of infants and children Boston, Mass: Little, Brown, 1984; 198–201 [Google Scholar]
- 3.Greulich WW, Pyle SI.Radiographic atlas of skeletal development of the hand and wrist. Stanford, Calif: Stanford University Press, 1959 [Google Scholar]
- 4.Roche AF, Roberts J, Harnill PV.Skeletal maturity of children 6–11 years: racial, geographic area and socioeconomic differentials. In: National Health Survey. Rockville, Md: Health Resources Administration, National Center for Health Statistics, 1975;1–38 [PubMed] [Google Scholar]
- 5.Ontell FK, Ivanovic M, Ablin DS, Barlow TW.Bone age in children of diverse ethnicity. AJR Am J Roentgenol 1996;167:1395–1398 [DOI] [PubMed] [Google Scholar]
- 6.Loder RT, Estle DT, Morrison K, et al. Applicability of the Greulich and Pyle skeletal age standards to black and white children of today. Am J Dis Child 1993;147:1329–1333 [DOI] [PubMed] [Google Scholar]
- 7.Mora S, Boechat MI, Pietka E, Huang HK, Gilsanz V.Skeletal age determinations in children of European and African descent: applicability of the Greulich and Pyle standards. Pediatr Res 2001;50:624–628 [DOI] [PubMed] [Google Scholar]
- 8.Masse G, Hunt EE.Skeletal maturation of the hand and wrist in West African children. Hum Biol 1963;35:3–25 [PubMed] [Google Scholar]
- 9.Gertych A, Zhang A, Sayre J, Pospiech-Kurkowska S, Huang HK.Bone age assessment of children using a digital hand atlas. Comput Med Imaging Graph 2007;31:322–331 [DOI] [PMC free article] [PubMed] [Google Scholar]
- 10.Zhang A, Tsao S, Sayre J, Gertych A, Liu BJ, Huang HK.Is Greulich and Pyle atlas still a good reference for bone age assessment? In: Horii SC, Andriole KP, eds. Proceedings of SPIE: medical imaging 2007—PACS and imaging informatics Vol 6516. Bellingham, Wash: International Society for Optical Engineering, 2007; 65161H [Google Scholar]
- 11.Pietka E, Pospiech-Kurkowska S, Gertych A, Cao F, Huang HK.Computer-assisted bone age assessment: image analysis and fuzzy classification [abstr]. Radiology 2002;225(P):75112461257 [Google Scholar]
- 12.Pietka BE, Pospiech S, Gertych A, Cao F, Huang HK, Gilsanz V.Computer automated approach to the extraction of epiphyseal regions in hand radiographs. J Digit Imaging 2001;14:165–172 [DOI] [PMC free article] [PubMed] [Google Scholar]
- 13.Zhang A, Gertych A, Liu BJ.Automatic bone age assessment for young children from newborn to 7-year-old using carpal bones. Comput Med Imaging Graph 2007;31:299–310 [DOI] [PMC free article] [PubMed] [Google Scholar]
- 14.Huang HK, Zhang A, Liu BJ, et al. Data grid for large-scale medical image archive and analysis. Proceedings of the 13th ACM International Conference on Multimedia Singapore: Association for Computing Machinery, 2005; 1005–1013 [Google Scholar]
- 15.Zhang A, Gertych A, Liu BJ, Huang HK.Data mining and visualization of average images in a digital hand atlas. In: Ratib OM, Horii SC, eds. Proceedings of SPIE: medical imaging 2005—PACS and imaging informatics Vol 5748. Bellingham, Wash: International Society for Optical Engineering, 2005; 65–72 [Google Scholar]
- 16.Tanner JM.Growth at adolescence. Oxford, England: Blackwell Scientific Publications, 1962 [Google Scholar]
- 17.Huang HK.PACS and imaging informatics: basic principles and applications. Hoboken, NJ: Wiley, 2004; 504–507 [Google Scholar]
- 18.Zhang A, Zhou Z, Gertych A, Liu BJ, Huang HK.Integration of bone age assessment CAD results with the PACS diagnostic workflow utilizing DICOM structure report [abstr]. In: Radiological Society of North America scientific assembly and annual meeting program Oak Brook, Ill: Radiological Society of North America, 2006; 909 [Google Scholar]
- 19.Zhou Z, Liu BJ, Le AH.CAD-PACS integration tool kit based on DICOM secondary capture, structured report and IHE workflow profiles. Comput Med Imaging Graph 2007;31:346–352 [DOI] [PubMed] [Google Scholar]
- 20.Law M, Chan T, Tang FH, Lau TY, Huang HK, Zhang A.A retrospective study of bone age assessment of Chinese children in Hong Kong using a digital hand atlas [abstr]. In: Radiological Society of North America scientific assembly and annual meeting program Oak Brook, Ill: Radiological Society of North America, 2006; 909 [Google Scholar]


