Abstract
The apolipoprotein E family contains three major isoforms (ApoE4, E3, and E2) that are directly involved with lipoprotein metabolism and cholesterol transport. ApoE3 and apoE4 differ in only a single amino acid with an arginine in apoE4 changed to a cysteine at position 112 in apoE3. Yet only apoE4 is recognized as a risk factor for Alzheimer's disease. Here we used 19F NMR to examine structural differences between apoE4 and apoE3 and the effect of the C-terminal domain on the N-terminal domain. After incorporation of 5-19F-tryptophan the 1D 19F NMR spectra were compared for the N-terminal domain and for the full length proteins. The NMR spectra of the N-terminal region (residues 1–191) are reasonably well resolved while those of the full length wild-type proteins are broad and ill-defined suggesting considerable conformational heterogeneity. At least four of the seven tryptophan residues in the wild type protein appear to be solvent exposed. NMR spectra of the wild-type proteins were compared to apoE containing four mutations in the C-terminal region that gives rise to a monomeric form either of apoE3 under native conditions (Zhang et al., Biochemistry 2007; 46: 10722–10732) or apoE4 in the presence of 1 M urea. For either wild-type or mutant proteins the differences in tryptophan resonances in the N-terminal region of the protein suggest structural differences between apoE3 and apoE4. We conclude that these differences occur both as a consequence of the Arg158Cys mutation and as a consequence of the interaction with the C-terminal domain.
Keywords: 19F-tryptophan, apoE monomers, NMR assignments, denaturation, N-terminal region.
Introduction
The family of the apolipoproteinE proteins are multimers consisting of monomers of a 34 kDa, 299 amino acid, protein. Epidemiological studies have indicated that apolipoprotein E4 (apoE4) is a genetic risk factor for late onset Alzheimer's disease. ApoE3, which is the most common isoform in humans, has a single mutation of an arginine to a cysteine at position 112. Lipid-free apoE is known to exist primarily as tetramers of the 34 kDa monomer at low μM concentrations while particles of higher molecular weights are observed at higher concentrations.1–5 The complexities due to the presence of multiple, high molecular weight species have made structural determination of the full length protein difficult and currently no such structure exists. The apoE protein consists of a C- and N-terminal domain and the structure of an N-terminal fragment (residues 1–191), which does not self-associate, has been solved by X-ray crystallography6 and more recently by NMR.7 This domain is believed to be responsible for binding to the LDL receptor while regions of the C-terminal domain (192-277) are believed to be responsible for apoE self association.8 This domain is postulated to be α-helical from CD measurements9 but its complete structure is unknown. A structure of the full length protein has been proposed based on distance constraints obtained from electron paramagnetic resonance measurements of the whole protein3 and the known structure of the N-terminal domain. The N-terminal domain is a four helix bundle linked to the C-terminal domain through a long hinge region. For apoE4 a salt bridge that is lacking in apoE3 is proposed to form between Arg61 and Glu255 resulting in an interaction between the two domains3 although other interactions have also been proposed.7 Recently two mutants involving four to five mutations in the C-terminal domain of apoE3 have been described which result in a protein that remains monomeric even at 25 mg/mL.10 Using this mutation, Zhang et al. have reported the complete NMR backbone assignment of monomeric apoE3.11 Provided that these mutants are structurally similar to wild-type, they would be useful systems to examine the properties of the monomeric forms of these proteins.
In previous publications, we have incorporated 19F-labeled amino acids into proteins followed by 19F NMR measurements.12–17 The 19F nucleus is very sensitive to its surroundings and small changes in the structure can be detected by chemical shifts. Additionally, the use of a 19F cryoprobe allows spectra to be collected at reasonably low protein concentrations and, in general, the 1D spectra are relatively uncomplicated. In this article we have incorporated 5-19F-tryptophan into both apoE3 and apoE4 to address the issue of differences between these proteins. Experimental results were obtained for the N-terminal region, for the wild-type and for the protein containing C-terminal mutations. The data show that differences exist in the tryptophan NMR spectrum of N-terminal domain compared to the full length protein suggesting conformational changes as a consequence of the presence of the C-terminal domain as well as the arginine to cysteine mutation at position 112. Such conformational changes appear in both apoE4 and apoE3. In addition the tryptophans in C-terminal domain appear to be solvent exposed. We conclude that there is considerable conformational heterogeneity in the whole protein as a consequence of the C-terminal region interacting with the N-terminal region of the protein.
Results
19F NMR spectra of the N-terminal domain of apoE4 and apoE3
Figure 1 shows the 19F NMR spectra for the N-terminal fragment (residues 1-191) of apoE4 [Fig. 1(A)] and apoE3 [Fig. 1(B)] in 20 mM HEPES, pH 7.4 buffer containing 80 mM NaCl and 0.1% β-mercaptoethanol. This domain contains 4 tryptophan residues and 4 NMR peaks can be seen in both spectra. The peak at −49.5 ppm is the same as that of free 5-19F-tryptophan, suggesting that this tryptophan is solvent exposed and most likely represents Trp20 which appears to be solvent exposed in the NMR structure of the N-terminal domain.7 The remaining tryptophan residues are Trp26, Trp34 and Trp39. Of these, the mutation Trp39Phe clearly removed the resonance at −48.9 ppm in both the apoE3-C-terminal mutated protein and the N-terminal domain [Supporting Information Fig. 1(A)]. A similar mutation at Trp34 was ambiguous and the assignment is tentative at this time [Supporting Information Fig. 1(B)]. This ambiguity may arise due to small chemical shift difference between Trp26 and Trp34 or due to conformational heterogeneity in the N-terminal domain surrounding these residues. There are clear differences between spectra of the N-terminal domain between apoE4 and apoE3, suggesting that the mutation Arg112Cys induces structural changes. The tryptophan residue which seems to differ most is Trp39 which, as shown later, is also affected due to interactions between the N- and the C-terminal domains of the apoE proteins.
Figure 1.
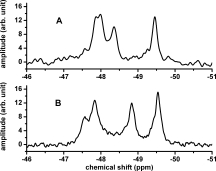
19F NMR spectrum of N-terminal domain (residues 1-191) of (A) wt-apoE4 and (B) wt-apoE3. Data collected at 22°C in 20 mM HEPES, 80 mM NaCl, 0.1% βME at pH 7.4. The protein concentrations were 30 μM. The peaks at −48.4 ppm in A and −48.9 ppm in B are assigned to Trp39 [see Supporting Information Fig. 1(A)].
19F NMR spectra of wild type apoE4 and apoE3
Figure 2 shows the NMR spectra of wt-apoE4 (blue) and wt-apoE3 (red) in 20 mM Hepes buffer containing 80 mM NaCl and 0.1% β-mercaptoethanol at pH 7.4. In contrast to the spectra of the N-terminal domain, the peaks are broad and ill-defined for the both apoE3 and apoE4. The spectra of apoE3 and apoE4 are similar but not identical and show that all the chemical shifts of 19F-tryptophan appear within a region of −47 to −50 ppm. There is a large peak at −49.6 ppm that has the same chemical shift as free 5-19F-tryptophan. The area under the peak at this chemical shift corresponds to about 50% percent of the total area suggesting that 3-4 of the 7 tryptophan residues are solvent exposed rather than the single solvent exposed tryptophan in the N-terminal domain. The differences between these spectra and the corresponding spectra of the N-terminal domains may arise either from the interaction of C-terminal and N-terminal domains or from oligomer formation.
Figure 2.
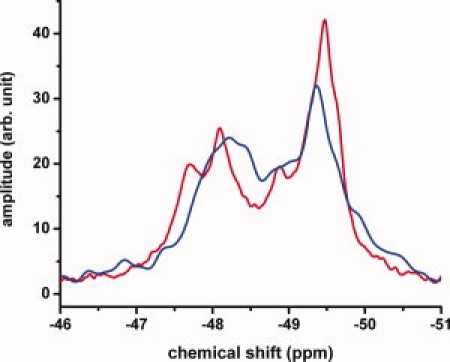
19F NMR spectrum of wt-apoE4 (blue) and wt-apoE3 (red). Data collected at 22°C in 20 mM HEPES, 80 mM NaCl, 0.1% βME at pH 7.4. The protein concentration was 50 μM. For comparison the spectra were normalized to the same total intensity under the peaks.
19F NMR of the C-terminal mutants of apoE3 and apoE4
Since the wild-type proteins are oligomers of the 34 kDa monomer, the monomeric forms of apoE were prepared following the procedure of Zhang et al.10 who showed that by making four to five mutations in the C-terminal region a monomeric form of apoE3 could be obtained. Figure 3 shows the NMR spectra of both mutated apoE3 and mutated apoE4. Since one of the mutations used by Zhang et al. was a tryptophan to arginine mutation, these proteins contain only 6 tryptophan residues. As with the wild-type proteins, there are differences in the NMR spectra between C-terminal mutated apoE4 and C-terminal mutated apoE3 but the spectra remain ill-defined. While the presence of oligomers does complicate the spectrum, a comparison of Figures 1–3 would indicate the interaction of the N- and C-terminal domains is a more important factor in affecting the structure of the N-terminal domain.
Figure 3.
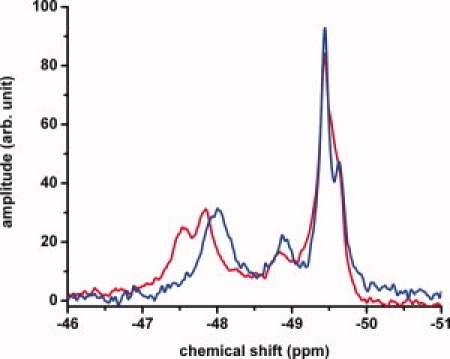
19F NMR spectrum of apoE4-C-terminal mutant (blue) and apoE3-C-terminal mutant (red). Experiments performed using 60 μM apoE mutants in 20 mM HEPES, 80 mM NaCl, 0.1% βME and pH 7.4. For comparison, the spectra were normalized to the same total intensity under the peaks.
Denaturation of apoE isoforms using CD
To determine the relative stability of the apoE-C-terminal mutants, urea denaturation studies of the apoE isoforms were performed using the CD signal at 222 nm. Figure 4 shows the urea denaturation of the wild-type and the apoE-C-terminal mutants. The denaturation profiles of wt-apoE4 (solid squares) and wt-apoE3 (solid stars) appear similar while the denaturation profiles of apoE-C-terminal mutants (solid triangles and solid circles for apoE4 and apoE3 mutants, respectively) are shifted to the right suggesting that the C-terminal mutants are more stable as well as differing from each other. The data were fit using a two state model for illustration purpose (solid lines). While the fits are reasonable, some fits are poor, indicating a more complex denaturation model. To determine the cause of these differences, we performed NMR experiments as a function of urea using the apoE-C-terminal mutants.
Figure 4.
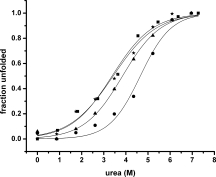
Urea denaturation of apoE mutants measured by circular dichroism at 222 nm. The normalized unfolded fraction of apoE has been plotted as a function of urea concentrations for wt-apoE4 (▪), the C-terminal mutant of apoE4 (▴), wt-apoE3 (★) and the C-terminal mutant of apoE3 (•). The solid lines are fits of the data with a two state model.18 Experiments performed with 2–3 μM of apoE in 20 mM phosphate, 0.1% βME at pH 7.4 and 22°C at each urea concentration.
Urea denaturation of apoE isoforms using 19F NMR
19F NMR spectra of mutated apoE4 and apoE3 as a function of the urea concentration are shown in Figures 5 and 6 respectively. In Figure 5, it can be seen that the spectra for C-terminal mutant of apoE4 are almost the same between 0 and 1 M urea. Above 1 M urea there is increasing intensity at −49.6 ppm as the protein denatures with denaturation appearing to be complete by 4 M urea. The appearance of peaks at the chemical shift of free 19F-tryptophan is typical of a denatured protein.15,19 Those peaks associated with the N-terminal domain (from −47.5 to −49 ppm) all appear to decrease equally as the protein denatures. Similar denaturation experiments with the C-terminal mutant of apoE3 are shown in Figure 6. In this case, denaturation of the apoE3-C-terminal mutant is not complete even at 5 M urea. In contrast to the data for apoE4, a peak at −48.8 ppm which is broad in the absence of urea persists and appears to become progressively sharper at urea concentrations up to 4 M. This peak then almost disappears at 5 M urea. This peak which is clear and distinct in the spectrum of the N-terminal domain of apoE3 [Fig. 1(B)] is assigned, by mutagenesis, to Trp39. However, the same peak is broadened and ill-defined in the spectrum of the C-terminal mutant of apoE3, most likely due to the interaction of the C-terminal domain with the N-terminal domain. Denaturation of the C-terminal region in presence of 2–4 M urea appears to sharpen this peak by reducing the domain–domain interaction.
Figure 5.
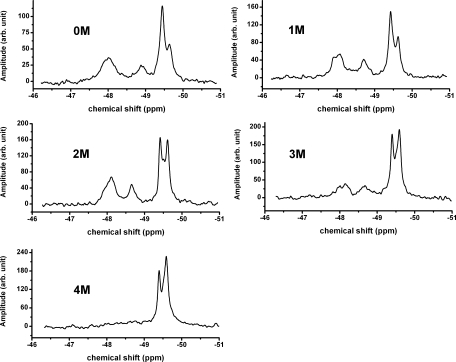
Urea denaturation of the apoE4-C-terminal mutant. Experiments performed in 20 mM HEPES, 80 mM NaCl, 0.1% βME at pH 7.4 and 22 °C. A 10 M stock urea solution in 20 mM Hepes buffer, pH 7.4 was added to the solution in appropriate amounts to make 1, 2, 3, 4, and 5 M urea solutions. The protein concentration at 0 M urea was 60 μM. The data shown are corrected for dilution.
Figure 6.
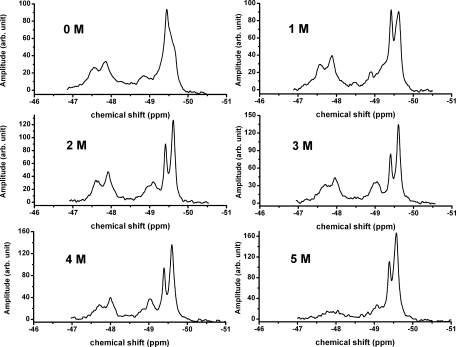
Urea denaturation of the apoE3-C-terminal mutant. Experiments performed in 20 mM HEPES, 80 mM NaCl, 0.1% βME at pH 7.4 and 22°C. A 10 M stock urea solution in 20 mM Hepes buffer, pH 7.4 was added to the solution in appropriate amounts to make 1, 2, 3, and 4 M urea solutions. The protein concentration at 0 M urea was 60 μM. The data shown are corrected for dilution.
For a monomeric protein, the total intensity under the NMR peaks should be constant as a function of denaturant concentration. Table I shows that this is true for the C-terminal mutant of apoE3 described by Zhang et al. It is not true, however either for wild type or for the C-terminal mutant of apoE4, suggesting that the mutations in the case of apoE4 are not sufficient to make the protein monomeric. Instead 1–2 M urea is required to dissociate the oligomeric wild type apoE4 to the monomeric form. For the dissociation of the C-terminal mutant of apoE4 addition of 1 M urea appears to be required. It should be noted, however, from Figure 5 that the NMR spectrum of the C-terminal mutant of apoE4 is essentially the same at 0 and 1 M urea.
Table 1.
Area Under the Total 19F NMR Spectrum as a Function of Urea Concentration for Wild Type apoE4 and for the C-terminal Mutants of apoE4 and apoE3
| 0M | 1M | 2M | 3M | 4M | 5M | |
|---|---|---|---|---|---|---|
| Wt-apoE4 | 0.55 | 0.69 | 0.89 | 0.93 | 1.0 | 0.90 |
| Mutant-apoE4 | 0.64 | 0.91 | 0.99 | 1.0 | 0.93 | – |
| Mutant-apoE3 | 0.86 | 0.89 | 0.94 | 1.0 | 0.91 | 0.86 |
Experiments performed in 20 mM HEPES, 80 mM NaCl, 0.1% βME at pH 7.4 and 22°C. A 10 M stock urea solution in 20 mM Hepes buffer, pH 7.4 was added to the solution in appropriate amounts to make 1, 2, 3, 4, and 5 M urea solutions. The starting protein concentration for the wt-apoE4 is 50 μM and for C-terminal mutants of apoE is 60 μM. The data shown are normalized.
Discussion
It is well established that apoE4 is a risk factor for Alzheimer's Disease while the other members of the family, apoE3 and apoE2, are not.20–25 Yet the only difference is a single amino acid change, an arginine to cysteine mutation at position 112, in the N-terminal domain of apoE3. In the discussion below we will compare and contrast the differences between apoE4, apoE3 and their N-terminal domains.
Assignment of the NMR peaks of the N-terminal Domain
Of the 4 tryptophan residues in the N-terminal domain, the NMR structure shows Trp20 appears to be solvent exposed while the others are buried to different extents.7 Based on our previous studies, we would conclude that Trp20 would be expected to have 19F chemical shift located at the position of free 5-19F-tryptophan. Site directed mutagenesis, a Trp39Phe mutation in the C-terminal mutant of apoE3 clearly shows that the peak at −48.8 ppm corresponds to Trp39 [Supporting Information Fig. 1(A)]. Similar mutations could not distinguish between Trp26 and Trp34.
19F NMR Spectra of wt-apoE4 and E3
As noted earlier, Figure 2 shows that the NMR spectra for both wt-apoE4 and wt-apoE3 are broad and ill-defined. Compared to data with other proteins15,19 and with that of the N-terminal fragment in Figure 1, the spectra suggest that there is considerable conformational heterogeneity in the whole protein presumably induced by the presence of the C-terminal domain as discussed below. This conclusion is strengthened by the observation of a large peak at the resonance of free 519F-tryptophan suggesting that in the whole protein at least three to four of the seven tryptophan residues are solvent exposed and some may be located in disordered regions.
Comparison of the apoE-C-terminal mutants with Wild Type apoE
ApoE proteins are known to form oligomers which range from dimers to tetramers and higher molecular weight forms.1–5 Because oligomerization could make interpretation of the NMR spectra difficult, we investigated the monomeric form of the protein. Figure 3 shows that the NMR spectra for the monomeric apoE3 is still broad and poorly resolved suggesting that the nature of the spectrum is not an issue related to oligomerization. As noted earlier, the spectrum of the N-terminal fragment is considerably cleaner than that of the whole protein. It should be noted, however, that although these mutations yield the monomeric form of apoE3, the data of Table I shows that 1 M urea, in addition to the mutations, is required to yield the monomeric form of apoE4.
Previous structural studies have focused primarily on the structure of the N-terminal domain as indicative of that structure within the whole protein. Two x-ray structures of the N-terminal domain of apoE4 and apoE3 (PDB:1B68 and PDB:1NFN, respectively) show a four-helical bundle with little or no difference in the backbone or the tryptophan side chains. On the other hand, an NMR structure of the N-terminal domain of apoE3, shown in Figure 7,7 does differ from the x-ray structure of the apoE4 N-terminal domain but that difference may be due to the fact that the NMR structure includes the first N-terminal 23 residues and the x-ray structures do not. Differences between the N-terminal domain of apoE3 and apoE4 presumably arise from arginine being replaced by cysteine in apoE3, but it is clear that interaction of the C- and N-terminal domains occur in both apoE3 and apoE4. Thus the spectra of the N-terminal domains show clear differences from that of the whole protein especially for Trp39. These results suggest, as indicated above, that the structure of the N-terminal domain is affected by the presence of the C-terminal domain in both apoE3 and apoE4. Figure 7 also shows the location of the 4 tryptophan residues in the N-terminal domain as well as that of the cysteine at position 112. It should be noted that all four tryptophan residues are 13 Å or more distant from the cysteine residue. Therefore the observed spectrum changes in the N-terminal domain of the full length proteins suggest that structural changes are propagated throughout the N-terminal domain as a consequence of interaction with the C-terminal domain.
Figure 7.
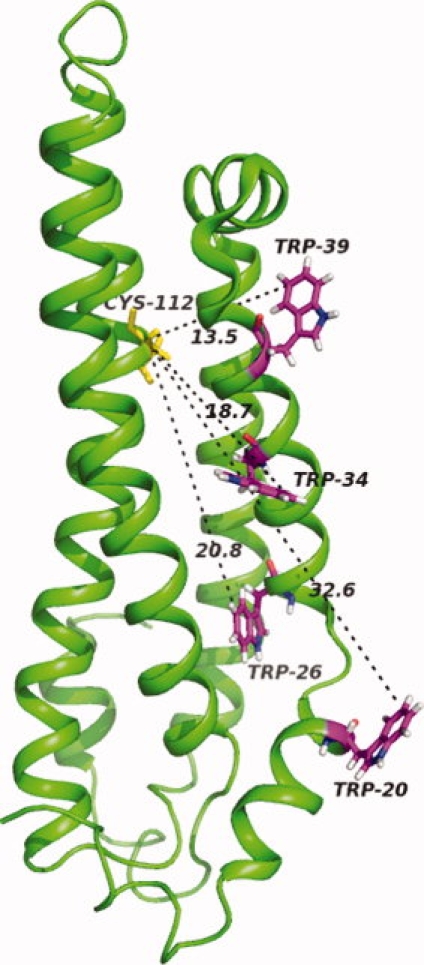
NMR structure of the N-terminal domain of wt-ApoE37 (PDB: 2KC3). Distances from the Cys112 to the 5′ position of Trp20, 26, 34, and 39 are shown in Å. Figure made using Pymol (DeLano, W.L. The PyMOL Molecular Graphics System, 2002, http://www.pymol.org).
The Nature of the C-terminal Domain
The C-terminal domain has been proposed to be primarily an α-helical structure.3 A comparison of the NMR data of the N-terminal region to that of the whole apoE3 or apoE4 protein shows more intensity at the chemical shift of free 5-19F-tryptophan in the whole protein suggesting that the tryptophan residues in the C-terminal domain are solvent exposed and could be located in disordered regions rather than in defined structures. This conclusion is supported by recent NMR data in which the backbone resonances of apoE3 have been assigned and structural predictions made on the basis of chemical shifts.11 The data suggest helical regions in the C-terminal domain (residues approximately 200–299) between 210–233 and 238–260 while the tryptophan residues in the C-terminal domain are located at positions 210, 264, and 276.
The NMR Spectra of Wt and C-terminal mutants as a Function of Urea
Figure 4 shows the denaturation of wild-type and C-terminal mutants of apoE as measured by CD changes at 222 nm. These data show that the mutant proteins appear more stable than the wild-type proteins. This apparent increase in stability and the inability to oligomerize may be correlated if one assumes that the mutations increase the stability of the C-terminal domain as well as preventing some protein–protein interaction. It has been suggested that low urea concentrations result in loss of structure in the C-terminal domain while higher urea concentrations represents loss of structure in the N-terminal domain.1,26 It has also been postulated that the C-terminal domain of apoE is involved in apoE self association. The requirement of 1 M urea to dissociate the apoE4-C-terminal mutant may be due to more extensive interactions between the N- and C-terminal domains postulated for apoE4.3 The differences in the CD urea denaturation curves between the apoE-C-terminal mutants prompted a comparison of the urea dependence of the NMR structures. Figures 5 and 6 shows the urea dependence of 19F NMR spectra of mutated apoE4 (Fig. 5) and mutated apoE3 (Fig. 6). It is clear that the two isoforms differ in stability since 4 M urea completely denatures apoE4 but not apoE3. Comparison of the data of Figures 5 and 6 indicate a difference in resonance assigned to Trp39 at −48.8 ppm (see Supporting Information and Fig. 7). While these results suggest differences in the interaction of the N- and C-terminal domains of apoE3 and apoE4 it is important to note that such interactions occur in both apoE3 and apoE4.
The data of Table I reinforce this notion showing that mutations in the C-terminal domain did not make a completely monomeric form of apoE4 but required the addition of 1 M urea.
In summary, while the arginine to cysteine mutation in the N-terminal domain of apoE3 leads to some structural changes, we show that there are structural differences in the N-terminal region as a consequence of the interaction with the C-terminal domain. We conclude that there is considerable conformational heterogeneity in the full length proteins which arises from this interaction of the C- and N-terminal domains in both apoE3 and apoE4.
Materials and methods
Protein expression and purification
The plasmid for the thioredoxin fusion protein of the wt-apoE4 was a kind gift from Dr. Karl Weisgraber (Gladstone Institute, San Francisco). Mutations were introduced into the c-DNA of apoE4-wt using the QuikChange site-directed mutagenesis kit (Stratagene). All sequences were verified using DNA sequencing. Escherichia coli (strain DL41) was grown in defined media to OD600 = 0.6. To incorporate labeled tryptophan the cells were harvested and resuspended in fresh defined media containing 0.2 mM 5-19F-tryptophan. After 30 minutes protein production was induced with 1 mM Isopropyl β-d-1-thiogalactopyranoside for 2 hours. The rest of the purification protocol is essentially same as described by Hatters et al.27 One to 4 mg of pure apoE was obtained from 1 L culture. To obtain the N-terminal fragment (22kDa) the full length apoE was cleaved with bovine alpha-thrombin and then purified by size exclusion chromatography using a Superdex 200 column in 4 M GdnCl and 0.1% β-mercaptoethanol. Protein concentrations were calculated from the extinction coefficient at 280 nm of the denatured protein. The ɛ280 used are 4.495 × 10⁴ M−1cm−1 for the wild type apoE, 3.936 × 10⁴ M−1cm−1 for the apoE-C-terminal mutants and 2.51 M−1cm−1 for the N-terminal fragment.28
Materials
5-19F-tryptophan was obtained from Sigma Aldrich. All other chemicals were reagent grade.
Fluorine NMR
19F NMR spectra were acquired on a Varian Unity-Plus 500MHz spectrometer operating at 470.3 MHz with a Varian Cryo-Q open cycle cryogenic system. The 1D spectra were recorded with 1024 scans for the monomeric mutants. For the wild type mutants 4096 scans were recorded. The data were processed using VNMR software. Buffers contained 10% (v/v) D2O. There was no correction to the pH value due to D2O. ApoE stock solutions were kept in 4 M GdnCl, dialyzed against Hepes buffer (20 mM Hepes, 80 mM NaCl, pH 7.4, containing 0.1% β-mercaptoethanol) and concentrated to 50–60 μM using Vivaspin (10 kD MW cutoff) centrifugal concentrators before use. Data were referenced to −40.3 ppm of free 4-19F-Phe which was present in 100 μM in all the solutions.
Denaturation of apoE Using Fluorine NMR
A urea stock solution of 10 M was prepared in 20 mM Hepes buffer, pH 7.4 containing 10% D2O. NMR spectra were recorded using 50–60 μM apoE in buffer containing 100 μM free 4-19F-Phe as a reference. The appropriate volume of 10 M urea solution was added to this solution to obtain a final urea concentration of 1 M. The apoE was allowed to equilibrate for 2 hrs before the NMR spectrum was recorded. The same procedure was followed for experiments at 2, 3, 4, and 5 M urea. The area under the 4-19F-Phe was used to correct for dilution due to urea addition. The spectra of Figures 5 and 6 were corrected for the effect of urea based on the chemical shift changes of 4-19F-Phe in urea.
Circular Dichroism
For urea denaturation studies with CD an apoE stock solution (20–30 μM) in Hepes buffer was diluted 10-fold into 20 mM phosphate, pH 7.4 buffer containing 0 to 8 M urea. CD spectra were recorded using a Jasco J-715 spectropolarimeter. Twelve scans from 225 to 220 nm with speed of 20 nm/minute were averaged for all samples. The fraction (F) of unfolded population was calculated from
| (1) |
where θ is the CD signal at 222 nm and U and N indicating unfolded and native state, respectively. Nonlinear least squares fit is performed using Origin 7.0 (Origin Labs) with a two state model using the six-term equation adapted from Santoro and Bolen.18
Acknowledgments
The authors thank Dr. Karl Weisgraber (Gladstone Institute, San Francisco) for providing the plasmid of the thioredoxin fusion protein of the wt-apoE4. They also thank Dr. Greg DeKoster for providing expertise regarding the NMR experiments.
Glossary
Abbreviations:
- apoE-C-terminal mutant
apoE3 or apoE4 that have the following mutations in the C-terminal domain: F257A, W264R, L279Q, V287E
- CD
circular dichroism
- GdnCl
guanidine hydrochloride
- HEPES
4-(2-Hydroxyethyl)piperazine-1-ethanesulfonic acid
- βME
β-mercaptoethanol.
References
- 1.Aggerbeck LP, Wetterau JR, Weisgraber KH, Wu CS, Lindgren FT. Human apolipoprotein E3 in aqueous solution. II. Properties of the amino- and carboxyl-terminal domains. J Biol Chem. 1988;263:6249–6258. [PubMed] [Google Scholar]
- 2.Chou CY, Lin YL, Huang YC, Sheu SY, Lin TH, Tsay HJ, Chang GG, Shiao MS. Structural variation in human apolipoprotein E3 and E4: secondary structure, tertiary structure, and size distribution. Biophys J. 2005;88:455–466. doi: 10.1529/biophysj.104.046813. [DOI] [PMC free article] [PubMed] [Google Scholar]
- 3.Hatters DM, Peters-Libeu CA, Weisgraber KH. Apolipoprotein E structure: insights into function. Trends Biochem Sci. 2006;31:445–454. doi: 10.1016/j.tibs.2006.06.008. [DOI] [PubMed] [Google Scholar]
- 4.Perugini MA, Schuck P, Howlett GJ. Self-association of human apolipoprotein E3 and E4 in the presence and absence of phospholipid. J Biol Chem. 2000;275:36758–36765. doi: 10.1074/jbc.M005565200. [DOI] [PubMed] [Google Scholar]
- 5.Yokoyama S, Kawai Y, Tajima S, Yamamoto A. Behavior of human apolipoprotein E in aqueous solutions and at interfaces. J Biol Chem. 1985;260:16375–16382. [PubMed] [Google Scholar]
- 6.Wilson C, Wardell MR, Weisgraber KH, Mahley RW, Agard DA. Three-dimensional structure of the LDL receptor-binding domain of human apolipoprotein E. Science. 1991;252:1817–1822. doi: 10.1126/science.2063194. [DOI] [PubMed] [Google Scholar]
- 7.Sivashanmugam A, Wang J. A unified scheme for initiation and conformational adaptation of human apolipoprotein E N-terminal domain upon lipoprotein-binding and for receptor-binding activity. J Biol Chem. 2009;284:14657–14666. doi: 10.1074/jbc.M901012200. [DOI] [PMC free article] [PubMed] [Google Scholar]
- 8.Weisgraber KH. Apolipoprotein E: structure-function relationships. Adv Protein Chem. 1994;45:249–302. doi: 10.1016/s0065-3233(08)60642-7. [DOI] [PubMed] [Google Scholar]
- 9.Segrest JP, Jones MK, De Loof H, Brouillette CG, Venkatachalapathi YV, Anantharamaiah GM. The amphipathic helix in the exchangeable apolipoproteins: a review of secondary structure and function. J Lipid Res. 1992;33:141–166. [PubMed] [Google Scholar]
- 10.Zhang Y, Vasudevan S, Sojitrawala R, Zhao W, Cui C, Xu C, Fan D, Newhouse Y, Balestra R, Jerome WG, Weisgraber K, Li Q, Wang J. A monomeric, biologically active, full-length human apolipoprotein E. Biochemistry. 2007;46:10722–10732. doi: 10.1021/bi700672v. [DOI] [PubMed] [Google Scholar]
- 11.Zhang Y, Chen J, Wang J. A complete backbone spectral assignment of lipid-free human apolipoprotein E (apoE) Biomol NMR Assign. 2008;2:207–210. doi: 10.1007/s12104-008-9122-8. [DOI] [PubMed] [Google Scholar]
- 12.Bann JG, Pinkner J, Hultgren SJ, Frieden C. Real-time and equilibrium (19)F-NMR studies reveal the role of domain-domain interactions in the folding of the chaperone PapD. Proc Natl Acad Sci USA. 2002;99:709–714. doi: 10.1073/pnas.022649599. [DOI] [PMC free article] [PubMed] [Google Scholar]
- 13.Frieden C. The kinetics of side chain stabilization during protein folding. Biochemistry. 2003;42:12439–12446. doi: 10.1021/bi030192l. [DOI] [PubMed] [Google Scholar]
- 14.Frieden C, Hoeltzli SD, Bann JG. The preparation of 19F-labeled proteins for NMR studies. Methods Enzymol. 2004;380:400–415. doi: 10.1016/S0076-6879(04)80018-1. [DOI] [PubMed] [Google Scholar]
- 15.Hoeltzli SD, Frieden C. 19F NMR spectroscopy of [6-19F]tryptophan-labeled E. coli dihydrofolate reductase: equilibrium folding and ligand binding studies. Biochemistry. 1994;33:5502–5509. doi: 10.1021/bi00184a019. [DOI] [PubMed] [Google Scholar]
- 16.Hoeltzli SD, Frieden C. Real-time refolding studies of 6-19F-tryptophan labeled Escherichia coli dihydrofolate reductase using stopped-flow NMR spectroscopy. Biochemistry. 1996;35:16843–16851. doi: 10.1021/bi961896g. [DOI] [PubMed] [Google Scholar]
- 17.Li H, Frieden C. NMR studies of 4-19F-phenylalanine-labeled intestinal fatty acid binding proteevidence for conformational heterogeneity in the native state. Biochemistry. 2005;44:2369–2377. doi: 10.1021/bi047600l. [DOI] [PubMed] [Google Scholar]
- 18.Santoro MM, Bolen DW. Unfolding free energy changes determined bu the linear extrapolation method. 1. Unfolding of phenylmethanesulfonyl alpha-chymotrypsin using different denaturants. Biochemistry. 1988;27:8063–8068. doi: 10.1021/bi00421a014. [DOI] [PubMed] [Google Scholar]
- 19.Ropson IJ, Frieden C. Dynamic NMR spectral analysis and protein folding: identification of a highly populated folding intermediate of rat intestinal fatty acid-binding protein by 19F NMR. Proc Natl Acad Sci USA. 1992;89:7222–7226. doi: 10.1073/pnas.89.15.7222. [DOI] [PMC free article] [PubMed] [Google Scholar]
- 20.Corder EH, Woodbury MA. Genetic heterogeneity in Alzheimer's disease: a grade of membership analysis. Genet Epidemiol. 1993;10:495–499. doi: 10.1002/gepi.1370100628. [DOI] [PubMed] [Google Scholar]
- 21.Corder EH, Saunders AM, Strittmatter WJ, Schmechel DE, Gaskell PC, Small GW, Roses AD, Haines JL, Pericak-Vance MA. Gene dose of apolipoprotein E type 4 allele and the risk of Alzheimer's disease in late onset families. Science. 1993;261:921–923. doi: 10.1126/science.8346443. [DOI] [PubMed] [Google Scholar]
- 22.Drzezga A, Grimmer T, Henriksen G, Muhlau M, Perneczky R, Miederer I, Praus C, Sorg C, Wohlschlager A, Riemenschneider M, Wester HJ, Foerstl H, Schwaiger M, Kurz A. Effect of APOE genotype on amyloid plaque load and gray matter volume in Alzheimer disease. Neurology. 2009;72:1487–1494. doi: 10.1212/WNL.0b013e3181a2e8d0. [DOI] [PubMed] [Google Scholar]
- 23.Farrer LA, Cupples LA, Haines JL, Hyman B, Kukull WA, Mayeux R, Myers RH, Pericak-Vance MA, Risch N, Van Duijn CM. Effects of age, sex, and ethnicity on the association between apolipoprotein E genotype and Alzheimer disease. A meta-analysis. APOE and Alzheimer disease meta analysis consortium. JAMA. 1997;278:1349–1356. [PubMed] [Google Scholar]
- 24.Saunders AM, Strittmatter WJ, Schmechel D, George-Hyslop PH, Pericak-Vance MA, Joo SH, Rosi BL, Gusella JF, Crapper-Maclachlan DR, Alberts MJ. Association of apolipoprotein E allele epsilon 4 with late-onset familial and sporadic Alzheimer's disease. Neurology. 1993;43:1467–1472. doi: 10.1212/wnl.43.8.1467. [DOI] [PubMed] [Google Scholar]
- 25.Strittmatter WJ, Roses AD. Apolipoprotein E and Alzheimer disease. Proc Natl Acad Sci USA. 1995;92:4725–4727. doi: 10.1073/pnas.92.11.4725. [DOI] [PMC free article] [PubMed] [Google Scholar]
- 26.Sakamoto T, Tanaka M, Vedhachalam C, Nickel M, Nguyen D, Dhanasekaran P, Phillips MC, Lund-Katz S, Saito H. Contributions of the carboxyl-terminal helical segment to the self-association and lipoprotein preferences of human apolipoprotein E3 and E4 isoforms. Biochemistry. 2008;47:2968–2977. doi: 10.1021/bi701923h. [DOI] [PMC free article] [PubMed] [Google Scholar]
- 27.Hatters DM, Peters-Libeu CA, Weisgraber KH. Engineering conformational destabilization into mouse apolipoprotein E. A model for a unique property of human apolipoprotein E4. J Biol Chem. 2005;280:26477–26482. doi: 10.1074/jbc.M503910200. [DOI] [PubMed] [Google Scholar]
- 28.Hatters DM, Budamagunta MS, Voss JC, Weisgraber KH. Modulation of apolipoprotein E structure by domain interaction: differences in lipid-bound and lipid-free forms. J Biol Chem. 2005;280:34288–34295. doi: 10.1074/jbc.M506044200. [DOI] [PubMed] [Google Scholar]


