

Abstract
Objective:
To investigate whether age-related and experimental reductions in SWS and sleep continuity are associated with increased daytime sleep propensity.
Methods:
Assessment of daytime sleep propensity under baseline conditions and following experimental disruption of SWS. Healthy young (20-30 y, n = 44), middle-aged (40-55 y, n = 35) and older (66-83 y, n = 31) men and women, completed a 2-way parallel group study. After an 8-h baseline sleep episode, subjects were randomized to 2 nights with selective SWS disruption by acoustic stimuli, or without disruption, followed by 1 recovery night. Objective and subjective sleep propensity were assessed using the Multiple Sleep Latency Test (MSLT) and the Karolinska Sleepiness Scale (KSS).
Findings:
During baseline sleep, SWS decreased (P < 0.001) and the number of awakenings increased (P < 0.001) across the 3 age groups. During the baseline day, MSLT values increased across the three age groups (P < 0.0001) with mean values of 8.7min (SD: 4.5), 11.7 (5.1) and 14.2 (4.1) in the young, middle-aged, and older adults, respectively. KSS values were 3.7 (1.0), 3.2 (0.9), and 3.4 (0.6) (age-group: P = 0.031). Two nights of SWS disruption led to a reduction in MSLT and increase in KSS in all 3 age groups (SWS disruption vs. control: P < 0.05 in all cases).
Conclusions:
Healthy aging is associated with a reduction in daytime sleep propensity, sleep continuity, and SWS. In contrast, experimental disruption of SWS leads to an increase in daytime sleep propensity. The age-related decline in SWS and reduction in daytime sleep propensity may reflect a lessening in homeostatic sleep requirement. Healthy older adults without sleep disorders can expect to be less sleepy during the daytime than young adults.
Citation:
Dijk DJ; Groeger JA; Stanley N; Deacon S. Age-related reduction in daytime sleep propensity and nocturnal slow wave sleep. SLEEP 2010;33(2):211-223.
Keywords: Aging, insomnia, slow wave sleep, sleepiness, alertness
EPIDEMIOLOGICAL STUDIES HAVE DOCUMENTED AN INCREASED PREVALENCE OF SLEEP COMPLAINTS, INCLUDING INSOMNIA, IN OLDER ADULTS.1,2 The rate of prescriptions for hypnotics is high for this segment of the population although the effectiveness of current hypnotics remains unsatisfactory.3 Whether and how the age-dependent increase in insomnia is related to the age-related changes in sleep regulation in healthy individuals is currently not known.
Healthy aging is associated with profound changes in sleep but there is no consensus on the interpretation of these changes in the context of models of sleep regulation and the consequences of these changes in nocturnal sleep for daytime function have not been established.
Sleep complaints frequently mentioned in relation to aging are sleep interruptions, early morning awakening, and difficulty falling asleep.4 These changes in nocturnal sleep are thought to be related to the complaints of waking-not-refreshed, daytime napping and sleepiness.1,5 This linkage between nocturnal and diurnal complaints is supported by the widespread view of sleep as a recovery process in which the increase in sleep interruptions and the loss of deep sleep with age are viewed as indicators of less recuperative or insufficient sleep.
The question of whether these age-related changes in sleep and daytime sleepiness are secondary to poor health and sleep disorders or are also observed in healthy aging has received some attention.6 One common answer is that aging in healthy people is not necessarily associated with poor sleep and that sleep need is not reduced in old age,7 but experimental evidence in favor or against this view is rather limited.
Physiological studies of sleep have also documented marked changes in sleep structure in healthy older people. Key changes include a striking age-related reduction in slow wave sleep (SWS) and computer detected slow wave activity (SWA), as well as reductions in sleep continuity and sleep maintenance parameters.8,9 Reductions in REM sleep and total sleep time (TST) are also observed with aging, although these changes are less striking.10 These age-related changes in physiological sleep parameters are nearly continuous across the adult lifespan but the time course of changes differs between the various sleep parameters.8,10
Changes in sleep structure, sleep continuity, sleep maintenance, and early morning awakening can be interpreted within the framework of the homeostatic and circadian regulation of sleep.11–13 In this widely accepted conceptualization of sleep regulation, SWS/SWA is considered a principle marker of the homeostatic process, whereas sleep continuity, maintenance, and early morning awakening are determined by the interaction of the circadian and homeostatic processes. Several experimental approaches have attempted to identify the relative contribution of these 2 processes, and their interaction with the age-related changes in sleep.14,15 Sleep deprivation and sleep satiation experiments have probed sleep homeostasis in older adults. Circadian phase shifting through scheduled light exposure experiments have quantified the contribution of circadian phase. Forced desynchrony experiments investigated the interaction of the circadian and sleep process. Key findings that are consistent across these protocols are: (1) the homeostatic and circadian regulation of sleep operates in old age; and (2) age-related changes in SWS and sleep continuity/duration persist across all circadian phases.
One overarching interpretation of these findings is that the age-related reduction in SWS sleep reflects a reduction in homeostatic sleep drive/need. According to this interpretation, the reduced sleep continuity and maintenance, early morning awakening, and increased susceptibility to circadian phase misalignment and other internal and external stimuli are secondary to the reduction in homeostatic sleep drive and the depth of sleep. An alternative interpretation is that the changes in SWS and sleep continuity primarily reflect sleep that is less efficient in dissipating sleep pressure without an underlying reduction in homeostatic sleep drive or sleep requirement. When sleep is seen as a restorative process, these 2 interpretations lead to opposite predictions with respect to daytime consequences—such as sleepiness— of the age-related nocturnal sleep changes. The interpretation that aging is associated with a reduced homeostatic sleep drive predicts age-related reductions or no change in daytime sleep propensity, provided that sleep opportunity does not change with age. In contrast, when the age-related changes in sleep are seen as an indication of sleep being less efficient in dissipating sleep pressure or insufficient, a build up of homeostatic sleep pressure is predicted. This should lead to excessive daytime sleepiness in older people, if not pathological sleepiness seen in clinical examples of disrupted sleep such as in sleep apnea.16
Insufficient sleep resulting in a build-up of homeostatic sleep pressure without changing total sleep duration can be modelled by experimental disruption of SWS. In SWS deprivation experiments, in which subjects are prevented from entering deep sleep by administration of acoustic stimuli contingent upon the ongoing EEG, a homeostatically regulated rebound of SWS occurs.17–19 This rebound is observed within a sleep episode if the SWS disruption takes place at the beginning of the sleep episode. The rebound is observed during the subsequent sleep episode when the sleep disruption is continued to the end of the nocturnal sleep episode.20 This implies that the SWS deficit is carried over an intervening wake episode and that homeostatic sleep pressure is higher during wake episodes following SWS disruption. The daytime consequences of either age-related changes in sleep or experimental disturbances of SWS and sleep continuity, however, have not been studied extensively.
One early study, in which daytime sleep propensity was assessed using the multiple sleep latency test (MSLT), it was found that older people were sleepier,21,16 or at least as sleepy as young people.22 Subsequent studies have largely confirmed these findings although in some it was noticed that older people may be as sleepy or less sleepy than young people.6,23 Studies of the effects of aging on daytime functioning, including sleepiness, varied considerably in their control of sleep-wake history and the extent of the general health and sleep screening and nocturnal sleep structure and continuity were not always quantified. Therefore, firm conclusions on the relationship between daytime sleep propensity and aging can currently not be drawn.
The association between SWS and sleep continuity and daytime sleep propensity has not been firmly established in healthy individuals, and it is not known whether this relationship changes with age. Descriptive studies in patient populations have provided some evidence for a role of sleep continuity and SWS in the regulation of daytime sleep propensity.24 Small-scale experimental studies of SWS disturbances and associated changes in sleep continuity have been shown to affect daytime sleep propensity in healthy individuals,25–27 but whether these effects are of a similar magnitude in all age-groups is not currently known.
In order to better understand the nature of the age-related changes in sleep and daytime sleep propensity and to investigate the role of SWS sleep and sleep continuity in the regulation of daytime sleep propensity, we conducted a large-scale experiment in which sleep and daytime sleep propensity was quantified under baseline conditions as well as during and after experimental disruption of SWS. The experimental disruption of SWS allowed for the assessment of responsiveness of daytime sleep propensity to insufficient sleep. The experiment was conducted in carefully screened healthy young, middle-aged, and older individuals, all of whom were scheduled to an 8-h sleep opportunity for at least 5 nights prior to the 4-day laboratory experiment. The data demonstrate that, whereas experimental disturbances of SWS lead to increased daytime sleep propensity in all age groups, at baseline aging is associated with a reduction of daytime sleep propensity, despite reductions in nocturnal SWS and sleep continuity.
METHODS
The study was conducted at the Clinical Research Centre (CRC) of the University of Surrey. After an independent ethics committee had reviewed the protocol and given a favorable opinion, healthy young (20-30 y), middle-aged (40-55 y) and older (66-83 y) men and women, without sleep disorders or sleep complaints (see Visits 1 and 2 below), were recruited to the study. All subjects gave written informed consent prior to screening and study procedures. The study consisted of 3 visits: (1) a general medical screening visit, (2) a sleep laboratory screening and habituation session which consisted of 1 night/day for polysomnography (PSG)/daytime function and MSLT assessment, and (3) a 4-night and four and one half day visit during which the experimental protocol was conducted.
Visit 1: Subjects underwent a medical and psychiatric screening. All included subjects were healthy on the basis of a physical examination, medical history, vital signs, electrocardiogram, and routine (clinical chemistry and hematological) laboratory tests. Prohibited recent (within 2 weeks of screening) and concomitant medication included investigational compounds, melatonin, antidepressants, fluoxetine (within 4 weeks of screening), antipsychotics, benzodiazepines, anxiolytics, hypnotics, any CNS depressant, stimulants, diet pills, antihistamines, and OTC medications that could affect sleep. Subjects underwent a psychiatric examination using the Mini Mental State Examination (MMSE, elderly subjects only)28 and the Mini International Neuropsychiatric Interview (MINI).29 Subjects with a MMSE score ≤ 25 or significant psychiatric symptoms were excluded. Subjects who reported drinking > 3 alcoholic beverages or > 5 caffeine-containing beverages or smoking > 5 cigarettes per day were not included in the study. Subjects were excluded if they reported sleep complaints, as assessed by interview and the Pittsburgh Sleep Quality Index.30 Subjects were excluded if the composite score on the Pittsburgh Sleep Quality Index was > 5. Subjects who had conducted shift work, maintained an irregular sleep/wake schedule or travelled through > 2 time zones during the preceding 1 month were excluded. Additional inclusion criteria related to sleep included a reported bedtime between 22:00 and 00:00 on at least 5 of 7 nights per week and reported typical sleep duration between 6.5 and 8.5 h. Following Visit 1 subjects wore actigraphs (Cambridge Neurotechnology, Ltd, UK) and completed an electronic sleep diary (Invivodata Inc, USA) throughout the study. Subjects were required to have adequate vision and manual dexterity to use the electronic sleep diary. Actigraphy recordings were reviewed at Visit 2 and Visit 3.
During Visit 2 subjects underwent a polysomnographic screening with scheduled recordings between 23:00-07:00. Subjects with an apnea-hypopnea index of > 15/h or a periodic leg movements arousal index > 15/h were excluded. On the day following the PSG screening subjects conducted waking performance tests starting at 08:00, 10:00, 12:00, 14:00, and 16:00 and the MSLTs with individual sleep latency tests at 09:00, 11:00, 13:00, 15:00 and 17:00. Thus during Visit 2 subjects were familiarized with the laboratory environment, the PSG recordings, performance tests and the MSLT. Subjects were instructed to adhere to a sleep schedule of 23:00-07:00 between Visit 2 and Visit 3 for which the inter-visit period was a minimum of 5 and a maximum of 14 nights. Compliance with this schedule was determined by inspection of actigraphy recordings and sleep diaries on admission for Visit 3. Actigraphy analysis showed that that prior to visit 3 average sleep start-times were 23h:28min (SD: 32 min), 23:17 (29), and 23:08 (26); and average sleep-end times were 07:34 (33), 07:17 (29), and 07:08 (25) for young, middle-aged and older people, respectively. Actigraphically assessed total sleep time was 07h: 09 min (SD 23 min), 07:08 (24), and 07:16 (27) in young, middle-aged, and older adults, respectively.
Visit 3: This intervention period consisted of 1 baseline night and day, 2 nights and 2 days with or without selective SWS/SWA disruption and 1 recovery night and day. The study was run according to a parallel group design, in which subjects were randomly assigned to the SWS/SWA disruption or Control condition. Randomization was stratified by age group. Subjects were resident in the CRC for the duration of this intervention period. During this period the subjects were not allowed to drink caffeinated beverages, coffee or tea, or alcohol, did not engage in strenuous activity, and were under continuous supervision. All nocturnal sleep episodes were scheduled for 23:00-07:00, and no naps were allowed except those that occurred during the MSLT. On each day of Visit 3, waking performance tests and MSLTs were conducted as in Visit 2.
SWS/SWA disruption and control group.
SWS disruption was accomplished through acoustic stimulation.20 Technicians trained by the investigators, monitored the EEG during the sleep episodes. As soon as at least two delta waves (< 3.5 Hz; > 75μV) appeared in a 15-sec recording interval, a 1000 Hz tone, duration 1 sec, was delivered through a custom made system (Glensound Electronics Ltd, Maidstone, UK). The initial intensity was 40 dB and was increased in steps of 5 dB if no response (EEG desynchronization, α burst, K complex) was observed, to a maximum of 110 dB. The acoustic stimuli were delivered through a loudspeaker placed about 40 cm above the subject's head; each sound-attenuated bedroom was configured to ensure that each bed received the same level of sound. This method has been shown to lead to minimal changes in REM sleep and total sleep duration, in particular on the second night of SWS disruption.20 A control group slept in identical bedrooms under identical conditions, but no sounds were administered. This control group served to assess the changes in sleep and daytime sleep propensity associated with the sleep schedule and laboratory conditions in the 3 age groups during 4 consecutive nights and days. Please note that the primary objective of the acoustic stimulation was to disrupt SWS without major changes in REM sleep and TST, and to investigate whether responsiveness to this disruption with respect to daytime sleep propensity and recovery sleep was maintained in all 3 age groups. We did not aim to investigate whether the quantitative relationship between SWS disruption and daytime sleep propensity was affected by age. The answer to that question requires a dose-response study.
PSG recordings All PSG recordings were conducted on digital PSG acquisition systems (Compumedics Limited, Victoria, AU). Left and right electrooculogram (EOG), submental myogram (EMG), electrocardiogram (ECG), and electroencephalogram (EEG) from 8 positions (C3-A2, C4-A1, O1-A2, O2-A1, Fpz-A1, Fz-A1, Cz-A1, and Oz-A1) were digitized. PSG sleep recording were scored according to standardized criteria,31 by one scorer (author NS) who was blind to the group/intervention. PSG recordings were also converted to EDF and exported to Vitascore software (Temec, BV, Kerkrade, The Netherlands) for spectral analysis of the EEG after all EEG had been visually inspected and artifacts had been removed as described elsewhere.32 Here we only present data on SWA, i.e., EEG power density 0.75-4.5 Hz during NREM sleep from the C3-A2, or if the quality of this channel was insufficient, from the C4-A1 derivation. SWA values were obtained by adding the power values of the 0.25 Hz bins, which had been created using the top-top amplitude setting in Vitascore.
Multiple Sleep Latency Test (MSLT) The MSLT is the accepted standard procedure “to measure physiological sleep tendency in the absence of external alerting factors,”33 and has been shown to be responsive to variations in homeostatic sleep pressure.34 MSLTs were performed in accordance with the standard criteria for assessment. Subjects were asked to lie in a comfortable position on the bed of their individual bedroom. At lights out, subjects were asked try to fall asleep. Sleep onset was said to occur when, on observation of channel(s) C4-A1 and O2-A1 in real time, there were either 3 complete epochs of stage 1 sleep or any 1 epoch of unequivocal sleep. On observation of either of these the recording was terminated and the subject awoken. If neither of these events was observed, the recording was continued for a total duration of 20 min before the test was terminated. Sleep latency was defined as the interval between lights out and the first of the 3 epochs of stage 1 sleep or unequivocal sleep stage. In this study MSLT is used as a measure of sleep propensity.
Karolinska Sleepiness Scale (KSS). The Karolinska Sleepiness Scale is a validated 9-point Likert-type scale of subjective sleepiness.35 It was administered 5 times a day prior to the MSLT.
Subjective Assessment of Sleep Quality and Daytime Function
Subjective Sleep Quality and Refreshed Upon Awakening was assessed by a 100-point visual analogue scale (VAS). Subjective sleep latency and number of awakenings as well as estimates of the total duration of awakenings and total sleep time were assessed at approximately 20 min after lights on. A subjective assessment of daytime function was obtained at the end of the waking day (using a VAS). How relaxed, how tired, how energetic and ability to function were all assessed by VAS using the e-diary.
Statistical Analyses
The per-protocol set (PPS) consisted of all subjects, who, as assessed during a blinded data review, did not violate any of the inclusion and exclusion criteria and had completed the MSLT on Days D-1 and D2.
This PPS was used to analyze all the efficacy variables provided that the subjects included in such analysis had completed 4 or more of the relevant performance measurements on each of days of the study involved in the contrasts being reported on, for performance measurements involving 5 time points per day, and otherwise, had completed at least one measurement on each of these days.
Data and statistical analyses were conducted by researchers and statisticians at the Surrey Sleep Research Centre and Clinical Research Centre of the University of Surrey using SAS PROC MIXED (SAS versions 8 and 9). Some variables were log transformed prior to statistical analysis.
The statistical approaches were chosen to address 3 questions: (1) differences between age groups at baseline, (2) effects of SWS disruption, and (3) effects of SWS disruption separately in the 3 age groups and differences between age groups with respect to the response to SWS disruption. Daytime sleep propensity was considered the primary variable of interest and the other variables were considered secondary and exploratory. P values were not corrected for multiplicity.
Differences between age groups on baseline measures of sleep and sleep propensity were assessed using PROC MIXED and the LSMEANS Statement (Tables 2, 3). MSLT data as presented in Figure 1 were analyzed with PROC MIXED, with the MSLT values at each of time points 1 to 5, on D-1, as the model dependent variable, with age group as fixed effect, with time (taking values 1, 2, 3, 4, and 5) as a repeated measure with spatial power variance-covariance matrix, and with interactions for age by time. Provided a significant effect of age was observed, age comparisons were estimated using the LSMEANS statement.
Table 2.
Nocturnal objective and subjective baseline sleep parameters in young, middle-aged, and older subjects
| Young Mean (SD) | Middle-Aged Mean (SD) | Older Mean (SD) | Effect of Age | Middle-Aged vs. Young | Older vs. Young | Older vs. Middle-Aged | |
|---|---|---|---|---|---|---|---|
| Objective (PSG) sleep measures | |||||||
| Total sleep time (min) | 433.5 (23.7) | 409.9 (40.9) | 390.4 (38.5) | P < 0.0001 | P = 0.0042 | P < 0.0001 | P = 0.025 |
| Latency to persistent sleep (min) | 20.6 (16.0) | 16.6 (12.8) | 19.2 (24.8) | NS | NS | NS | NS |
| Awakenings (number) | 20.1 (6.4) | 22.9 (6.6) | 27.9 (11.8) | P < 0.001 | P = 0.152 | P < 0.001 | P = 0.020 |
| Wake after sleeponset (min) | 21.0 (15.9) | 49.9 (31.3) | 70.7 (36.7) | P < 0.0001 | P < 0.0001 | P < 0.0001 | P = 0.0041 |
| Stage 1 (min) | 28.1 (14.3) | 29.0 (14.1) | 26.7 (10.5) | NS | NS | NS | NS |
| Stage 2 (min) | 198.9 (28.7) | 211.8 (32.5) | 204.5 (32.0) | NS | (P = 0.079) | NS | NS |
| Stage 3 (min) | 43.5 (23.9) | 37.4 (11.4) | 45.6 (12.8) | NS | NS | NS | NS |
| Stage 4 (min) | 75.0 (21.7) | 47.9 (28.3) | 38.6 (26.0) | P < 0.0001 | P < 0.0001 | P < 0.0001 | NS |
| Slow wave sleep (min) | 118.4 (32.5) | 85.3 (30.3) | 84.2 (32.6) | P < 0.001 | P < 0.001 | P < 0.001 | NS |
| Slow wave activity (μV2) | 3280 (1412) | 1923 (836) | 1754 (746) | P < 0.001 | P < 0.001 | P < 0.001 | NS |
| REM sleep (min) | 87.9 (17.2) | 83.9 (26.0) | 75.0 (21.2) | P = 0.0377 | NS | P = 0.0113 | NS |
| Subjective sleep measures | |||||||
| Total sleep time (h) | 7.25 (0.89) | 7.29 (0.62) | 7.12 (1.06) | NS | NS | NS | NS |
| Sleep onset latency (min) | 30.3 (32.3) | 15.5 (14.8) | 40.2 (109.0) | NS | NS | NS | NS |
| Number of awakenings | 2.2 (1.6) | 2.9 (2.0) | 2.4 (2.0) | NS | NS | NS | NS |
| Total duration of awakenings (min) | 14.4 (25.6) | 28.1 (27.3) | 59.3 (114.5) | P = 0.0124 | NS | P = 0.0033 | P = 0.0499 |
| Quality of sleep (mm; more is worse) | 46.6 (20.1) | 46.4 (23.4) | 54.4 (19.9) | NS | NS | NS | NS |
| Refreshed upon awakening (mm; more is better) | 52.8 (17.6) | 61.3 (22.7) | 48.8 (20.8) | P = 0.0355 | (P = 0.0636) | NS | P = 0.0126 |
For objective measures: N = 41, 31, 31 for the young, middle-aged, and older subjects, respectively. For subjective measures: N = 44, 35, 31. min = minutes. Please note that Lights out was 23:00 and Lights on at 07:00 in all 3 age groups
Table 3.
Objective (MSLT) and subjective (KSS) daytime sleep propensity at baseline
| Young Mean (SD) | Middle-Aged Mean (SD) | Older Mean (SD) | Effect of Age | Middle-Aged vs. Young | Older vs. Young | Older vs. Middle-Aged | |
|---|---|---|---|---|---|---|---|
| MSLT (min) | 8.7 (4.5) | 11.7 (5.1) | 14.2 (4.1) | P < 0.0001 | P = 0.0078 | P < 0.0001 | (P = 0.0567) |
| KSS points (max = 9) | 3.7 (1.0) | 3.2 (0.9) | 3.4 (0.6) | P = 0.0310 | P = 0.0088 | NS | NS |
MSLT: N = 44, 35, 31 for the young, middle-aged, and older, respectively. KSS: N = 39, 35, 31. Statistics for MSLT on log transformed values.
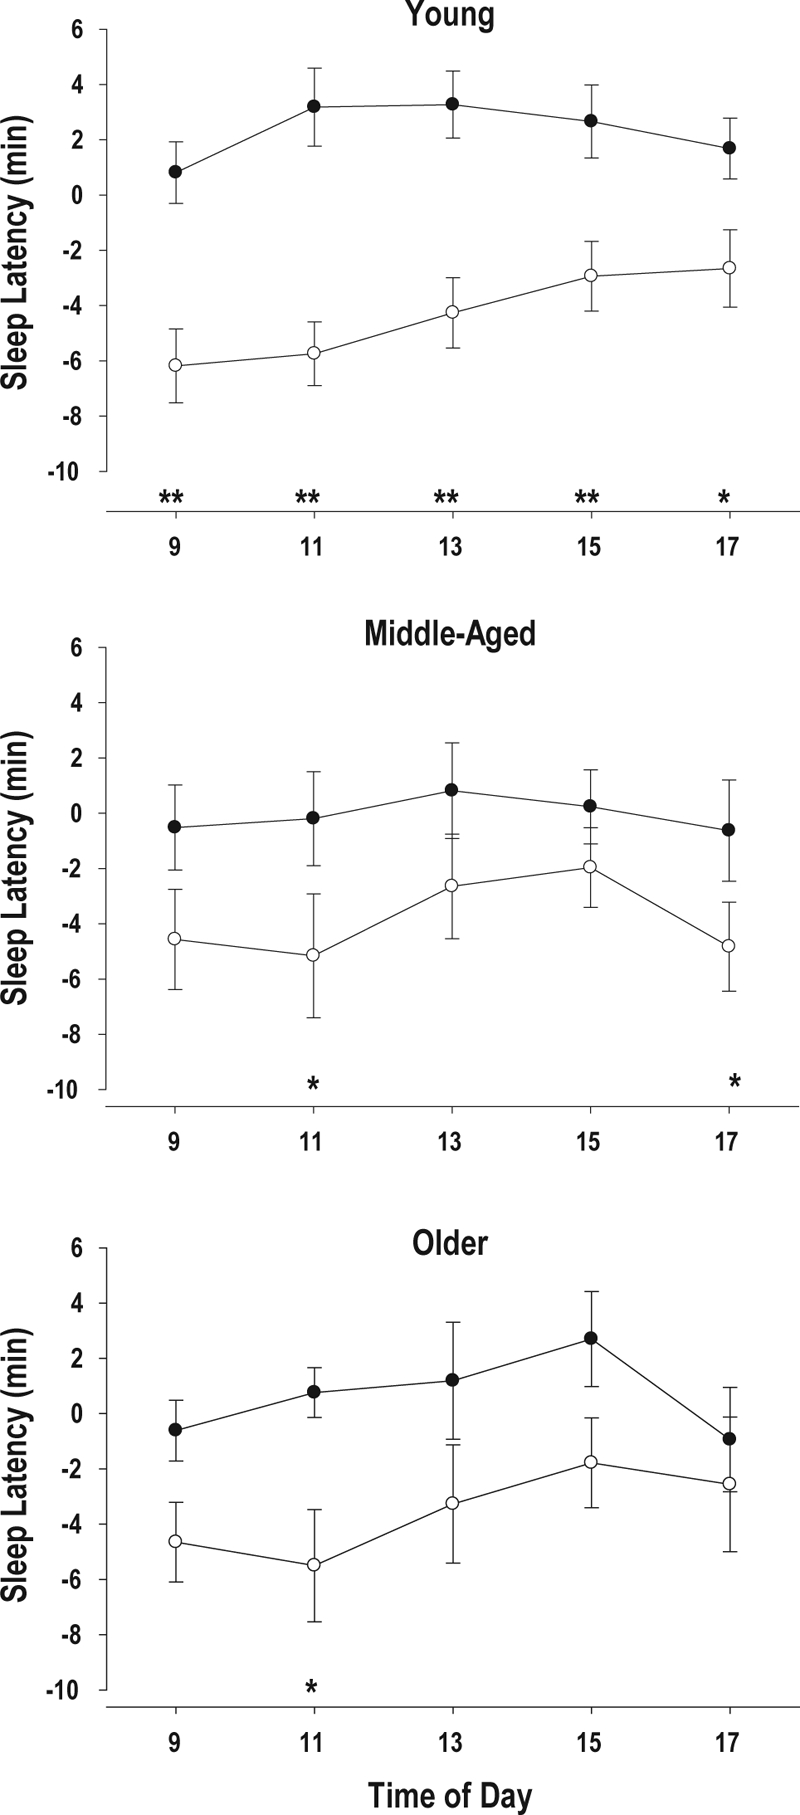
Figure 1.

MSLT (mean ± SE) at 9, 11, 13, 15, and 17 h, in young (•), middle-aged (○), and older subjects (▼). *P < 0.05; **P < 0.01; P < 0.001. Y vs. O = Young vs. Older; Y vs. M = Young vs. Middle-aged; M vs. O = Middle-aged vs. Older
The effects of SWS deprivation were assessed using data of each of the nights N-1, N1, N2, and N3 (Table 4), or the average of the 5 MSLTs on D-1, D1, D2, D3 (Figure 2), as the model dependent variable, with group (No-SWS disruption, SWS disruption) as a fixed effect, night (taking values −1, 1, 2, and 3) as a repeated measure with unstructured variance-covariance matrix, and with a group (No-SWS disruption, SWS disruption) by night interaction. Provided a significant group by night interaction was observed, estimates of the effect of treatment on the deviation from baseline values in the different nights were estimated using the LSMEANS statement.
Table 4.
Effect of SWS deprivation on objective and subjective sleep parameters
| Objective (PSG) sleep measures | Intervention group | Baseline | N1 | N2 | N3 |
|---|---|---|---|---|---|
| Total sleep time (min) | Control | 417.2 (32.2) 52 | −5.8 (34.4) 49 | 2.5 (31.2) 50 | −7.8 (35.5) 52 |
| Disruption | 409.6 (43.8) 51 | −18.9 (57.1) 50 | 2.3 (52.0) 50 | 23.7 (41.5) 50*** | |
| Latency to persistent sleep (min) | Control | 15.5 (11.5) | 4.9 (19.9) | 3.0 (16.9) | 13.4 (30.5) |
| Disruption | 22.5 (22.8) | 22.8 (49.4)* | 2.5 (34.6) | −6.1 (20.7)*** | |
| PSG awakenings (number) | Control | 24.0 (9.8) | −1.5 (8.8) | −1.5 (7.6) | −1.7 (9.4) |
| Disruption | 22.6 (8.0) | 9.7 (11.3)*** | 10.5 (9.7)*** | −3.9 (9.0) | |
| Wake after sleep onset (min) | Control | 43.2 (30.5) | 0.7 (29.7) | −5.8 (28.1) | −1.1 (27.6) |
| Disruption | 46.1 (39.3) | 8.8 (40.3) | −3.6 (33.2) | −17.9 (33.7)** | |
| Stage 1 (min) | Control | 26.9 (12.4) | −2.5 (9.9) | −0.9 (10.3) | −1.3 (11.7) |
| Disruption | 29.1 (13.8) | 9.1 (16.2)*** | 3.6 (14.6)* | −7.9 (15.1)* | |
| Stage 2 (min) | Control | 206.4 (31.0) | −8.6 (29.5) | −6.2 (25.3) | −12.8 (29.6) |
| Disruption | 202.5 (31.3) | 26.9 (43.4)*** | 25.5 (36.7)*** | −7.9 (34.6) | |
| Stage 3 (min) | Control | 42.0 (14.6) | −1.3 (14.8) | −2.5 (14.6) | −5.2 (14.4) |
| Disruption | 42.6 (21.0) | −5.3 (22.2) | 8.2 (28.7)* | −1.4 (20.4) | |
| Stage 4 (min) | Control | 58.6 (31.6) | 1.5 (14.9) | 0.7 (16.2) | 0.8 (15.2) |
| Disruption | 53.0 (27.4) | −45.4 (27.9)*** | −41.9 (21.5)*** | 22.4 (23.1)*** | |
| Slow wave sleep (min) | Control | 100.6 (34.9) | 0.2 (20.0) | −1.85 (21.8) | −4.4 (21.1) |
| Disruption | 95.6 (36.6) | −50.7 (32.1)*** | −33.7 (28.8)*** | 20.9 (27.1)*** | |
| SWA (Baseline: μV2, N1-3: % from baseline) | Control | 2456 (1305) 52 | −0.1 (15.8) 47 | 1.2 (17.7) 49 | 0.9 (17.5) 52 |
| Disruption | 2368 (1280) 51 | -20.3 (21.7) 50*** | −10.2 (25.3) 48** | 24.2 (28.5) 50 *** | |
| REM sleep (min) | Control | 83.3 (21.1) | 5.0 (23.5) | 11.4 (23.2) | 10.6 (22.9) |
| Disruption | 82.3 (22.7) | −4.3 (25.9) | 6.9 (31.3) | 18.6 (31.8) | |
| Subjective sleep measures | |||||
| Total sleep time (h) | Control | 7.4 (0.6) 56 | −0.0 (0.7) 54 | 0.1 (0.7) 56 | −0.1 (0.8) 56 |
| Disruption | 7.0 (1.1) 54 | −0.6 (1.5) 53* | −0.4 (1.5) 54 P = 0.054 | 0.6 (1.1) 54*** | |
| Latency to sleep onset (min) | Control | 29.5 (80.2) | −14.0 (82.2) | −15.5 (79.5) | −5.4 (84.2) |
| Disruption | 27.2 (35.1) | 0.6 (38.7) | −9.7 (44.4) | −15.3 (36.4) | |
| Number of awakenings | Control | 2.3 (1.8) | 0.6 (2.2) | 0.0 (2.4) | −0.4 (2.1) |
| Disruption | 2.6 (1.9) | 7.3 (10.9)*** | 5.8 (8.7)*** | −1.4 (1.7)** | |
| Subjective duration of awakenings (min) | Control | 35.9 (87.7) | 8.8 (109.5) | −10.3 (112.2) | −13.6 (94.8) |
| Disruption | 26.7 (33.3) | 44.8 (89.5) | 45.7 (181.7) P = 0.05 | 2.1 (98.2) | |
| Quality of sleep (mm; more is bad) | Control | 43.9 (20.8) | −2.5 (24.1) | −2.7 (22.9) | −1.2 (23.0) |
| Disruption | 53.8 (20.7) | 13.1 (28.7)** | 6.4 (30.8) | −27.5 (32.7)*** | |
| Refreshed upon awakening (mm; more is better) | Control | 57.7 (19.9) | 1.4 (23.7) | 2.9 (23.3) | 0.8 (23.4) |
| Disruption | 51.0 (21.0) | −13.1 (27.7)** | −3.6 (28.0) | 14.6 (28.1)** | |
N1-N3 data are expressed as deviation from baseline and the contrast between SWS Disruption and SWS Control was computed for these difference scores.
P < 0.05;
P < 0.01;
P < 0.001. Mean (SD) N. Please note that number of subjects contributing to the mean are indicated only once for the visually scored PSG measures (see TST), SWA and subjective measures (TST).
Figure 2.

MSLT (mean ± SE) in the Control (•) and SWS Disruption Group (○) on the Baseline (B) day, and the after one (D1) and two (D2) nights of SWS Disruption/Control and a Recovery (R) sleep episode. ***P < 0.001 Control vs. SWS Disruption.
To investigate the effects of SWS disruption in the 3 age groups (Tables 5, 6: Figures 3, 4), data were expressed as deviation from baseline, and the contrast between SWS disruption and the control group was analyzed separately by age group. We also investigated whether the response to SWS disruption differed between age groups. For this, we computed the 2-way interaction (Age*Group) and the 3-way interaction (Age*Group*Day) on the change from baseline data.
Table 5.
Effect of SWS disruption on objective and subjective sleep parameters during the 2 SWS disruption nights (N1, N2) and the recovery sleep episode (N3).
| Objective (PSG)sleep measures | Age group | Intervention group | N1 | N2 | N3 |
|---|---|---|---|---|---|
| Total sleep time (min) | Young | Control | 3.8 (21.0) 21 | 4.0 (21.7) 19 | 0.7 (26.0) 21 |
| Young | Disruption | −18.1 (38.7) 20* | 3.7 (31.5) 20 | 21.3 (28.9) 19* | |
| Middle-Aged | Control | −8.5 (51.5) 13 | 5.2 (47.9) 15 | 1.8 (33.3) 15 | |
| Middle-Aged | Disruption | −13.5 (65.5) 15 | 3.5 (61.0) 16 | 19.6 (38.8) 16 | |
| Older | Control | −16.9 (29.8) 15 | −1.9 (20.7) 16 | −27.9 (41.5) 16 | |
| Older | Disruption | −25.3 (70.7) 15 | −1.1 (66.4) 14 | 31.1 (56.9) 15*** | |
| PSG awakenings (number) | Young | Control | −0.5 (6.1 ) | 0.4 (6.7) | −0.1 (8.1) |
| Young | Disruption | 11.5 (9.2)*** | 10.7 (10.6)*** | −6.4 (6.6)* | |
| Middle-Aged | Control | −1.4 (7.7) | −1.8 (7.0) | −1.2 (6.0) | |
| Middle-Aged | Disruption | 9.0 (11.3)** | 10.3 (11.2)** | −3.3 (9.8) | |
| Older | Control | −3.0 (12.6) | −3.3 (9.1) | −4.2 (12.9) | |
| Older | Disruption | 7.9 (14.2)* | 10.6 (6.7)*** | −1.3 (10.3) | |
| SWS (min) | Young | Control | 2.5 (19.2) | −0.7 (23.6) | −6.1 (20.1) |
| Young | Disruption | −60.8 (32.9)*** | −33.9 (32.1)*** | 27.7 (25.7)*** | |
| Middle-Aged | Control | −1.6 (20.6) | −3.1 (21.9) | 6.8 (18.2) | |
| Middle-Aged | Disruption | −50.9 (22.2)*** | −33.2 (32.4)* | 20.7 (32.8)† | |
| Older | Control | −1.5 (21.7) | −2.0 (20.7) | −12.5 (21.6) | |
| Older | Disruption | −36.8 (35.9)** | −34.2 (20.3)*** | 12.6 (21.0)** | |
| SWA (% from baseline) | Young | Control | 4.8 (14.4) 21 | 5.5 (19.6) 19 | 2.8 (17.4) 21 |
| Young | Disruption | −28.2 (12.8) 20*** | −15.5 (20.4) 19** | 29.2 (30.9) 19** | |
| Middle-Aged | Control | −5.2 (16.6) 11 | −2.6 (15.8) 14 | 2.2 (19.2) 15 | |
| Middle-Aged | Disruption | −18.7 (31.5) 15†† | −6.9 (31.4) 15 | 23.3 (32.1) 16* | |
| Older | Control | −3.2 (16.2) 15 | −0.7 (16.8) 16 | −2.7 (16.4) 16 | |
| Older | Disruption | −11.3 (16.1) 15 | −6.3 (24.5) 14 | 18.9 (21.3) 15** | |
| Subjective sleep measures | |||||
| Total sleep time (h) | Young | Control | −0.0 (0.5) 22 | 0.1 (0.6) 23 | −0.0 (0.6) 23 |
| Young | Disruption | −0.6 (2.0) 20 | 0.1 (1.5) 21 | 0.8 (1.1) 21** | |
| Middle-Aged | Control | 0.3 (0.5) 17 | 0.3 (0.7) 17 | 0.1 (0.6) 17 | |
| Middle-Aged | Disruption | −0.7 (1.0) 18*** | −0.4 (1.1) 18* | 0.2 (0.5) 18 | |
| Older | Control | −0.3 (0.9) 15 | −0.1 (0.8) 16 | −0.5 (1.0) 16 | |
| Older | Disruption | −0.3 (1.2) 15 | −1.0 (1.8) 15 | 0.8 (1.5) 15* | |
| Number of awakenings | Young | Control | 1.1 (2.5) | 1.1 (2.9) | −0.5 (1.8) |
| Young | Disruption | 10.7 (13.8)** | 5.9 (8.5)* | −1.5 (1.7) | |
| Middle-Aged | Control | −0.3 (1.4) | −0.8 (1.8) | −0.8 (1.8) | |
| Middle-Aged | Disruption | 7.8 (10.1)** | 6.6 (9.6)** | −1.2 (1.3) | |
| Older | Control | 0.7 (2.4) | −0.8 (1.3) | 0.1 (2.7) | |
| Older | Disruption | 2.3 (4.2) | 4.8 (8.3)* | −1.5 (2.0) | |
All N1-N3 data are expressed as change from baseline and the contrast between SWS Disruption and SWS Control was computed for these difference scores. Mean, (SD) N. Number of observations is indicated once for PSG measures, SWA, and once for subjective measures.:
P < 0.05;
P < 0.01;
P < 0.001;
P = 0.07;
P = 0.09. Contrast SWS disruption vs. SWS Control.
Table 6.
Change in objective (MSLT) and subjective (KSS) sleep propensity during the day after the first (D1) and second (D2) night of SWS disruption, as well as the recovery sleep episode (D3).
| Age group | Intervention group | D1 | D2 | D3 | |
|---|---|---|---|---|---|
| MSLT (min) | PPS | Control | 0.1 (3.2) 56 | 1.1 (3.9) 56 | 1.8 (4.3) 56 |
| PPS | Disruption | −2.6 (4.0) 54*** | −3.9 (5.1) 54*** | 0.2 (4.5) 54 | |
| Young | Control | 1.3 (3.2) 23 | 2.3 (3.8) 23 | 2.4 (4.6) 23 | |
| Young | Disruption | −2.4 (3.7) 21*** | −4.3 (4.3) 21*** | −0.5 (4.7) 21 | |
| Middle-Aged | Control | −0.1 (2.8) 17 | −0.1 (4.1) 17 | 2.3 (4.7) 17 | |
| Middle-Aged | Disruption | −1.8 (4.2) 18 | −3.8 (6.1) 18* | 1.3 (4.4) 18 | |
| Older | Control | −1.3 (3.2) 16 | 0.6 (0.9) 16 | 0.5 (3.3) 16 | |
| Older | Disruption | −3.7 (4.3) 15 | −3.5 (5.1) 15* | −0.3 (4.4) 15 | |
| KSS (points) | PPS | Control | −0.0 (0.7) 53 | 0.2 (0.6) 54 | 0.0 (0.7) 54 |
| PPS | Disruption | 0.4 (0.9) 51** | 0.8 (1.0) 51*** | 0.1 (0.9) 52 | |
| Young | Control | −0.1 (0.7) 20 | 0.1 (0.7) 21 | −0.2 (0.7) 20 | |
| Young | Disruption | 0.5 (1.3) 18 | 1.0 (1.3) 18* | −0.1 (0.8) 19 | |
| Middle-Aged | Control | 0.0 (0.8) 17 | 0.3 (0.8) 17 | 0.2 (0.9) 17 | |
| Middle-Aged | Disruption | 0.4 (0.5) 18 | 0.8 (0.7) 18* | 0.3 (0.8) 18 | |
| Older | Control | 0.1 (0.5) 16 | 0.1 (0.4) 16 | 0.2 (0.4) 16 | |
| Older | Disruption | 0.4 (0.7) 15 | 0.7 (0.9) 15* | 0.1 (1.0) 15 | |
All D1-D3 data are expressed as change from baseline and the contrast between SWS Disruption and SWS Control was computed for these difference scores.
Mean (SD) N.
P < 0.05;
P < 0.01;
P < 0.001 Contrast SWS disruption vs. SWS Control
Figure 3.

Change from baseline for the MSLT (mean ± SE) at 5 time points during D1 and D2 in the Control (•) and SWS disruption (○) group. D1, D2 the days after one and two nights of SWS disruption/Control respectively
*P < 0.05; **P < 0.01; *** P < 0.001 Control vs. SWS Disruption.
Figure 4.
Change from Baseline for MSLT (Mean ± SE) at 5 time points during D2 in the Control (•) and SWS disruption (○) group in the young, middle-aged and older subjects. D2 is the days after two nights of SWS disruption/Control
*P < 0.05; **P < 0.01; Control vs. SWS Disruption.
The statistics for Figure 2 were based on SAS PROC MIXED with MSLT values at each of the nights N-1, N1, N2, and N3 (expressed as an average over the 5 within-day time points), as the model dependent variable, with treatment group (group 1: those subjects in the analysis population who underwent no SWS deprivation; and group 2: the remaining subjects in the analysis population) as fixed effect, with day (taking values −1, 1, 2, and 3) as a repeated measure with unstructured variance-covariance matrix, and with a group by day interaction.
RESULTS
Subject Disposition
A total of 257 subjects were screened, and 117 subjects were randomized (all subjects treated set). The main reason for screening failure was illness/medical history. During a blinded data review, 7 subjects were removed from the analyses because of incomplete data (5), protocol noncompliance (1), and EEG abnormality before intervention took place (1). One hundred and ten subjects therefore constituted the PPS; 44 were young, 35 middle-aged, and 31 older (Table 1). There were approximately equal numbers of men and women in the young and middle-aged groups but more women than men in the older group.
Table 1.
Subject disposition in the 3 age groups in the per protocol set
| N | Men | Women | Mean Age (SD) | Minimum | Maximum | |
|---|---|---|---|---|---|---|
| Young | 44 | 21 | 23 | 24.9 (2.9) | 20 | 30 |
| Middle-Aged | 35 | 15 | 20 | 47.7 (4.8) | 40 | 55 |
| Older | 31 | 6 | 25 | 70.8 (4.6) | 66 | 83 |
Baseline Nocturnal Sleep: Objective and Subjective Measures
Objective Measures: Total sleep time per 8 h time in bed decreased significantly and progressively across the age groups, such that older adults slept approximately 20 min less than middle-aged, who slept 23 min less than young adults (Table 2). This reduction in total sleep time was primarily related to an increase in the number of awakenings and the duration of wakefulness after sleep onset, rather than an increase in latency to sleep onset. This led to sleep efficiencies of 92.1% (4.0%), 86.6% (7.9%), and 82.0% (8.1%) in the young, middle-aged, and older age groups (effect of age: P < 0.0001; young vs. middle-aged: P = 0.0006; older vs. middle-aged: P = 0.0082). Within sleep, an age-related reduction in stage 4, SWS, and SWA was observed, which was primarily attributable to the middle-aged group. Stage 4 values expressed as a percentage of TST were 17.3% (4.9%), 11.6% (6.9%), and 9.8% (6.5%) for the young, middle-aged, and older age group, respectively, and differed significantly across age groups (P < 0.0001). Stage 4% was significantly higher in the young compared to both the middle-aged and older age group (P < 0.0001), but the difference between the middle-aged and older age groups was not statistically significant. When SWS was expressed as a percentage of TST, the values were 27.3%, (7.3%) 20.9% (7.6%), and 21.5% (8.0%) for the young, middle-aged, and older age group, respectively, and differed significantly across age groups (P = 0.0004). SWS% was significantly higher in the young compared to both the middle-aged (P = 0.0004) and older age group (P = 0.0015), but the difference between the middle-aged and older age groups was not statistically significant.
There were more women in the oldest group, and women have more SWS and SWA than men. To investigate whether this could explain the absence of a decline from the middle-age to older group we computed the contrasts separately for the men and women. Stage 4 in the older women was significantly lower than in middle-aged group, but the difference was not significantly different for either SWS or SWA. The decline in SWS was mirrored by an increase in stage 2. Although this effect was not significant for the duration of stage 2, it was significant (P < 0.001) when stage 2 was expressed as percentage of TST. Stage 2 expressed as percentage of TST was 45.80% (5.76%), 51.74% (7.09%), and 52.46% (7.93%) in the young, middle-aged, and older age groups, respectively. Stage 1 did not differ significantly across the age groups. REM sleep duration was shorter in the older age group. REM sleep values expressed as a percentage of TST were 20.3% (3.7%), 20.2% (5.3%), and 19.0% (4.7%) in the young, middle-aged, and older age groups, respectively, and did not differ significantly between the age groups.
Subjective Measures: A significant and progressive increase was noted in the reported total duration of night awakenings, but no significant differences in the reported number of awakenings, total sleep time, sleep latency or quality of sleep were observed across the 3 age groups. Middle-aged people felt more refreshed waking up than older people, but the contrasts between older and young and middle-aged and young were not significant (Table 2).
Baseline Daytime Sleep Propensity: Objective and Subjective Measures
Objective Measures: The average of the 5 daytime sleep latency tests showed a marked, significant, and progressive increase across the 3 age groups. The MSLT values of older and middle-aged subjects were significantly longer than the value in young people, and the daily mean value in older people tended to be longer than in middle-aged subjects (Table 3). The time course of sleep propensity displayed the typical pattern for adults: longest sleep latencies in the morning, shortest sleep latencies at 15:00, followed by an increase at 17:00 in all 3 age groups (Figure 1). The age-related reduction in sleep propensity was observed at all 5 time points, and the interaction between age and time of day was not significant. A significant effect of gender was not observed.
Subjective Measures: The average of the 5 KSS measurements varied significantly with age (Table 3). The young people were significantly sleepier than the middle-aged people, who were the least sleepy of the 3 groups. The subjective sleepiness of the older people fell in between the other 2 age groups and was not significantly different from either.
SWS Disruption: Effect on Objective and Subjective Sleep Measures
Objective Measures: As anticipated, SWS and SWA were significantly reduced during the 2 SWS disruption nights, and this reduction was followed by a significant rebound during the recovery sleep episode (Table 4). When all age groups were considered together, SWS disruption did not lead to a significant reduction in TST on either the first or second night of disruption, but a significant increase was observed on the recovery night. Latency to persistent sleep was prolonged on the first night of SWS disruption and was reduced during the recovery sleep episode. SWS disruption was associated with a significant increase in stage 1 and 2 during the 2 nights of SWS disruption followed by a reduction during the recovery sleep episode, although this reduction was only significant for stage 1. The number of PSG awakenings was increased significantly on both SWS disruption nights but wakefulness after sleep onset was not affected during these 2 nights. No effects of SWS disruption on REM sleep were observed. Analyses by age group did not suggest major differences between the age groups in the response to SWS disruption (Table 5). This was substantiated by computing the interaction between Age and Treatment as well as the interaction between Age, Treatment, and Day for the data expressed as deviation from baseline. The 2-way interaction was not significant for any of the variables. The 3-way interactions were not statistically significant for any of the objective PSG variables in Table 5, with the exception for SWA% (P = 0.036) and SWS (P = 0.030), but the Age*Treatment interaction was not significant for these variables. For these variables we next analyzed the contrasts between the age groups with respect to the difference between the Control and SWS disruption group separately for D1, D2, and D3. For SWS, the difference between control and SWS disruption was significantly greater in young than in older subjects on D1 only (P = 0.029), and for SWA the difference between control and disruption was significantly greater in the young age group compared to both the older (P = 0.007) and the middle aged-group (P = 0.023), but only on D1. Importantly, a reduction of SWS during the deprivation nights and a rebound during the recovery nights was observed in all 3 age groups.
Subjective Measures: SWS disruption was associated with a reduction in reported sleep duration on both nights, although this failed to reach statistical significance for the second night of SWS disruption (P = 0.053). Subjective latency to sleep onset was not affected, but the reported number of awakenings was increased after both nights of SWS disruption and was reduced during the recovery sleep episode. The reported total duration of these awakenings was not significantly affected by SWS deprivation, although there was a tendency for an increase during night 2 (P = 0.054). SWS disruption was also associated with a significant reduction in reported quality of sleep and feeling refreshed upon awakening, but the contrast with the control group was significant only after the first night of SWS disruption. In general, the subjective measures that were affected negatively by SWS disruption were no longer different from baseline after the recovery sleep episode. Analyses by age group did not suggest major differences between age groups in the subjective response to SWS disruption. In fact the interaction between Age and Treatment was not statistically significant for the subjective measures. We only observed a statistically significant interaction between Age, Treatment, and Day for Subjective Sleep Time (P = 0.036) and Subjective Number of Awakenings (P = 0.037).
We next computed the contrast between the age groups with respect to the difference between control and SWS disruption, separately for all days, for those variables for which the interaction was significant. For subjective TST, the only significant contrast was observed between the older and middle-aged groups on D3, such that the older group showed a larger increase in subjective total sleep time than the middle-aged group (P = 0.02). For the subjective number of awakenings, the only significant difference in the response was observed between the older and young group on D1, such that the total number of awakenings was greater in the young group (P = 0.03).
SWS Disruption: Effect on Objective and Subjective Daytime Sleep Propensity
Objective Measures: SWS disruption led to an increase in objective daytime sleep propensity (Figure 2). After one night of SWS disruption, the average MSLT value was already significantly lower, and a further significant reduction was observed after the second night of SWS disruption. After one night of recovery sleep, the difference between the SWS disruption and SWS control group was no longer significant. The effect of SWS disruption was observed at all 5 times of day. Whereas after one night of SWS disruption daytime sleep latencies were significantly shorter at 11:00 and 17:00, on day 2, i.e. after 2 nights of SWS disruption, daytime sleep latency was significantly shorter at 9, 11, 13, 15, and 17 h (Figure 3). The increase in daytime sleep propensity was observed in all age groups. Whereas after 1 night of SWS disruption, the reduction in MSLT was significant only in the young subjects, after 2 nights of SWS disruption MSLT values were significantly lower in the SWS disruption group compared to the control group, in all 3 age groups and neither the interaction between Age and Treatment nor the interaction between Age, Treatment, and Day was significant. (Table 6, Figure 4).
Subjective Measures: The average of the 5 KSS measurements was significantly affected by SWS disruption (Table 6). SWS disruption led to a significant increase in subjective sleepiness after both 1 and 2 nights of SWS disruption. The increase in subjective sleepiness was observed and of similar magnitude in each of the 3 age groups and neither the Age*Treatment, nor the Age*Treatment*Day interaction was significant.
To investigate to what extent the effects of SWS disruption on objective and subjective sleep propensity may have been mediated by its effects on objective and subjective sleep continuity, we conducted a covariance analysis. The number of PSG awakenings as a covariate was not significant in the analysis of the effect of 2 nights of SWS deprivation on either objective or subjective sleep propensity. The number of reported awakenings as a covariate was not significant for the MSLT but was significant (P = 0.0018) for the KSS, but the effect of SWS disruption nevertheless remained reliable.
DISCUSSION
The data show that (1) both subjective and objective daytime sleep propensity are reduced in healthy older adults compared to young adults; and (2) experimental disruption of SWS leads to an increase in daytime sleep propensity and a rebound of SWS in young, middle-aged, and older adults. Taking these two findings together implies that the age-related changes in sleep structure and maintenance do not lead to increases in sleep debt. Instead, these age-related changes may reflect reductions in the sleep (duration and depth) required to maintain alertness.
Aging and Daytime Sleep Propensity in Young, Middle-Aged, and Older Adults
The observed age-related reduction in daytime sleep propensity cannot be attributed to an increase in time in bed or total sleep time in the middle-aged and older adults during the nights prior to the laboratory phase because all subjects were scheduled to 8 h time in bed, compliance to which was confirmed. Furthermore, actigraphically assessed total sleep times during the pre-laboratory phase were similar in the three age groups. The observed age-related reduction in daytime sleep propensity is unlikely to be attributable to age-related reductions in adaptation to the laboratory environment because all subjects had undergone a screening MSLT session prior to the baseline assessment. In addition, no change in MSLT that could be indicative of adaptation was observed in those elderly who were randomized to the control group. In this control group MSLT was assessed after undisturbed sleep on 4 consecutive days.
The age-related reduction in daytime sleep propensity is also unlikely to be related to an age-related reduction in the ability to fall asleep because sleep latency for nocturnal sleep was similar in the 3 age groups.
Finally, the lack of increased subjective and objective sleep propensity in the presence of age-related deterioration of objective sleep quality cannot be attributed to unresponsiveness to variations in homeostatic sleep pressure because all age groups responded to SWS disruption with a rebound in SWS as well as with a similar increase in objective and subjective daytime sleep propensity. We therefore conclude that healthy aging is associated with a reduction in daytime sleep propensity. This conclusion is in accordance with some previous MSLT studies,34 ultrashort sleep-wake studies in which daytime sleep propensity was assessed on the basis of sleep initiation or total sleep time,13 or in time-free environments.36 The data are also in accordance with a recent study in which daytime sleep propensity of young and older people was assessed after they had slept at their habitual times and duration.37,38 We add that our study does not address sleep propensity during the evening hours and it may still be that older adults are sleepier than young adults at this time of day, and this could be due to a reduced strength of the wake maintenance signal.39
The age-related reduction in daytime sleep propensity was observed despite an age-related reduction of objective sleep duration, increase in wake after sleep onset, reduction in sleep intensity and sleep continuity in these subjects. The changes in sleep across the three age groups observed in our study are in line with those previously reported for healthy subjects although the age-related reduction in visually scored SWS in our sample is smaller and this may be related to the overrepresentation of women in our sample of very carefully screened subjects.10 The somewhat high values for wake after sleep onset may be related to the imposed 8-h time in bed for several nights prior to the laboratory assessments.
SWS, SWS Disruption, and Daytime Sleep Propensity
Daytime sleep propensity and sleepiness have been shown to be exquisitely sensitive to increases in homeostatic sleep pressure.34,37 Increases in homeostatic sleep pressure can be accomplished by total, partial, and selective SWS deprivation, as well as sleep fragmentation. All of these manipulations have been shown to reduce MSLT values and increase subjective sleepiness, i.e., increase daytime sleep propensity, and to induce a rebound of SWS during undisturbed recovery sleep. The model of experimental SWS disruption used in this study led to an increased daytime sleep propensity and rebound of SWS and SWA, which is in accordance with previous studies.19,20,27 The model was selective to the extent that the reduction in SWS and SWA was not associated with a reduction in either REM sleep or total sleep time, although measures of sleep continuity indicated greater sleep fragmentation in the SWS disruption group. It may be difficult to separate the effects of SWS deprivation from the effects of sleep fragmentation because of the intricate association between these two aspects of sleep. This association is underscored by the significant negative association between the duration of SWS and the number of awakenings during the baseline nights of the present study (r = −0.36; P < 0.0001). This association remained significant even when the effects of age were controlled for in the regression analyses. Similarly associations were reported in other studies.24 Furthermore, statistically controlling for the number of awakenings did not abolish the effect of SWS disruption on daytime sleep propensity. Taken together, this suggests that the effect of SWS disruption is not only related to sleep fragmentation, but that nocturnal SWS is an important determinant of at least one aspect of waking function, i.e., daytime sleep propensity. Further analyses, using approaches such as multiple regression or structural equation modelling could be used to identify in more detail the contribution of the various sleep parameters to daytime sleep propensity.
Importantly, application of the model to all three age groups showed that experimental disruption of SWS was more or less equally effective in inducing daytime sleepiness in all three age groups. From this we conclude that the age-related changes in nocturnal sleep at baseline sleep should not be interpreted as insufficient sleep, at least not in the sense that it is associated with a cumulative increase in homeostatic sleep pressure that leads to daytime sleepiness. In fact, based on the baseline daytime sleep propensity data one may argue that an 8-h sleep episode rich in SWS is insufficient for young adults but that an 8-h sleep episode with less SWS is sufficient for older adults.
The data, however, also show that SWS deficiency, as induced by, for example, experimental SWS disruption, leads to an increase in daytime sleep propensity. In accordance with the proposed contribution of SWS to daytime sleep propensity, pharmacological enhancement of SWS has been reported to reduce the increase in sleep propensity associated with sleep restriction.40
Relation to Homeostatic Models of Sleep Regulation and Sleep Function
Homeostatic models of sleep regulation state that daytime sleep propensity is determined by initial sleep debt at the onset of wakefulness and the increase of sleep pressure with time awake, in interaction with the circadian arousal signal.41 Initial sleep pressure at wake onset is determined by the dissipation of sleep pressure during sleep, i.e., the duration and intensity of the nocturnal sleep episode. The dynamics of this homeostatic process can be monitored by measuring SWS/SWA and sleep propensity. In the present and most published studies on healthy aging both daytime sleep propensity and SWS are reduced, in particular when the duration of the night time sleep opportunity is similar, as was the case in the present study in which sleep duration prior to the laboratory study was carefully monitored. Taken together, the most parsimonious explanation for the present data and most published data is that with aging the wake dependent increase in sleep pressure, declines. This interpretation is in accordance with a rapidly accumulating body of evidence showing that older adults are less affected and less impaired by extension of wakefulness than younger people.42 In the present experiment, in which many statistical comparisons were made, we did not find strong evidence that the response to SWS disruption differed between age groups. It is of interest, though, that in the present study compared to young individuals, daytime sleep propensity of older people certainly did not seem to be more affected by SWS disruption. If anything, older people were less affected, and the increase in SWS during the recovery sleep episode was also somewhat smaller, although not significantly so. It should be noted that SWS disruption is a very different manipulation than wake extension, and to fully characterize the association between SWS loss and daytime sleep propensity will require dose-response studies in people of all ages.
Our interpretation of the data is that middle-aged and older adults build up less of a sleep debt during the waking day than young adults when all age groups are given an 8-h sleep opportunity. This interpretation is in accordance with a recent assessment of the maximal capacity for sleep in young and older adults when given 16 h of sleep opportunity per 24 h for 3-7 days.38 In that study it was reported that at baseline older adults were less sleepy, as assessed by the MSLT and that asymptotic sleep duration, i.e., polysomnographically assessed total sleep time obtained after several days of extended sleep opportunity, was 7.5 h in the older adults and 8.9 h in young adults. Although it could be argued that age-related changes in SWS reflect cortical changes not related to sleep regulatory processes, within the context of the present data, the reduction in SWS observed in older adults to some extent reflects a reduced “sleep need.” Whether the age-related reduction in SWS and sleep need reflects age-related changes in reproductive hormones, or changes in the brain with respect to plasticity, learning and memory or other functions supposedly supported by sleep and whether enhancement of SWS could prevent some of these age-related changes, remains to be established.
Relation to (Age-Related) Insomnia
Age-related increases in the prevalence of insomnia are often mentioned as related to mental and physical health,2 but they may also be related to age-related changes in sleep regulation per se. Interestingly the changes in nocturnal sleep and daytime sleep propensity observed in healthy aging, bear a striking resemblance to the changes observed in insomnia: reduced nocturnal sleep quality and reduced daytime sleep propensity.43
Although the nocturnal sleep disturbances and the reduction in daytime sleep propensity observed in insomnia is frequently interpreted within the context of the hyper arousal hypothesis of insomnia, a reduced build up of homeostatic sleep pressure could also explain some of these characteristics.44 In fact, in healthy aging the decline in deep sleep is associated with signs of cortical activation,9 similar to those seen in insomnia.45
If older adults are not aware of the reduced build up of homeostatic sleep pressure and expect to need 8 h of sleep, their self-selected time in bed, which provides an input to the sleep homeostat, may become maladaptive and lead to reduced sleep consolidation and associated complaints.
This hypothesis in turn predicts that increasing homeostatic sleep pressure should normalize sleep. Sleep restriction, which will lead to increased homeostatic sleep pressure, may be a successful behavioral therapy for insomnia in older people.46 Whether increasing homeostatic sleep drive by enhancing SWS, leads to similar improvements remains to be investigated.
Whatever the correct interpretation of the data, they may help to firmly establish that healthy older people can expect to be less sleepy than young adults.
DISCLOSURE STATEMENT
This study was sponsored by H. Lundbeck A/S. The study was designed in close collaboration between researchers at the Surrey Sleep Research Centre and H. Lundbeck A/S. All data were analyzed by statisticians at the Clinical Research Centre under supervision of DJD. All authors contributed to the interpretation of the data. The manuscript was written by DJD with input from all co-authors and the final version was approved by all authors. Dr. Dijk has received research support from AFOSR (Air Force Office of Scientific Research), BBSRC (Biotechnology and Biological Sciences Research Council), GlaxoSmithKline, H. Lundbeck A/S, Merck, Philips Lighting, Organon, Takeda, and Wellcome Trust and has consulted for Actelion, Cephalon, GlaxoSmithKline, H. Lundbeck A/S, Merck, Pfizer, Philips Lighting, Sanofi-Aventis, and Takeda. Dr. Groeger has received research support from GlaxoSmithKline and Merck and has received grant funding from AFOSR and BBSRC. Dr. Deacon was an employee of H. Lundbeck A/S at the time of this study. Dr. Stanley has indicated no financial conflicts and received no financial benefit from participation in this study.
ACKNOWLEDGMENTS
We thank the staff of the Clinical Research Centre and the Surrey Sleep Research Centre for conducting the study and Dr Sigurd Johnson and Stuart Peters for statistical analyses. Tony Woolf, (Acoustics LTD, UK) for acoustically configuring the bedroom. We thank Dr. Jonas Lundahl, Frieda Dennis and Annelies Legters (H. Lundbeck A/S) for their contribution to this project.
REFERENCES
- 1.Foley DJ, Monjan AA, Brown SL, Simonsick EM, Wallace RB, Blazer DG. Sleep complaints among elderly persons: an epidemiologic study of three communities. Sleep. 1995;18:425–32. doi: 10.1093/sleep/18.6.425. [DOI] [PubMed] [Google Scholar]
- 2.NIH State-of-the-Science Conference Statement on manifestations and management of chronic insomnia in adults. NIH Consens State Sci Statements. 2005;22:1–30. [PubMed] [Google Scholar]
- 3.Glass J, Lanctot KL, Herrmann N, Sproule BA, Busto UE. Sedative hypnotics in older people with insomnia: meta-analysis of risks and benefits. BMJ. 2005;331:1169. doi: 10.1136/bmj.38623.768588.47. [DOI] [PMC free article] [PubMed] [Google Scholar]
- 4.Groeger JA, Zijlstra FR, Dijk DJ. Sleep quantity, sleep difficulties and their perceived consequences in a representative sample of some 2000 British adults. J Sleep Res. 2004;13:359–71. doi: 10.1111/j.1365-2869.2004.00418.x. [DOI] [PubMed] [Google Scholar]
- 5.Kamel NS, Gammack JK. Insomnia in the elderly: cause, approach, and treatment. Am J Med. 2006;119:463–9. doi: 10.1016/j.amjmed.2005.10.051. [DOI] [PubMed] [Google Scholar]
- 6.Foley D, Ancoli-Israel S, Britz P, Walsh J. Sleep disturbances and chronic disease in older adults: results of the 2003 National Sleep Foundation Sleep in America Survey. J Psychosom Res. 2004;56:497–502. doi: 10.1016/j.jpsychores.2004.02.010. [DOI] [PubMed] [Google Scholar]
- 7.Cole C, Richards K. Sleep disruption in older adults. Harmful and by no means inevitable, it should be assessed for and treated. Am J Nurs. 2007;107:40–9. doi: 10.1097/01.NAJ.0000268167.48606.74. [DOI] [PubMed] [Google Scholar]
- 8.Van Cauter E, Leproult R, Plat L. Age-related changes in slow wave sleep and REM sleep and relationship with growth hormone and cortisol levels in healthy men. JAMA. 2000;284:861–8. doi: 10.1001/jama.284.7.861. [DOI] [PubMed] [Google Scholar]
- 9.Carrier J, Land S, Buysse DJ, Kupfer DJ, Monk TH. The effects of age and gender on sleep EEG power spectral density in the middle years of life (ages 20-60 years old) Psychophysiology. 2001;38:232–42. [PubMed] [Google Scholar]
- 10.Ohayon MM, Carskadon MA, Guilleminault C, Vitiello MV. Meta-analysis of quantitative sleep parameters from childhood to old age in healthy individuals: developing normative sleep values across the human lifespan. Sleep. 2004;27:1255–73. doi: 10.1093/sleep/27.7.1255. [DOI] [PubMed] [Google Scholar]
- 11.Dijk DJ, Duffy JF, Riel E, Shanahan TL, Czeisler CA. Ageing and the circadian and homeostatic regulation of human sleep during forced desynchrony of rest, melatonin and temperature rhythms. J Physiol. 1999;516(Pt 2):611–27. doi: 10.1111/j.1469-7793.1999.0611v.x. [DOI] [PMC free article] [PubMed] [Google Scholar]
- 12.Niggemyer KA, Begley A, Monk T, Buysse DJ. Circadian and homeostatic modulation of sleep in older adults during a 90-minute day study. Sleep. 2004;27:1535–41. doi: 10.1093/sleep/27.8.1535. [DOI] [PubMed] [Google Scholar]
- 13.Buysse DJ, Monk TH, Carrier J, Begley A. Circadian patterns of sleep, sleepiness, and performance in older and younger adults. Sleep. 2005;28:1365–76. doi: 10.1093/sleep/28.11.1365. [DOI] [PubMed] [Google Scholar]
- 14.Dijk DJ, Duffy JF, Czeisler CA. Contribution of circadian physiology and sleep homeostasis to age-related changes in human sleep. Chronobiol Int. 2000;17:285–311. doi: 10.1081/cbi-100101049. [DOI] [PubMed] [Google Scholar]
- 15.Cajochen C, Munch M, Knoblauch V, Blatter K, Wirz-Justice A. Age-related changes in the circadian and homeostatic regulation of human sleep. Chronobiol Int. 2006;23:461–74. doi: 10.1080/07420520500545813. [DOI] [PubMed] [Google Scholar]
- 16.Carskadon MA, Dement WC. Daytime sleepiness: quantification of a behavioral state. Neurosci Biobehav Rev. 1987;11:307–17. doi: 10.1016/s0149-7634(87)80016-7. [DOI] [PubMed] [Google Scholar]
- 17.Agnew HW, Jr, Webb WB, Williams RL. The effects of stage four sleep deprivation. Electroencephalogr Clin Neurophysiol. 1964;17:68–70. doi: 10.1016/0013-4694(64)90011-2. [DOI] [PubMed] [Google Scholar]
- 18.Dijk DJ, Beersma DG, Daan S, Bloem GM, Van den Hoofdakker RH. Quantitative analysis of the effects of slow wave sleep deprivation during the first 3 h of sleep on subsequent EEG power density. Eur Arch Psychiatry Neurol Sci. 1987;236:323–8. doi: 10.1007/BF00377420. [DOI] [PubMed] [Google Scholar]
- 19.Dijk DJ, Beersma DG. Effects of SWS deprivation on subsequent EEG power density and spontaneous sleep duration. Electroencephalogr Clin Neurophysiol. 1989;72:312–20. doi: 10.1016/0013-4694(89)90067-9. [DOI] [PubMed] [Google Scholar]
- 20.Ferrara M, De GL, Bertini M. Selective slow-wave sleep (SWS) deprivation and SWS rebound: do we need a fixed SWS amount per night? Sleep Res Online. 1999;2:15–9. [PubMed] [Google Scholar]
- 21.Carskadon MA, Van den Hoed J, Dement WC. Insomnia and sleep disturbances in the aged. Sleep and daytime sleepiness in the elderly. J Geriatr Psychiatry. 1980;13:135–51. [PubMed] [Google Scholar]
- 22.Richardson GS, Carskadon MA, Orav EJ, Dement WC. Circadian variation of sleep tendency in elderly and young adult subjects. Sleep. 1982;5:S82–S94. doi: 10.1093/sleep/5.s2.s82. [DOI] [PubMed] [Google Scholar]
- 23.Hoch CC, Reynolds CF, III, Jennings JR, et al. Daytime sleepiness and performance among healthy 80 and 20 year olds. Neurobiol Aging. 1992;13:353–6. doi: 10.1016/0197-4580(92)90049-4. [DOI] [PubMed] [Google Scholar]
- 24.Heinzer R, Gaudreau H, Decary A, et al. Slow-wave activity in sleep apnea patients before and after continuous positive airway pressure treatment: contribution to daytime sleepiness. Chest. 2001;119:1807–13. doi: 10.1378/chest.119.6.1807. [DOI] [PubMed] [Google Scholar]
- 25.Bonnet MH. Performance and sleepiness following moderate sleep disruption and slow wave sleep deprivation. Physiol Behav. 1986;37:915–8. [PubMed] [Google Scholar]
- 26.Gillberg M, Akerstedt T. Sleep restriction and SWS-suppression: effects on daytime alertness and night-time recovery. J Sleep Res. 1994;3:144–51. doi: 10.1111/j.1365-2869.1994.tb00121.x. [DOI] [PubMed] [Google Scholar]
- 27.Walsh JK, Hartman PG, Schweitzer PK. Slow-wave sleep deprivation and waking function. J Sleep Res. 1994;3:16–25. doi: 10.1111/j.1365-2869.1994.tb00099.x. [DOI] [PubMed] [Google Scholar]
- 28.Folstein MF, Folstein SE, McHugh PR. “Mini-mental state”. A practical method for grading the cognitive state of patients for the clinician. J Psychiatr Res. 1975;12:189–98. doi: 10.1016/0022-3956(75)90026-6. [DOI] [PubMed] [Google Scholar]
- 29.Sheehan DV, Lecrubier Y, Sheehan KH, et al. The Mini-International Neuropsychiatric Interview (M.I.N.I.): the development and validation of a structured diagnostic psychiatric interview for DSM-IV and ICD-10. J Clin Psychiatry. 1998;59(Suppl 20):22–33. [PubMed] [Google Scholar]
- 30.Buysse DJ, Reynolds CF, III, Monk TH, Berman SR, Kupfer DJ. The Pittsburg Sleep Quality Index: A new instrument for psychiatric practice and research. Psychiatry Res. 1998;28:193–213. doi: 10.1016/0165-1781(89)90047-4. [DOI] [PubMed] [Google Scholar]
- 31.Rechtschaffen A, Kales A. A manual of standardized terminology, techniques and scoring system for sleep stages of human subjects. Washington, DC: U.S. Government Printing Office; 1968. [Google Scholar]
- 32.Cajochen C, Foy R, Dijk D-J. Frontal predominance of relative increase in sleep delta and theta EEG activity after sleep loss in humans. Sleep Res Online. 1999;2:65–9. [PubMed] [Google Scholar]
- 33.Littner MR, Kushida C, Wise M, et al. Practice parameters for clinical use of the multiple sleep latency test and the maintenance of wakefulness test. Sleep. 2005;28:113–21. doi: 10.1093/sleep/28.1.113. [DOI] [PubMed] [Google Scholar]
- 34.Arand D, Bonnet M, Hurwitz T, Mitler M, Rosa R, Sangal RB. The clinical use of the MSLT and MWT. Sleep. 2005;28:123–44. doi: 10.1093/sleep/28.1.123. [DOI] [PubMed] [Google Scholar]
- 35.Gillberg M, Kecklund G, Akerstedt T. Relations between performance and subjective ratings of sleepiness during a night awake. Sleep. 1994;17:236–41. doi: 10.1093/sleep/17.3.236. [DOI] [PubMed] [Google Scholar]
- 36.Campbell SS, Murphy PJ. The nature of spontaneous sleep across adulthood. J Sleep Res. 2007;16:24–32. doi: 10.1111/j.1365-2869.2007.00567.x. [DOI] [PubMed] [Google Scholar]
- 37.Klerman EB, Dijk DJ. Interindividual variation in sleep duration and its association with sleep debt in young adults. Sleep. 2005;28:1253–9. doi: 10.1093/sleep/28.10.1253. [DOI] [PMC free article] [PubMed] [Google Scholar]
- 38.Klerman EB, Dijk DJ. Age-related reduction in the maximal capacity for sleep--implications for insomnia. Curr Biol. 2008;18:1118–23. doi: 10.1016/j.cub.2008.06.047. [DOI] [PMC free article] [PubMed] [Google Scholar]
- 39.Munch M, Knoblauch V, Blatter K, et al. Age-related attenuation of the evening circadian arousal signal in humans. Neurobiol Aging. 2005;26:1307–19. doi: 10.1016/j.neurobiolaging.2005.03.004. [DOI] [PubMed] [Google Scholar]
- 40.Walsh JK, Snyder E, Hall J, et al. Slow wave sleep enhancement with gaboxadol reduces daytime sleepiness during sleep restriction. Sleep. 2008;31:659–72. doi: 10.1093/sleep/31.5.659. [DOI] [PMC free article] [PubMed] [Google Scholar]
- 41.Borbely AA, Achermann P, Trachsel L, Tobler I. Sleep initiation and initial sleep intensity: interactions of homeostatic and circadian mechanisms. J Biol Rhythms. 1989;4:149–60. [PubMed] [Google Scholar]
- 42.Adam M, Retey JV, Khatami R, Landolt HP. Age-related changes in the time course of vigilant attention during 40 hours without sleep in men. Sleep. 2006;29:55–7. doi: 10.1093/sleep/29.1.55. [DOI] [PubMed] [Google Scholar]
- 43.Roth T, Roehrs T, Pies R. Insomnia: pathophysiology and implications for treatment. Sleep Med Rev. 2007;11:71–9. doi: 10.1016/j.smrv.2006.06.002. [DOI] [PubMed] [Google Scholar]
- 44.Pigeon WR, Perlis ML. Sleep homeostasis in primary insomnia. Sleep Med Rev. 2006;10:247–54. doi: 10.1016/j.smrv.2005.09.002. [DOI] [PubMed] [Google Scholar]
- 45.Perlis ML, Merica H, Smith MT, Giles DE. Beta EEG activity and insomnia. Sleep Med Rev. 2001;5:363–74. doi: 10.1053/smrv.2001.0151. [DOI] [PubMed] [Google Scholar]
- 46.Germain A, Moul DE, Franzen PL, et al. Effects of a brief behavioral treatment for late-life insomnia: preliminary findings. J Clin Sleep Med. 2006;2:403–6. [PubMed] [Google Scholar]