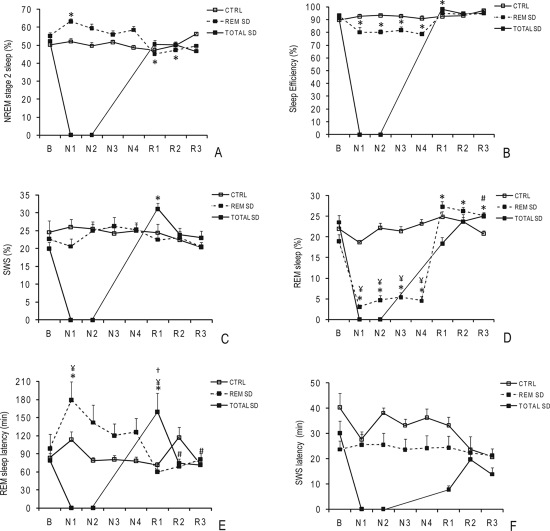
Figure 3.
Sleep architecture during the experimental protocol in control and sleep-deprived (SD) groups at baseline (B), during nights of SD (N1, N2, N3, N4), and during nights of sleep recovery (R1, R2, R3).
The data are expressed as the mean ± SEM (n = 10 volunteers per group). *, significant differences vs. baseline; #, significant differences vs. R1; ¥, significant differences vs. the control group in each respective time-point (ANOVA for repeated measures, followed by a Tukey-Kramer test, see text for p-values). Percentage of NREM stage 2 sleep (A); percentage of sleep efficiency (B); percentage of slow wave sleep (SWS) (C); percentage of REM sleep (D); REM sleep latency in minutes(E); and SWS latency in minutes (F).

