Abstract
A new magnetic electrochemical immunoassay has been developed as a tool for biomonitoring exposures to organophosphate (OP) compounds, e. g. insecticides and chemical nerve agents through directly detecting OP phosphorylated acetylcholinesterase (OP-AChE). This immunoassay uniquely incorporates highly-efficient magnetic separation with ultra-sensitive square wave voltammetry (SWV) analysis using quantum dots (QDs) as labels. A pair of antibodies were utilized to achieve the specific recognition of OP-AChE that was prepared using paraoxon as an OP model agent. Anti-phosphoserine polyclonal antibodies (Ab1) were anchored on amorphous magnetic particles (MPs) preferably chosen to capture OP-AChE from the sample matrixes through binding their phosphoserine moieties that were exposed through unfolding the protein adducts, which was validated by electrochemical examinations and enzyme-linked immunosorbent assays. Furthermore, anti-human AChE monoclonal antibodies (Ab2) were labeled with cadmium-source QDs to selectively recognize the captured OP-AChE, as characterized by transmission electron microscopy (TEM). The subsequent electrochemical SWV analysis of the cadmium component released by acid from the coupled QDs was conducted on disposable screen-printed electrodes (SPEs). Experimental results indicated that the SWV-based immunoassays could yield a linear response over a broad concentration range of 0.3 – 300 ng/mL OP-AChE in human plasma with a detection limit of 0.15 ng/mL. Such a novel electrochemical immunoassay holds great promises as a simple, selective, sensitive, and field analysis tool for the effective bio-monitoring and diagnosis of potential exposures to nerve agents and pesticides.
Introduction
Neurotoxic organophosphates (OPs) have been widely used as pesticides in agricultural industry and as chemical warfare agents.1, 2 As a result, OP contaminations have been widespread in air, water, soil, and food, such that there is a potential for human exposures. Therefore, public concern about the development of effective detection devices for effective monitoring OPs and evaluation of human health risk of OP exposure has grown steadily in recent years.3–5 Moreover, after the Tokyo subway attack in 1995,6 the needs for feasible OP detection methods have become increasingly urgent for purpose of early warning of potential terrorist attack and diagnostic mitigation of the effects from alleged nerve-agent exposures.2, 3, 5–7
In recent decades, numerous analysis methods have been developed for the assessment of OP exposures, and the relevance of end points to human health is of utmost concern.3, 8–10 In this regard, biomonitoring of OP exposures is recognized to be one of the best approaches.8 The internal dosages of OP agents or their metabolites are quantitatively and / or qualitatively measured on the basis of our knowledge of the metabolic fate of the toxicants, thus providing the accurate evaluation of the health risk of integrated OP exposure. Unfortunately, the majority of current biomonitoring protocols for OP exposures, 3, 8, 11, 12 may still suffer from some intrinsic disadvantages of either low detection specificity and sensitivity (i.e., Ellman colorimetric assays13, 14 ), or expensive analysis settings entailing well-trained personnel and inconvenience for field applications (i.e., gas or liquid chromatography coupled with mass spectrometry (GC- or LC-MS) 4, 15–17). Hence, simple, sensitive, selective and field-deployable tools are still highly desired for biomonitoring and diagnostic evaluation of OP exposures at present, especially for the enhancement of our response to a sudden emergency and the improvement of our ability to medically counteract the effects.
It is generally recognized that selection of suitable biomarkers for OP detections is of central importance for developing a biomonitoring strategy.8, 12 Biomarkers that are currently used include: free OPs in blood, or their metabolites in urine, and cholinesterase (ChE) inhibition in blood.3, 8, 9, 12 OPs can stoichiometrically bind with ChE and inhibit the enzyme activity, at the same time, they are metabolized by organophosphorus hydrolase to form inactive phosphonic acids that are then renally excreted.8 The high reactivity of OPs with these enzymes suggests that the levels of free OPs will be inherently low (typically in the range of nanogram per liter or parts per trillion in blood 12), such that ultra-sensitive detection methodologies are thereby required; yet, the formidable false positive signals might be difficult to avoid. Moreover, while OP metabolite level in urine is also considered a sensitive indicator of OP exposure,8, 18 the fact that not all toxicant specific metabolites are derived solely from OPs is a real concern.12 Also, ChE inhibition as a biomarker of OP exposure effect has historically been an important strategy, but the inhibition-based quantification can also be problematic.12, 19 For example, for a quantitative assessment a baseline enzyme level is required to accommodate the individual fluctuations in enzyme levels. All of these factors thereby make the blood ChE measurements less viable for assessing some OP exposures.12 Therefore, exploring selective, sensitive and reliable alternative biomarkers is an important consideration for biomonitoring of OP exposures.
Electrochemical immunoassays with high selectivity and sensitivity have evolved rapidly over the past decades.20–23 Their detection sensitivity may be enhanced by using various nano-scale materials newly emerged, i.e., quantum dots,24 for electrochemical signal amplifications.23, 25 Such a versatile analysis tool can possess some advantages over the present standard methods for assessment of OP exposures that are based on GC-MS and LC-MS.20, 21, 26 More importantly, their simple operation and miniaturized analysis instruments can meet the requirements of decentralized point–of-care tests or field detections.21, 22, 27 Moreover, according to the biochemical mechanism widely accepted for ChE phosphorylation,28, 29 the inhibition event may produce very stable enzyme complexes with structurally precise phosphoserine esters,30 suggesting that these products may serve as selective indicators directly correlated to the severity of OP exposures. However, a challenge may lie in the current unavailability of recognition elements or appropriate receptors, i.e., antibodies, for specifically targeting phosphorylated ChE. Although some specific antibodies against OP agents, i.e., paraoxon, have been recently developed and commercially available for immunoassays,31–33 they might be unable to selectively recognize modified or aged OP moieties of OP-AChE., which is addressed in this study.
In this work, we present preliminary studies to establish a novel electrochemical immunoassay of phosphorylated AChE as a biomarker for biomonitoring and diagnosis of OP exposures. OP-AChE, which was prepared by incubating human AChE with paraoxon, was used as the model targets. In order to circumvent the current limitations of OP-AChE recognition, two kinds of antibodies, anti-phosphoserine polyclonal antibodies (termed as Ab1) and anti-human AChE monoclonal antibodies (termed as Ab2), were employed to facilitate the specific recognitions of OP-AChE. Amorphous magnetic particles (MPs) with large surface-to-volume ratio were chosen to load Ab1 to capture the OP-AChE from the sample matrixes through binding the phosphoserine moieties, which were disclosed through reductively unfolding the protein adducts via dithiothreitol (DDT), followed by the second recognition of Ab2 labeled with QDs serving as the signal-amplifying tags. The sandwich immunoreaction events were subsequently quantified by square wave voltammetric (SWV) analysis. Main parameters governing the SWV responses were optimized including the MP-Ab1 conjugate dosage, QD-Ab2 label concentration, and reaction time. Moreover, a blocking agent consisting of 3 % BSA and 1 % PEG was introduced for effective minimization of nonspecific adsorptions in the immunoassays. The magnetic-aided immunoassay was overall proofed with simple, selective and sensitive analysis features by spiking human plasma with known OP-AChE concentrations.
Experimental Section
Reagents and materials
The Qdot@655 antibody conjugation kit was purchased from Molecular Probes Inc. (Eugene, OR), which includes quantum dots (QDs, CdS@ZnS), succinimidyl trans-4-(N-maleimidylmethyl) cyclohexane-1-carboxylate solution, dithiothreitol (DDT) solution, dye-labeled marker for antibody elution, mercaptoethanol, separation media, and exchange buffer. BioMag® magnetic immobilization kit was obtained from Polysciences Inc. (Warrington, PA), with amine-terminated amorphous magnetic particles (MPs, 50 mg/mL), glutaraldehyde (GLU) coupling reagent, and glycine quenching solution. Human acetylcholinesterase (AChE), polyethylene glycol (PEG, MW 10 KD), bovine serum albumin (BSA), hydroxylamine, phosphate buffer saline (PBS), Tris-HCl stock buffer (1.0 M) and Tween-20 were the products of Sigma-Aldrich. Anti-phosphoserine polyclonal antibodies (Ab1) and their horseradish peroxidase (HRP) conjugate, and anti-human monoclonal AChE antibodies (Ab2) were purchased from Abcam Inc. (Cambridge, MA). Paraoxon was bought from Chem Service, Inc. (West Chester, PA). The BSA-PEG blocking agent consists of 3 % BSA and 1 % PEG in Tris-HCl buffer (0.02 M), which pH was adjusted to 7.4 using 0.1 M HCl. The washing buffer was prepared with 0.02 M Tris-HCl buffer containing 0.1 % Tween-20, 0.5 % BSA and 0.15 M NaCl. All stock and buffer solutions were prepared with Nanopure-purified water. Other reagents were of analytical reagent grade.
Instruments
MCB 1200 Biomagnetic Processing Platform was the product of Dexter Magnetic Technologies (Sigris, CA). Square-wave voltammetric (SWV) measurements were performed using an electrochemical analyzer CHI 660 (CH Instruments, Austin, TX), which is connected to a personal computer. Disposable screen-printed electrodes (SPEs) consisting of a carbon working electrode, a carbon counter electrode, and an Ag/AgCl reference electrode, were purchased from Alderon Biosciences Inc. (Durham, NC). A sensor connector allows for connecting the SPE to the CHI electrochemical analyzer. Transmission electron microscope (TEM, Hitachi H-7000, Japan) was utilized to characterize the sample suspensions, each of which was dropped onto the carbonate film-coated copper grids (3 mm-diameter, 200-mesh) to be dried at room temperature and then measured at 75 kV. Microplates for enzyme-linked immunoassay (ELISA) were purchased from Becton (Franklin lakes, NJ). Disposable PD-10 desalting columns packed with Sephadex G-25 medium (Amersham Bioscience Corp.) were used to purify the protein solutions. Centrifugation was performed using a Sorvall RC 26 plus (Kendro Laboratory Product). Vortex mixer with touch-on-off mixing functions (Barnstead International, Iowa) was used for sample and reactant mixing.
Preparation of MP-Ab1 conjugates
The MP-Ab1 conjugates were prepared following the modified protocol available in the BioMag® magnetic immobilization kit. Typically, 1.0 mL of BioMag amorphous MP suspension terminated with amine groups was transferred to a 2.5-mL centrifuge tube to be washed three times with 0.5 mM PBS (pH 7.4), then magnetically separated on the Biomagnetic processing platform. The supernatant was aspirated out, leaving the BioMag packed as a wet cake on the tube wall. Two mL of GLU (5 %) was then added to the BioMag to be vortexed, and then rotated for 3 h at room temperature. Furthermore, magnetic separation was conducted to remove the unreacted GLU. After being washed four times using 0.5 mM PBS buffer, 1.0 mL of 0.5 mg/mL Ab1, which were prepared in 0.5 mM PBS were then added to the GLU-activated BioMag particles. The mixture was vortexed and further rotated overnight at room temperature, followed by magnetic separation and twice washings. Subsequently, 5.0 mL of glycine solution was introduced into the coupled BioMag to be further rotated for 30 min at room temperature so as to quench the activated BioMag possibly left, and then magnetically separated and washed three times. In the immunoassays, the MP-Ab1 suspension was diluted by the BSA-PEG blocking agent to 1.0 mg/mL of MP particle concentration, which was defined as the stock suspension of MP-Ab1 conjugates.
Preparation of QD-Ab2 labels
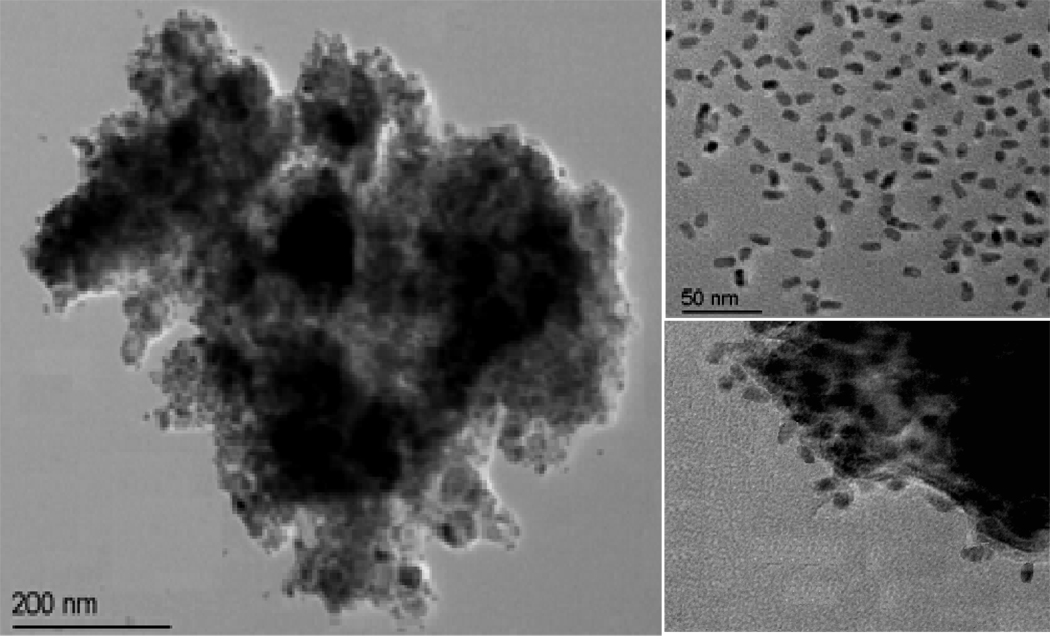
The QD-Ab2 labels were prepared following the protocol from the Qdot@655 antibody conjugation kit. Basically, 0.5 mg/mL Ab2 was firstly reduced by DDT to obtain Fab’ fragments with free sulfhydryls via unfolding the disulfide bonds at the Fc region of antibody. The amine-terminated QDs (TEM image shown in the top right of Figure 2) were pre-activated by succinimidyl trans-4-(N-maleimidylmethyl) cyclohexane-1-carboxylate, and then added to the resultant antibody solution to be mixed and reacted for 1 h at room temperature. After being quenched by mercaptoethanol, the mixture was concentrated by ultra-filtration and purified using the size-exclusion chromatography. The QD-Ab2 suspension was orange-red-colored. Each QD nanocrystal was estimated to load about eight antibody fragments or four intact antibodies,24 with well-retained activity of binding antigens. In the immunoassays, the QD-Ab2 suspension was further diluted by the BSA-PEG blocking agent at the optimized dilution ratio of 1/120 (v/v), which was defined as the stock suspension of QD-Ab2 labels.
Figure 2.
Typical TEM images of (a) the formed sandwich immuno-complex, (b) the QD tags used, and (c) part of the immuno-complex in high magnitude.
Preparation of OP-AChE
OP-AChE was prepared by the incubation of AChE with paraoxon as a model of OPs in 50 mM PBS buffer solution overnight. Briefly, 1.0 mL of a PBS buffer solution containing 240 µg human AChE was mixed with 50.0 µL of acetone containing 34 µg paraoxon to be incubated overnight. The resulted solution was purified with PD-10 column to remove unbound paraoxon and solvent acetone. The enzyme activity of the product was further determined using the Ellman assay till being completely inhibited.13 Moreover, the resultant OP-AChE was concentrated by using ultra-filtration to a final volume of ∼ 1.0 mL, and stored at −20 °C for future use. The protein concentration of OP-AChE stock solution was determined to be ∼ 0.2 mg/mL by spectrophotometry at 280 nm. Of note, all of OP-AChE in the experiments referred to those that were reductively unfolded by 5.0 mM DDT for 15 min prior to immunoassays, unless otherwise indicated.
ELISA for antibody immuno-affinities to OP-AChE
The immuno-affinities of Ab1 and Ab2 to OP-AChE were examined by ELISA using HRP-conjugated Ab1 and Ab2, where the comparable assays for non-DDT-unfolded OP-AChE, AChE and BSA were conducted in parallel as the controls. Fifty µL aliquot of Ab2 solution (1.0 µg/mL in the blocking solution) was first added into each well of the microplate with three replicates to be incubated overnight at 4 °C. After rinsing the plate wells three times with the washing buffer, 250 µL aliquot of the BSA-PEG blocking agent was introduced to each well to be incubated for 1.5 h at 37 °C. Then, the plate was washed three times. Furthermore, 50 µL aliquot of samples with the desired concentrations was added into each well to be incubated for 1 h at 37 °C, and plate washing was conducted for three times. Following that, 50 µL aliquot of HRP-conjugated Ab1 solution (1.0 µg/mL) was added to each well, and the immunoreaction proceeded for 1 h at 37 °C. After the wells were rinsed four times, 100 µL aliquot of the color substrate was added, and the enzyme catalyzed reaction progressed for 10 min at room temperature. Subsequently, the enzymatic reaction was ceased by adding 10 µL aliquot of 1.0 M HCl per well. The plate was immediately measured at 450 nm on a microplate reader and the absorbance of each well was recorded separately.
Magnetic electrochemical SWV immunoassays
Twenty five µL aliquot of samples, with the desired OP-AChE concentrations in Tris-HCl buffer (pH 7.4) or human plasma, were added separately into 1.5 mL plastic centrifuge tubes that were pre-washed twice with the washing buffer. Twenty five µL aliquot of MP-Ab1 conjugate suspension (1.0 mg/mL) was then introduced into each tube to be vortexed by the touch-on-off mixer, and further rotated on the Biomagnetic processing platform for 45 min at room temperature. The mixtures were magnetically separated simply by upraising the magnet at the platform, and then rinsed twice with the washing buffer. Following the same procedure above, 50 µL aliquot of QD-Ab2 labels (1/120, v/v) was injected into each tube to be vortexed and rotated for 30 min at room temperature. The resulted mixtures were rinsed twice (the formed immuno-complex was diluted in Tris-HCl buffer for TEM measurements, with the images shown in Figure 2). Moreover, 10 µL aliquot of 1.0 M HCl was added into each tube to release cadmium ions from the captured QD labels, followed by the addition of 50 µL aliquot of 0.20 M acetate buffer (pH 4.6) containing 10 µg/mL Hg and 0.5 µg/mL Bi. After mixing for 2 min, the BioMag were magnetically precipitated resulting in a “wet cake” formed on the tube walls. 50 µL aliquot of the supernatants was then drawn to be separately transferred to the surface of the SPEs, which were pretreated electrochemically by cyclic voltammetric scanning for 10 times at potential range of 0 – 1.5 V in 50 mM PBS (pH 7.4). Subsequently, electrochemical SWV measurements were carried out by using an in situ-plated Hg/Bi film formed on the SPEs by a 2-min accumulation at −1.4 V. The analysis parameters mainly included the applied potential range of −1.0 to 0.5 V, step potential of 4 mV, amplitude of 25 mV, and frequency of 15 Hz. A baseline correction of the resulting voltammogram was performed using CHI 660A software (Note: the waste after each immunoassay should be collected to a bottle to be disposed safely).
Results and Discussion
Principle of magnetic electrochemical immunoassay using QD labels
It is recognized that OPs have the same general structure and toxicological mode of action.28 In this work, paraoxon was utilized as a model of OP nerve agent and pesticide to prepare the OP phosphorylated AChE (OP-AChE). Herein, the biochemical mechanism of OP inhibition of AChE has been well documented and understood, which process is initiated by precursory phosphorylation at the catalytic serine residue.28–30 The phosphorylation of AChE by paraoxon is synchronous with the release of p-nitrophenoxy and further goes through an aging process to produce a stable, covalent phosphoserine ester bond or an OP-AChE conjugate.30 The so formed OP-AChE can quantitatively correlate to the original OP dose, thus potentially serving as a selective OP biomarker. However, the detection of this biomarker may be problematic if specific antibodies cannot detect the modified protein. Moreover, in addition to binding with AChE at its peripheral anionic site,34, 35 OP (i.e., paraxon) is recognized mostly to phosphorylate the serine residues at the catalytic active center locating at the base of a deep gorge within the proteins,30, 36 of which phosphoserine moieties are thought to be inaccessible to many traditional forms of analysis.
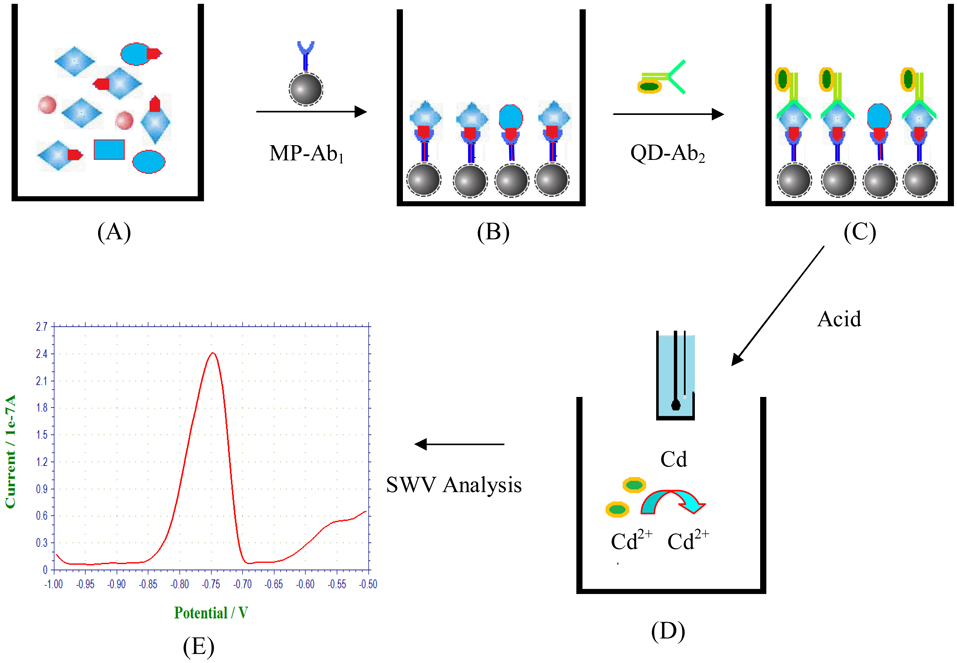
Inspired by the fate of OP-AChE formed with structurally precise phosphoserine esters, herein, we attempted to utilize two kinds of commercially-available antibodies, Ab1 and Ab2, to bind the phosphoserine and AChE moieties of the OP-AChE, respectively, achieving the specific recognition of the meaningful adducts. It is well established that ChE (i.e., AChE) is made up of subunits structurally containing inter- and intra-molecular disulfide bonds,36–38 which can be cleaved by DDT serving as a reducing agent.37, 38 Accordingly, DDT was employed to reductively unfold OP-AChE so as to expose its phosphoserine moieties for more accessible immuno-recognition. An electrochemical immunoassay method was thereby developed by combining magnetic separation with electrochemical SWV analysis using QDs as signal amplification tags. Figure 1 schematically illustrates the process of electrochemical immunoassays for OP-AChE in a sandwich detection format, which was performed using centrifuge tubes and disposable SPEs. OP-AChE is first captured by MP-Ab1 through binding the phosphoserine moieties to be magnetically separated from the sample matrixes. QD-Ab2 is then introduced to selectively recognize the captured OP-AChE. The resultant immunocomplex is subsequently treated by acid to release cadmium ions from the bound QDs for SWV measurements on the SPEs. The yielded SWV signals are proportional to the OP-AChE concentrations in the samples. Figure 2 presents the typical TEM images of as-formed immuno-complex and QDs originally used (top right). One can note that amine-terminated MPs are amorphous, and the QD tags are uniform in size and short-rod shaped with dimensions of about 4 nm × 12 nm. Upon the immuno-recognition of targeting OP-AChE, QDs are attached onto the MP surface forming the sandwich immunocomplex, as clearly shown in the high-magnitude TEM image (bottom right of Figure 2).
Figure 1.
Schematic illustration of magnetic electrochemical immunoassays of OP-AChE: (A) Plasma samples, (B) Magnetic capture of OP-AChE using amorphous MP-Ab1 conjugates, (C) Selective recognition of bound OP-AChE using QD-Ab2 labels, (D) Electrochemical SWV analysis of cadmium released by acid from the captured QDs, and (E) Representative SWV signal output.
In this protocol, use of amorphous MPs can afford higher surface-to-volume ratio for loading larger amount of antibodies. The magnetic separation of OP-AChE can allow for the enrichment of the analytes from the samples to facilitate the electrochemical SWV detections conducted on the SPEs, which might largely avoid the formidable interferences from the complex sample media. Moreover, SWV using mercury film is recognized as an ultra-sensitive technique for determination of heavy metals due to its unique ability of pre-concentrating target species in combination with pulse measurements that yields a high signal-to-background ratio. Additionally, QDs were coated with a thin layer of functionalized polymer providing terminal amine groups for antibody conjugation and spacing between the antibody and QD, which greatly increases the flexibility of antibodies on the surface of QDs. Use of QD tags for the SWV analysis may further benefit from the amplified response signal, achieving enhanced detection sensitivity of the immunoassays.
Evaluation of antibody immuno-affinities to OP-AChE
The manufacturer instructions state that anti-phosphoserine polyclonal antibodies are specific to free and conjugated phosphoserine as well as phosphoserine in modified cellular proteins, without crossing reaction with non-phosphorylated serine. However, it is not clear whether both of Ab1 and Ab2 can specifically recognize the phosphorylated AChE that was reductively unfolded by DDT.
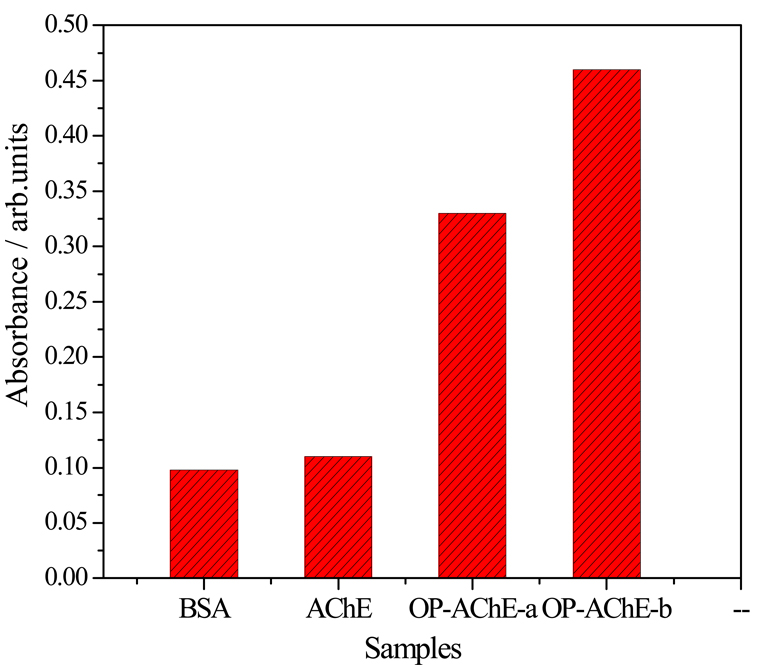
We first studied the immuno-affinity of Ab1 and Ab2 to OP-AChE by the classic ELISA using HRP-conjugated Ab1 and pure Ab2. DDT-unfolded OP-AChE was employed as the test targets, with non-DDT-unfolded OP-AChE, non-phosphorylated AChE and BSA as the protein controls. Figure 3 displays the ELISA results. Obviously, the response to non-DDT-unfolded OP-AChE (a) is smaller than that to DDT-unfolded ones (b). Moreover, the responses obtained from the control experiments using AChE and high-concentration BSA are > 2.1 times lower than that from OP-AChE. The ELISA data demonstrate that use of Ab1 and Ab2 could present good immuno-affinity and specificity to the phosphorylated AChE treated by DDT.
Figure 3.
Typical ELISA responses to 10 mg/mL BSA, 300 ng/mL AChE, and 300 ng/mL (a) non-DDT-unfolded and (b) DDT-unfolded OP-AChE using HRP-labeled Ab1 and pure Ab2.
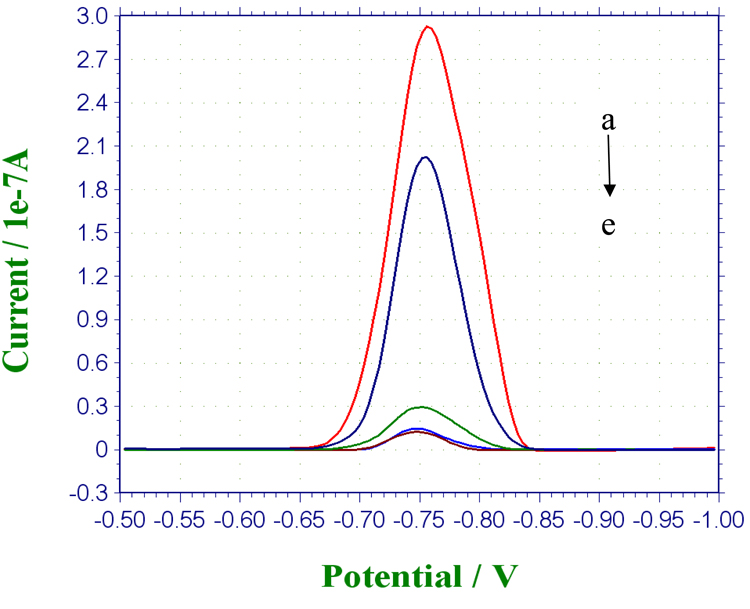
Furthermore, the immuno-affinities of MP-Ab1 and QD-Ab2 to OP-AChE were investigated by electrochemical measurements. Here, non-DDT-unfolded OP-AChE, non-phosphorylated pure AChE, BSA and human plasma were simultaneously examined as the challenging protein rivals and sample background. The typical electrochemical responses were shown in Figure 4. It is noted that the current response for DDT-unfolded OP-AChE (curve a) is higher than that of non-DDT-unfolded ones (curve b), indicating the effective role of DDT in reductively unfolding the phosphorylated enzymes for maximizing exposure of their phosphoserine moieties. In contrast, negligibly low signals were observed in the control experiments for AChE (curve c), plasma (curve d) and BSA (curve e). Signals from the control experiments are presumably ascribed to the nonspecific adsorptions of QD-Ab2 to the magnetic particles and centrifuge tubes used. Such a phenomenon may make it necessary to block both of MP-Ab1 conjugates and QD-Ab2 labels as well as the plastic centrifuge tubes, which is discussed afterwards. The signal differences between OP-AChE and these controls indicate that the possibly co-existing AChE and plasma background can have no significant interference with the magnetic-aided electrochemical immunoassays for OP-AChE. The synergistic utilization of MP-Ab1 conjugates and QD-Ab2 labels can achieve desirably specific immuno-recognition to OP-AChE.
Figure 4.
Comparison of SWV responses of the immunoassays to 300 ng/mL of (a) DDT-unfolded and (b) non-DDT-unfolded OP-AChE, and (c) 300 ng/mL AChE, (d) plasma and (e) 10 mg/mL BSA, all of which were prepared in Tris-HCl buffer (pH 7.4) to be detected separately under the experimental conditions including 45-min magnetic capture with MP-Ab1 conjugates (1.0 mg/mL) and 30-min selective recognition with QD-Ab2 labels (1/120 dilution, v/v).
Minimization of nonspecific adsorption of the immunoassay
Nonspecific adsorption is one of the important issues to be addressed in the development of magnet-aided immunoassays with high selectivity and sensitivity. In the current study, we found that the immunoassays for OP-AChE could have serious nonspecific adsorptions, especially for probing the analytes in human plasma. To minimize such a nonspecific adsorption, we tried to separately introduce 3 % BSA and the BSA-PEG mixture as the blocking agents to pre-treat MP-Ab1 conjugates and QD-Ab2 labels prior to immunoassays. The minimization effectiveness of two kinds of blocking agents was evaluated with the same OP-AChE concentration together with non-phosphorylated AChE and plasma as the controls. The test results are summarized in Table 1. When no blocking step was carried out for two antibody conjugates, the current responses showed no significant difference between OP-AChE, AChE and plasma samples. However, when both antibody conjugates were separately blocked by 3 % BSA, non-specific adsorptions could be largely depressed. Herein, the current response for OP-AChE changed to 3.4 × 10⁻⁷ A, while the current responses for AChE and plasma were sharply down to 5.1 × 10⁻⁸ A and 3.3 × 10⁻⁸ A, respectively. Moreover, non-specific adsorptions could be further depressed when the BSA-PEG agent was utilized to block MP-Ab1 conjugates and QD-Ab2 labels. As is noted from Table 1, negligible current signals were observed for the protein rival (3.0 × 10⁻⁸ A) and plasma background (1.7 × 10⁻⁸ A), in contrast to the adduct sample (2.9 × 10⁻⁷ A). The above results imply that use of the BSA-PEG blocking agent can achieve desirable minimization of nonspecific adsorptions in the immunoassays for OP-AChE. In addition, a pre-treatment of the plastic centrifuge tubes with the BSA-PEG agent could be helpful for avoiding any nonspecific adsorption of QD tags onto the tube walls (data not shown).
Table 1.
Comparison of minimization effectiveness of nonspecific adsorption for immunoassays using different blocking agents a
| Samples | The blocking agents |
||
|---|---|---|---|
| None | 3 % BSA | 3 % BSA-1% PEG | |
| OP-AChE | 6.4 × 10⁻⁷ A | 3.4 × 10⁻⁷ A | 2.9 × 10⁻⁷ A |
| AChE | 4.3 × 10⁻⁷ A | 5.1 × 10⁻⁸ A | 3.0 × 10⁻⁸ A |
| Plasma | 2.9 × 10⁻⁷ A | 3.3 × 10⁻⁸ A | 1.7 × 10⁻⁸ A |
Each of the current responses is the average of triplicate measurements of the samples of 300 ng/mL OPAChE, 300 ng/mL AChE, and plasma under the optimized experimental conditions as described in Figure 4, except for use of different blocking agents.
Such an excellent limitation of nonspecific adsorptions may be attributed to the synergetic blocking effects of BSA and PEG that were simultaneously applied for MP-Ab1 conjugates and QD-Ab2 labels. BSA, a kind of small inert molecules of protein, has been well recognized and commonly applied as a blocking agent in varying immunoassays. PEG as a water-soluble and non-immunogenic polymer can possess the unique ability of depressing some nonspecific protein adsorptions and cell adhesions.39, 40 Many surfaces are accordingly derivatized with hydrophilic PEG coatings to improve their biocompatibility.41, 42 PEG layers in water, with rapidly moving hydrated anchored chains and a large excluded volume, tend to repel protein molecules approaching the meaningful surfaces.40, 42 Additionally, PEG is also widely utilized as reaction rate accelerator and detection sensitivity promoter in immunoassays.43, 44 The mechanism regarding the steric exclusion effects is described elsewhere.45 Therefore, the minimization of nonspecific adsorptions by use of the BSA-PEG blocking agent could additionally endow the immunoassays better analysis performances for quantifying OP-AChE in terms of detection rate, sensitivity and selectivity.
Optimization of major parameters for electrochemical immunoassays
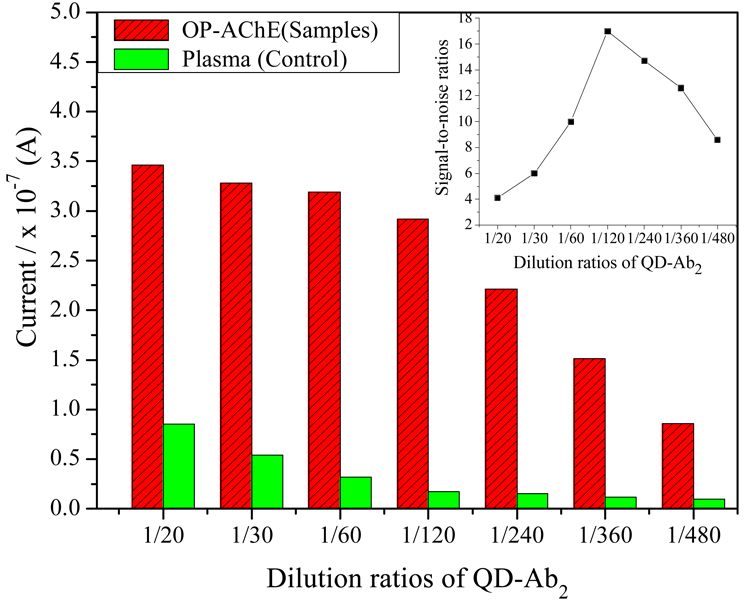
The dependence of current signals of immunoassays on the amount of QD-Ab2 labels was examined using different dilutions of the stock QD-Ab2 suspension. The experimental results are described in Figure 5, in which the current responses to the plasma are shown as the control. As can be seen from Figure 5, electrochemical SWV responses to the samples and the control decrease with greater dilution ratios of QD tags. In this regard, an excess of QD-Ab2 labels might cause an increasing nonspecific adsorption, indicating the need to obtain a maximal response while using a minimum amount of QD-Ab2 labels. Accordingly, the optimal amount of QD-Ab2 labels in the reactant solution was determined to be 1/120 dilution, at which the biggest signal-to-noise ratio was observed as shown in the inset of Figure 5.
Figure 5.
Effects of the dosage of QD-Ab2 labels in dilutions on the SWV responses of the immunoassays, where the detections for 300 ng/mL OP-AChE and plasma (control) were performed in parallel under the conditions as described in Figure 4, except for using Qdot-Ab2 labels of different concentration dilutions.
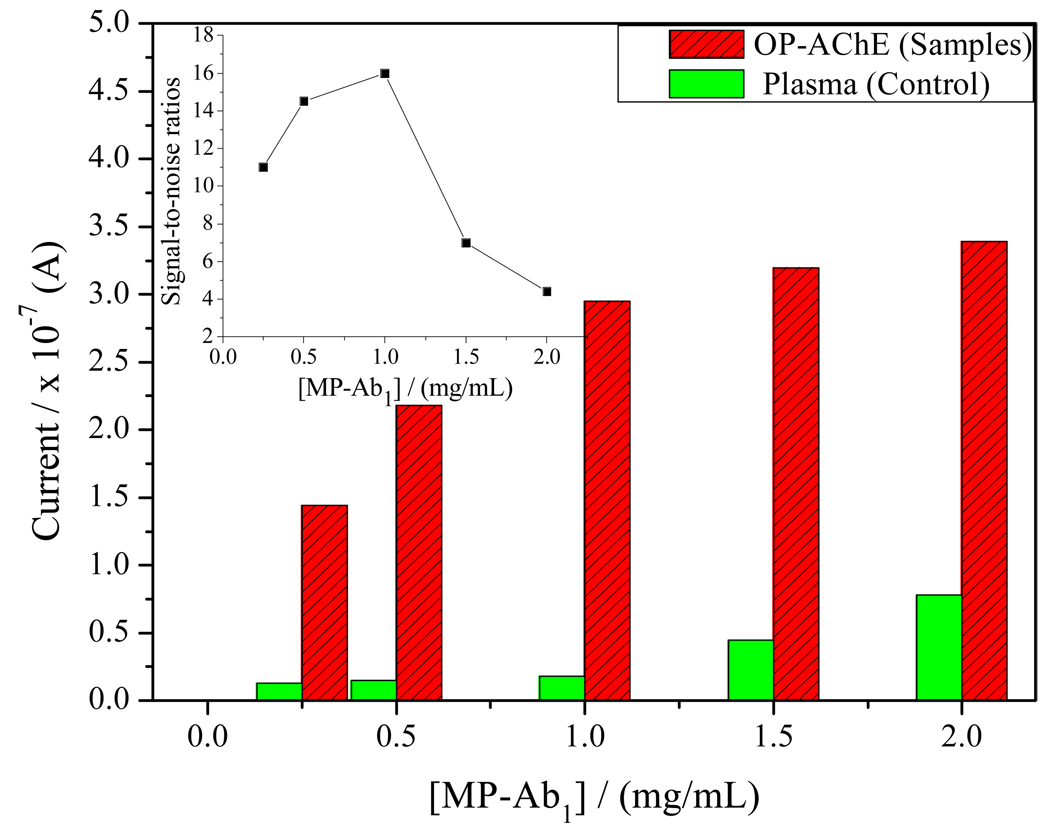
Figure 6 displays the SWV response currents that could be affected by the amount of MP-Ab1 conjugates used, in which human plasma was determined in parallel as the control for different concentrations of MP-Ab1 conjugates. The current responses for the same OP-AChE concentration can increase with MP-Ab1 particle concentrations raising from 0.25 mg/mL to 2.0 mg/mL, so do the SWV responses to the plasma (noise). Obviously, high MP-Ab1 concentrations may result in high noise responses to the plasma. As is shown in the insert of Figure 6, however, their signal-to-noise ratios may peak at 1.0 mg/mL of MP particle concentration, after which the ratios may start to decrease. Therefore, 1.0 mg/mL MP-Ab1 is selected in the experiments by compromising between high sample responses with low background interference from the plasma.
Figure 6.
Effects of the amount of MP-Ab1 conjugates on the SWV responses of the immunoassays, where the detections for 300 ng/mL OP-AChE and plasma (control) were conducted in parallel under the conditions as described in Figure 4, except for using MP-Ab1 conjugates of different concentrations.
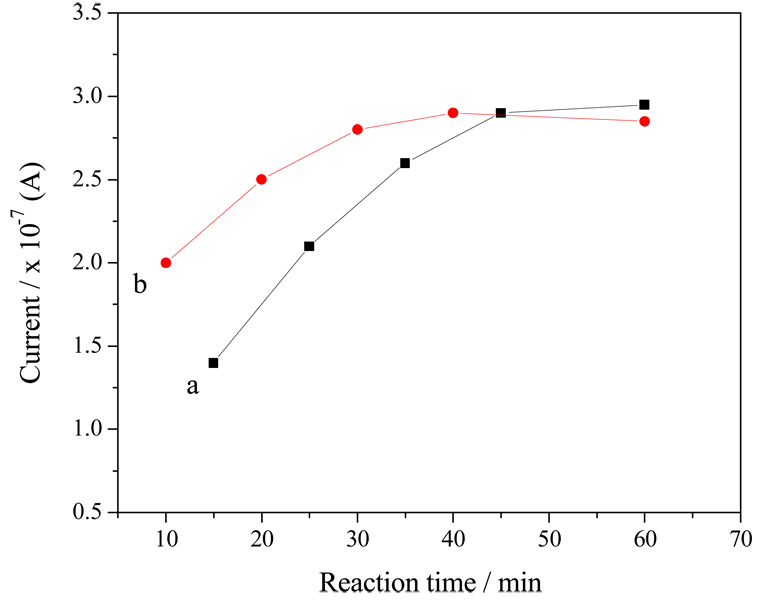
Reaction times for both magnetic capture and QD recognition of OP-AChE are considered to be two vital factors largely affecting the detection performances of the proposed immunoassays. On the one hand, we have checked the effects of the adduct capture time on magnet-aided immunoassays using MP-Ab1 conjugates and high-concentration OP-AChE (Figure 7, curve a). It was found that longer reaction time could bring about bigger current response, which might result from more complete capture of OP-AChE from the sample. From Figure 7 (curve a), we can see that the current responses can increase with increasing capture time till 45 min, after which the responses reach a plateau. Accordingly, the time for the capturing immunoreaction between MP-Ab1 conjugates and OP-AChE is chosen as 45 min. It should be pointed out that the reaction time needed for magnetic capture of phosphorylated AChE may additionally depend on the analyte concentration and the physiochemical property of the sample media. For example, high viscosity of sample may lead to high transferring resistance for the reactants, resulting in relatively long capture time for targeting adducts by the magnetic conjugates. On the other hand, we have investigated the reaction time for the recognition of OP-AChE by QD-Ab2 labels, with the data manifested in Figure 7 (curve b). One can observe that the SWV responses may show no increase after 30-min reaction. That is, the immunoreaction time of 30 min may be enough for the recognition between the analytes and QD-Ab2 labels, which is thereby recommended as the secondary recognition time of OP-AChE in the immunoassays.
Figure 7.
The reaction time dependences of SWV responses of immunoassays on (a) magnetic capture and (b) selective recognition using MP-Ab1 conjugates and QD-Ab2 labels, respectively, under the experimental conditions as described in Figure 4, except for different reaction times of magnetic capture and selective recognition. Each point refers to the average of triplicate experiments
Analytical characteristics of SWV immunoassays
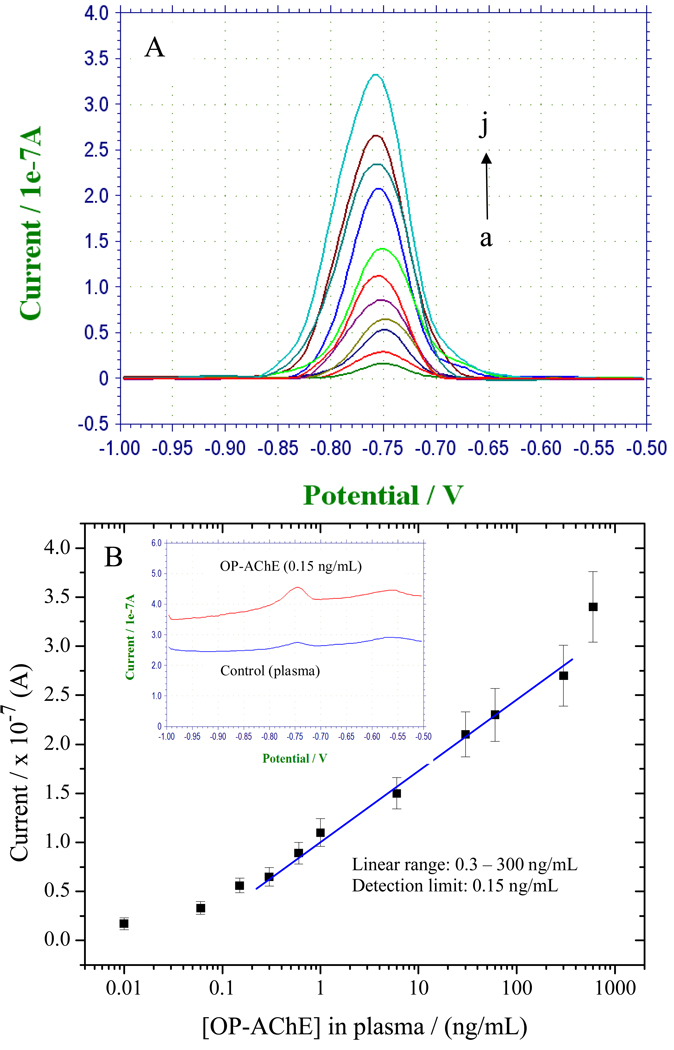
To further verify the application feasibility of the developed immunoassay, OP-AChE with different plasma concentrations were probed under the optimal experimental conditions. Figure 8 A displays typical characteristics of electrochemical SWV responses for increasing OP-AChE concentrations in plasma (curve a-j is from 0.01 to 600 ng/mL). Well-defined voltammetric peaks of cadmium were observed at −0.76 V, and the peak current intensities increase with increasing OP-AChE concentrations. Figure 8 B exhibits the resulting calibration curve between current versus [OP-AChE] plotted on a semi-log scale. As is shown in Figure 8 B, linear responses are obtained over the concentration range of 0.3 – 300 ng/mL OP-AChE with a detection limit of 0.15 ng/mL, as estimated by the “S/N = 3” rule. The top inset of Figure 8 B manifests a big difference between the “as-received” SWV responses to 0.15-ng/mL and 0-ng/mL (control) of OP-AChE. A trivially low current signal was observed in the control. Such a noise-depressed behavior is ascribed to the utilization of the BSA-PEG blocking agent as mentioned above. Moreover, a series of measurements of 300-ng/mL OP-AChE in plasma could yield reproducible electrochemical SWV responses with an RSD of 11.5 %, indicating that the sensitive and selective response of the magnet-aided immunoassays can be accompanied with favorable detection reproducibility.
Figure 8.
(A) Typical electrochemical SWV responses of the immunoassays for OP-AChE with increasing plasma concentrations under the optimized conditions, where curve a–j correspond to 0.01, 0.06, 0.15, 0.3, 0.6, 1.0, 6, 30, 60, 300 and 600 ng/mL of OP-AChE in plasma, respectively; (B) The resulting calibration curve plotted on a semi-log scale, where the inset shows comparably the SWV responses to the detection limit of 0.15 ng/mL and 0 ng/mL(control plasma) of OP-AChE
This work aims at bio-monitoring of low-dose OP exposures, which are defined as < 15% inhibition of plasma cholinesterase at which the victims will not show acute symptoms but may have a harmful biological effect. Since the average AChE level in human plasma is around 8.0 ng / mL,46 the OP-AChE level in human plasma is estimated to be around 1.2 ng/mL for the victims of low-dose OP exposures. Accordingly, the developed immunoassay can have enough sensitivity for bio-monitoring of low-dose exposure to OPs, and holds great promise for analyzing real samples in clinic.
Conclusions
The current evaluation methods of potential exposures to nerve agents and pesticides are generally established by quantifying free OPs or their metabolites or cholinesterase activities, which may in a way have some intrinsic disadvantages. In this paper, a new electrochemical immunoassay method has been developed to assess the formation of phosphorylated AChE. This immunoassay protocol incorporates magnetic separation with QD-based electrochemical SWV analysis. It possesses some merits over the common methods for biological monitoring of OP exposure. First, two different antibodies with high immuno-affinities to the phosphoserine moieties and antigenic AChE, respectively, were employed in a synergetic way, achieving specific recognition of the formidable enzyme adducts towards selective quantification; Second, the enzyme adducts were reductively unfolded by DDT so as to maximize the exposure of their phosphoserine moieties, resulting in enhanced immuno-recognitions; Third, use of magnetic separation for capturing OP-AChE can largely avoid the interferences from the complex sample matrixes, facilitating the direct analysis of phosphorylated AChE in plasma without complex purification steps; Forth, metal ion-based SWV measurements using QDs as signal-amplifying tags could ultra-sensitively probe the enzyme adducts with plasma concentration as low as 0.15 ng/mL, which is comparable to that of mass spectrometric analysis for phosphylated butyrylcholinesterase in human serum;16 Fifth, introduction of the BSA-PEG blocking agent with protein-repelling behavior can significantly minimize nonspecific adsorptions in the immunoassays, making a selective and sensitive immunoassay for OP-AChE; Finally, the utilities of the new immunoassay may include centrifuge tubes, Biomagnetic processing platform, and disposable SPEs, which are truly portable, cheap, and especially convenient for field bio-monitoring and point-of-care diagnosis of OP exposures, if additionally coupled with a miniaturized electrochemical analyzer. Overall, this new electrochemical immunoassay is demonstrated to be a simple, selective, sensitive and field-deployable alternative tool for bio-monitoring and diagnosis of OP exposures to nerve-agents and pesticides. Such kind of detection format may pave the way towards the development of immunoassays for other formidable biomarkers, such as phosphated or nitrated proteins, with low exposure levels in complex biological systems.
Acknowledgements
This work is supported by the National Institutes of Health Counter ACT Program through the National Institute of Neurological Disorders and Stroke (award U01 NS058161) and partially by CDC/NIOSH Grant R01 OH008173. Its contents are solely the responsibility of the authors and do not necessarily represent the official views of the federal government. The research described in this paper was performed at the Environmental Molecular Sciences Laboratory, a national scientific user facility sponsored by DOE’s Office of Biological and Environmental Research and located at Pacific Northwest National Laboratory, which is operated by Battelle for DOE under Contract DE-AC05-76RL01830.
References
- 1.Young S, Balluz L, Malilay J. Sci. Total Environ. 2004;322:3–20. doi: 10.1016/S0048-9697(03)00446-7. [DOI] [PubMed] [Google Scholar]
- 2.Hendrickson RG, Hedges JR. Criti. Care Clin. 2005;21:641–652. doi: 10.1016/j.ccc.2005.05.009. [DOI] [PubMed] [Google Scholar]
- 3.Noort D, Benschop HP, Black RM. Toxicol. Appl. Pharm. 2002;184:116–126. [PubMed] [Google Scholar]
- 4.Noort D, Fidder A, van der Schans MJ, Hulst AG. Anal. Chem. 2006;78:6640–6644. doi: 10.1021/ac060954t. [DOI] [PubMed] [Google Scholar]
- 5.Worek F, Koller M, Thiermann H, Szinicz L. Toxicology. 2005;214:182–189. doi: 10.1016/j.tox.2005.06.012. [DOI] [PubMed] [Google Scholar]
- 6.Tu AT. Toxin Rev. 2007;26:231–274. [Google Scholar]
- 7.Black RM, Read RW. Toxin Rev. 2007;26:275–298. [Google Scholar]
- 8.He FS. Toxicol. Lett. 1999;108:277–283. doi: 10.1016/s0378-4274(99)00099-5. [DOI] [PubMed] [Google Scholar]
- 9.He FS, Chen SY, Tang XY, Gan WQ, Tao BG, Wen BY. Toxicol. Lett. 2002;134:119–124. doi: 10.1016/s0378-4274(02)00180-7. [DOI] [PubMed] [Google Scholar]
- 10.Cocker J, Mason HJ, Garfitt SJ, Jones K. Toxicol. Lett. 2002;134:97–103. doi: 10.1016/s0378-4274(02)00168-6. [DOI] [PubMed] [Google Scholar]
- 11.Margariti MG, Tsakalof AK, Tsatsakis AM. Thera. Drug Monit. 2007;29:150–163. doi: 10.1097/FTD.0b013e31803d3509. [DOI] [PubMed] [Google Scholar]
- 12.Wessels D, Barr DB, Mendola P. Environ. Health Persp. 2003;111:1939–1946. doi: 10.1289/ehp.6179. [DOI] [PMC free article] [PubMed] [Google Scholar]
- 13.Ellman GL, Courtney KD, Andres V, Featherstone RM. Biochem. Pharmacol. 1961;7 doi: 10.1016/0006-2952(61)90145-9. 88-&. [DOI] [PubMed] [Google Scholar]
- 14.Eyer P, Worek F, Kiderlen D, Sinko G, Stuglin A, Simeon-Rudolf V, Reiner E. Anal. Biochem. 2003;312:224–227. doi: 10.1016/s0003-2697(02)00506-7. [DOI] [PubMed] [Google Scholar]
- 15.Read RW, Black RM. J. Chromatogr. A. 1999;862:169–177. doi: 10.1016/s0021-9673(99)00944-9. [DOI] [PubMed] [Google Scholar]
- 16.Fidder A, Hulst AG, Noort D, de Ruiter R, van der Schans MJ, Benschop HP, Langenberg JP. Chem. Res. Toxicol. 2002;15:582–590. doi: 10.1021/tx0101806. [DOI] [PubMed] [Google Scholar]
- 17.Polhuijs M, Langenberg JP, Benschop HP. Toxicol. Appl. Pharm. 1997;146:156–161. doi: 10.1006/taap.1997.8243. [DOI] [PubMed] [Google Scholar]
- 18.Liu GD, Riechers SL, Timchalk C, Lin YH. Electrochem. Commun. 2005;7:1463–1470. [Google Scholar]
- 19.Simonian AL, Good TA, Wang SS, Wild JR. Anal. Chim. Acta. 2005;534:69–77. [Google Scholar]
- 20.Evtugyn GA, Budnikov HC, Nikolskaya EB. Talanta. 1998;46:465–484. doi: 10.1016/s0039-9140(97)00313-5. [DOI] [PubMed] [Google Scholar]
- 21.a Liu G, Wu H, Dohnalkova A, Lin Y. Anal. Chem. 2007;79:5614–5619. doi: 10.1021/ac070086f. [DOI] [PubMed] [Google Scholar]; b Liu G, Wang J, Wu H, Lin Y. Anal. Chem. 2006;78:7417–7423. doi: 10.1021/ac060653j. [DOI] [PubMed] [Google Scholar]
- 22.Pumera M, Sanchez S, Ichinose I, Tang J. Sens. Actuators B. 2007;123:1195–1205. [Google Scholar]
- 23.a Liu G, Lin Y. Talanta. 2007;74:308–317. doi: 10.1016/j.talanta.2007.10.014. [DOI] [PMC free article] [PubMed] [Google Scholar]; b Liu G, Lin Y. J. Am. Chem. Soc. 2007;129:10394–10401. doi: 10.1021/ja070429r. [DOI] [PubMed] [Google Scholar]
- 24.Wang J, Liu GD, Wu H, Lin YH. Small. 2008;4:82–86. doi: 10.1002/smll.200700459. [DOI] [PubMed] [Google Scholar]
- 25.Wang J. Analyst. 2005;130:421–426. doi: 10.1039/b414248a. [DOI] [PubMed] [Google Scholar]
- 26.Schulze H, Schmid RD, Bachmann TT. Anal. Chem. 2004;76:1720–1725. doi: 10.1021/ac035218t. [DOI] [PubMed] [Google Scholar]
- 27.Cousino MA, Jarbawi TB, Halsall HB, Heineman WR. Anal. Chem. 1997;69:A544–A549. doi: 10.1021/ac9717651. [DOI] [PubMed] [Google Scholar]
- 28.Mileson BE, Chambers JE, Chen WL, Dettbarn W, Ehrich M, Eldefrawi AT, Gaylor DW, Hamernik K, Hodgson E, Karczmar AG, Padilla S, Pope CN, Richardson RJ, Saunders DR, Sheets LP, Sultatos LG, Wallace KB. Toxicol. Sci. 1998;41:8–20. doi: 10.1006/toxs.1997.2431. [DOI] [PubMed] [Google Scholar]
- 29.Kwong TC. Ther. Drug Monit. 2002;24:144–149. doi: 10.1097/00007691-200202000-00022. [DOI] [PubMed] [Google Scholar]
- 30.George KM, Schule T, Sandoval LE, Jennings LL, Taylor P, Thompson CM. J. Biol. Chem. 2003;278:45512–45518. doi: 10.1074/jbc.M304781200. [DOI] [PubMed] [Google Scholar]
- 31.Hu SQ, Xie JW, Xu QH, Rong KT, Shen GL, Yu RQ. Talanta. 2003;61:769–777. doi: 10.1016/S0039-9140(03)00368-0. [DOI] [PubMed] [Google Scholar]
- 32.Miller JK, Lenz DE. J. Appl. Toxicol. 2001;21:S23–S26. doi: 10.1002/jat.801. [DOI] [PubMed] [Google Scholar]
- 33.Brimfield AA, Lenz DE, Graham C, Hunter KW. J. Agric. Food. Chem. 1985;33:1237–1242. [Google Scholar]
- 34.Taylor P, Lappi S. Biochemistry. 1975;14:1989–1997. doi: 10.1021/bi00680a029. [DOI] [PubMed] [Google Scholar]
- 35.Kousba AA, Sultatos LG, Poet TS, Timchalk C. Toxicological Sciences. 2004;80:239–248. doi: 10.1093/toxsci/kfh163. [DOI] [PubMed] [Google Scholar]
- 36.Sussman JL, Harel M, Frolow F, Oefner C, Goldman A, Toker L, Silman I. Science. 1991;253:872–879. doi: 10.1126/science.1678899. [DOI] [PubMed] [Google Scholar]
- 37.Macpheequigley K, Vedvick TS, Taylor P, Taylor SS. Journal of Biological Chemistry. 1986;261:3565–3570. [Google Scholar]
- 38.Lockridge O, Eckerson HW, Ladu BN. Journal of Biological Chemistry. 1979;254:8324–8330. [PubMed] [Google Scholar]
- 39.Sharma S, Johnson RW, Desai TA. Langmuir. 2004;20:348–356. doi: 10.1021/la034753l. [DOI] [PubMed] [Google Scholar]
- 40.Lee JH, Lee HB, Andrade JD. Prog. Polym. Sci. 1995;20:1043–1079. [Google Scholar]
- 41.Matsuya T, Tashiro S, Hoshino N, Shibata N, Nagasaki Y, Kataoka K. Anal. Chem. 2003;75:6124–6132. doi: 10.1021/ac034346e. [DOI] [PubMed] [Google Scholar]
- 42.Zdyrko B, Varshney SK, Luzinov I. Langmuir. 2004;20:6727–6735. doi: 10.1021/la049359h. [DOI] [PubMed] [Google Scholar]
- 43.Wang H, Lei CX, Li JS, Wu ZY, Shen GL, Yu RQ. Biosens. Bioelectron. 2004;19:701–709. doi: 10.1016/s0956-5663(03)00265-3. [DOI] [PubMed] [Google Scholar]
- 44.Wang H, Zhang Y, Yan B, Liu L, Wang SP, Shen GL, Yu RQ. Clin. Chem. 2006;52:2065–2071. doi: 10.1373/clinchem.2006.071555. [DOI] [PubMed] [Google Scholar]
- 45.Holownia P, Perez-Amodio S, Price CP. Anal. Chem. 2001;73:3426–3431. doi: 10.1021/ac001530g. [DOI] [PubMed] [Google Scholar]
- 46.Brimijoin S, Hammond P. Journal of Neurochemistry. 1988;51:1227–1231. doi: 10.1111/j.1471-4159.1988.tb03091.x. [DOI] [PubMed] [Google Scholar]


