Abstract
Microbeads are frequently used as a solid support for biomolecules such as proteins and nucleic acids in heterogeneous microfluidic assays. However, relatively few studies investigate the binding kinetics on modified bead surfaces in a microfluidics context. In this study, a customized hot embossing technique is used to stamp microwells in a thin plastic substrate where streptavidin-coated agarose beads are selectively placed and subsequently immobilized within a conduit. Biotinylated quantum dots are used as a label to monitor target analyte binding to the bead's surface. Three-dimensional finite element simulations are carried out to model the binding kinetics on the bead's surface. The model accounts for surface exclusion effects resulting from a single quantum dot occluding multiple receptor sites. The theoretical predictions are compared and favorably agree with experimental observations. The theoretical simulations provide a useful tool to predict how varying parameters affect microbead reaction kinetics and sensor performance. This study enhances our understanding of bead-based microfluidic assays and provides a design tool for developers of point-of-care, lab-on-chip devices for medical diagnosis, food and water quality inspection, and environmental monitoring.
Keywords: biosensors, microfluidics, agarose beads, numerical simulation
1. Introduction
Immobilized biomolecules, such as proteins and nucleic acids, in microfluidic and lab-on-chip devices are often used to capture target analytes from a biological sample and facilitate, among other things, medical diagnosis, food and water quality inspection, environmental monitoring, and separation and purification. Immunoassay-based techniques are of particular importance due to their high specificity for biomolecular targets, allowing the separation of analytes of interest from complex biological mixtures. The integration of immunoaffinity analytical systems in microfluidic devices provides enhanced reaction efficiency, reduced sample and reagent consumption, and lower costs [1, 2]. Furthermore, the development of these portable, disposable, and rapid devices that can be operated by minimally trained personnel may offer relatively sophisticated laboratory capabilities at the point-of-care, at home, and in resource poor regions.
The integration of bead-based immunoaffinity assays into microfluidic chips is currently an area of growing interest [3, 4]. Microbeads offer several advantages over traditional, planar technologies as a platform to immobilize biomolecules, including large surface areas to support reactions (increasing sensitivity), the availability of a library of pre-functionalized (pre-coated with biomolecules) bead types from many vendors, and the ability to be assembled into arrays that test for multiple analytes simultaneously (multiplexing) [3]. Several recent studies have demonstrated the power of bead-based immunoassays in improving detection sensitivity and reducing assay times. Antibody-coated agarose microbeads localized in micromachined cavities on a silicon wafer chip enabled simultaneous detection of cardiac risk factors C-reactive protein and Interleukin-6 in human serum samples [5]. Significantly reduced antigen-antibody reaction times of less than 1 hour were achieved in a microchip using dam-immobilized, antibody-coated polystyrene microbeads to detect human secretory immunoglobulin A [6], carcinoembryonic antigen [7], and interferon-gamma [8]. More recently, chip-immobilized, antigen-coated magnetic microbeads allowed rapid and sensitive quantification of human serum immunoglobulin G antibodies to Helicobacter pylori [9].
A few studies have examined the binding kinetics of several types of biomolecules to functionalized, micron-sized, bead surfaces. These include the binding of (i) biotinylated DNA [10, 11] and fluorescein biotin [12] to streptavidin-coated beads, (ii) biotinylated horseradish peroxidase to avidin-coated beads [13], (iii) glutathione S-transferase (GST) to anti-GST antibody-coated beads [14], and (iv) proteins to aptamer-coated beads [15], as well as (v) the hybridization of target DNA to complementary DNA immobilized on beads [16, 17]. Although good knowledge of binding kinetics on bead surfaces is critical for effective implementation of microbead technology, such as bead-based immunoaffinity assays, there are just a few systematic studies addressing this issue [3].
With the maturation of lab-on-chip systems, polymers have become a popular choice for device fabrication because they are inexpensive; amenable to various bonding techniques; exhibit good optical properties; are machinable by a variety of methods such as milling, injection molding, and hot embossing; facilitate monolithic production; and eliminate the need for packaging. We fabricated a single-use (disposable) microfluidic flow cell containing a 2×2 array of agarose beads immobilized in a conduit made with an adhesive membrane sandwiched between two pieces of cyclic olefin copolymer (COC). Agarose beads are a common support for protein detection, DNA hybridization, and affinity chromatography [18-21]. COC was selected because of its high transparency, optical clarity, and low autofluorescence [22, 23]. Autofluorescence is unwanted background fluorescence that can interfere with signal readings of captured analytes and adversely affect limits of detection [24].
Although several other elegant approaches exist to capture beads in either a packed bed [3, 6, 25-27] or an array format [4, 28-32] in a microfluidic device, we used hot embossing to form wells in the COC substrate. Hot embossing is a convenient and repeatable way to rapidly stamp microfeatures in polymers using a prefabricated, multiuse master [33, 34]. This simple approach is advantageous because it enables the deliberate placement of beads with predetermined functionalizations at desired locations. In our device, we stamped an array to accommodate four beads; however, the concept can be readily extended to any number of beads.
For our experiments, we used a model system comprised of a biotinylated fluorescent label and streptavidin-coated agarose beads. The biotin-streptavidin system was selected because of its simplicity and frequent use in bead-based assays [25, 26, 35]. The experimental concepts, however, are also applicable to other biological systems such as sandwich assays for antigen-antibody interactions [36]. In the array, we used “test” beads covalently conjugated with the tetrameric protein streptavidin (MW = 52.8 kDa). Streptavidin binds very tightly to the vitamin biotin (MW = 244 Da). As a result, streptavidin-biotin linkages are routinely employed in many biosensing assays. As the model target analyte, we used biotin-conjugated quantum dots (10-12 nm in diameter). Quantum dots are inherently brighter than other common fluorophores, are highly stable against photobleaching, and are often used in microbead assays [37-41]. To assess undesirable, non-specific binding of the target analyte to the agarose matrix, several control tests were performed with plain agarose “control” beads.
To further understand our miniaturized microbead system, we performed three-dimensional numerical simulations to model the binding of analyte to a bead immobilized in a microfluidic channel. Although several prior modeling studies of heterogeneous microfluidic assays examined the effect of channel geometry, flow rate, binding rate constants, concentration, and volume and time constraints on analyte capture efficiency [42-46], they dealt with planar geometries and were restricted to two dimensions. This simplification is not appropriate for three-dimensional, immobilized bead systems.
2. Materials and methods
2.1 Experiments
To hot emboss microwells in the COC, a master containing four protruding pins was fabricated in silicon using standard photolithography techniques. Microposit S1827 positive photoresist (Rohm and Haas, Philadelphia, PA) was coated on a 3-inch silicon wafer. The resist was patterned in a Karl Suss MA-4 mask aligner (SUSS MicroTec Inc., Waterbury Center, VT) using a chrome/glass photomask, and developed in Microposit MF319 Developer (Rohm and Haas). Following a post-bake, with the resist serving as the etch mask, the silicon was plasma-etched with a gas mixture of SF6 and O2 (PlanarEtch II plasma machine, Technics Inc., San Jose, CA) to form the pin array. Finally the remaining resist was removed with Microposit Remover 1165 resist stripper (Rohm and Haas). The pitch of the array was 250 ± 0.6 μm. The pins were 44 ± 1 μm tall, and the pin's diameter varied from approximately 60 μm at the top to 80 μm at the base as a result of the etching process.
Following fabrication, the master was epoxy-bonded to a small aluminum block to increase its rigidity and prevent fracture during embossing. An inexpensive, custom-built embossing set-up was made by placing the master and COC substrate on a small hotplate (Isotemp, Fisher Scientific, Pittsburgh, PA) mounted under an upright, vertical microscope stage. The microscope's objectives were removed and replaced with a flat block of aluminum that served as an upper stamping surface. Downward pressure was applied at an embossing temperature of 200 °C by turning the knob mounted on the stage and lowering the head to the heated surface. After stamping, the master and substrate were removed from the hotplate and allowed to cool at room temperature.
We selected a thin (100 μm) substrate (donated by Plitek LLC, Des Plaines, IL) for the microwells to minimize background fluorescence, which decreases as the thickness of the plastic decreases [47]. A slightly tapered conduit shape to guide the sample over the bead array was laser cut in a piece of 50 μm thick, double-sided adhesive membrane (donated by Carolina Tape and Supply Corporation, Hickory, NC). The taper minimized entrapment of air bubbles. Subsequent to embossing and applying the membrane, the wells were loaded with beads. As opposed to random assembly, where beads randomly fill wells and an encoding step is necessary to identify the location of each bead type [4, 28, 30, 48], our technique consisted of capturing a bead of known functionalization with a micropipette, maneuvering the micropipette with a micromanipulator (MMN-1, Narishige, Tokyo, Japan), and placing the bead in a designated well. This process is amenable to automation [49].
To install the beads, a 5 μL aliquot of streptavidin agarose beads (wet diameter range of 27-200 μm with average diameter of ∼89 μm [50]; 6 % crosslinked agarose support from Pierce Biotechnology, Rockford, IL) was diluted twofold with deionized water and allowed to dry at room temperature. In some experiments, plain agarose beads (Sepharose CL-6B, Sigma-Aldrich, St. Louis, MO) were also implemented as a control. Subsequently, under magnification, appropriately sized dry beads were selected (∼50 μm diameter) and placed in the wells. The size of the dry bead was chosen so that the top of the bead only slightly protruded above the top of the well, which prevented the bead from being disturbed when sealing the flow cell with a second piece of 100 μm thick COC containing inlet and outlet ports.
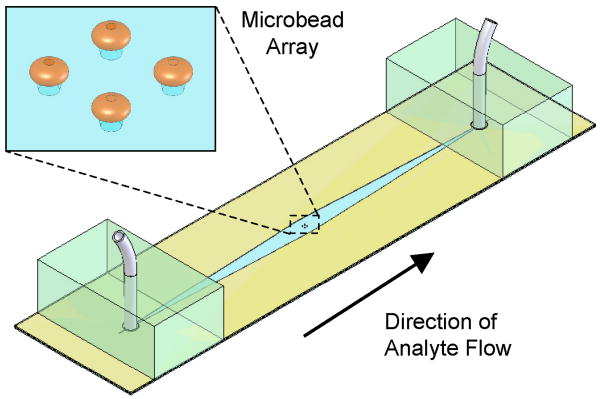
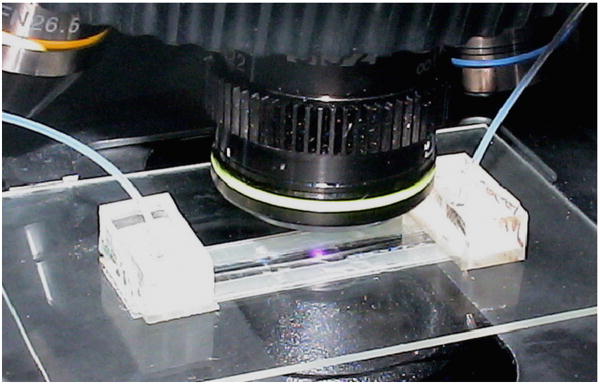
At the start of an experiment, quantum dot solution (QDot 605, emission maximum at 605 nm, Invitrogen, Carlsbad, CA) was flown over the beads and the beads rapidly expanded and firmly pushed against the top of the conduit, effectively getting locked in place. Though the expansion was considerable (e.g. a dry bead of 50 μm diameter expanded to ∼125 μm upon hydration), the reversible process did not adversely affect bead functionality [29]. Confocal microscope imaging revealed that the beads' shapes resembled oblate spheroids. Fig. 1 provides a schematic diagram of the chip assembly. The inlet tube on the left is fixed in place with a small PDMS block and connected to a programmable syringe pump (PHD 2000, Harvard Apparatus, Holliston, MA); the outlet tube goes to a drain. The device was monitored with an epifluorescence microscope (BX51, Olympus Corporation, Melville, NY) equipped with a CCD camera (pco1600, The Cooke Corporation, Romulus, MI), 100 W mercury discharge lamp, and 11001v2 long pass filter (ex: 470 nm, em: > 515 nm, Chroma Technology Corporation, Rockingham, VT). Fig. 2 is a photograph of a flow cell mounted on the microscope stage.
Figure 1.
A schematic depiction of the experimental flow cell containing inlet and outlet ports and a 2×2 microbead array.
Figure 2.
A photograph of the flow cell shown in Fig. 1 mounted on the stage of an epifluorescent microscope.
After sample introduction and focusing the microscope at the equator of the beads, fluorescent images were acquired in real time (200× magnification, 10-25 ms exposure time) with Cooke Camware image processing software. Image analysis and intensity measurements were performed with Wright Cell Imaging Facility (WCIF) ImageJ version 1.37a (National Institutes of Health, Bethesda, MD).
A continuous, steady flow rate of ∼0.1 μL min-1 (corresponding to a mean fluid velocity in the vicinity of the beads of ∼25 μm s-1) was maintained throughout the experiment. To study dissociation kinetics, the analyte-filled syringe was replaced with a buffer-filled syringe, and flow was continued at the above flow rate.
2.2 Mathematical modeling and numerical method
To compare experimental results with theoretical predictions, we simulated the process with a three-dimensional, finite element, multi-physics program (COMSOL™ Multiphysics 3.4, COMSOL AB, Stockholm, Sweden). The objective was to test the feasibility of using computer simulations as a reliable predictor and design tool to assist developers of bead arrays. To save computer time and because the beads were placed sufficiently far apart from each other and the conduit side walls such that all the beads experienced similar flow conditions, a single compressed bead was modeled in the flow cell. The lack of interaction between the beads was confirmed experimentally. Similar simulations can, however, be carried out for multiple beads. Fig. 3 illustrates the model and the interaction kinetics at the bead's surface. The symbol “X” and the solid circles represent, respectively, the streptavidin and the biotin-QDot complexes. k̃a (M-1 s-1) and k̃d (s-1) are, respectively, the forward (association) and reverse (dissociation) reaction rate constants. Although we simulate a biotin-streptavidin system here, similar procedures can be extended to model antigen-antibody interactions at the bead's surface.
Figure 3.
A schematic diagram of the kinetic reaction at the microbead's surface. Biotinylated quantum dots bind to bead-immobilized streptavidin.
Our mathematical model is similar to previously studied models for ligands immobilized on flat surfaces [42-46]. The twists here are the presence of a curved, three-dimensional surface and the inclusion of surface exclusion (steric hindrance) effects. Although agarose is a porous material, we focus here only on surface reactions. In other words, we replace the complex structure and kinetics occurring inside the bead with reactions at the bead's surface. The implications of this simplification will be discussed later in the paper. We compute the velocity field by solving the dimensionless, steady-state Navier-Stokes equation
| (1) |
In the above, all variables are dimensionless. In what follows, quantities with and without a superscript tilde denote, respectively, dimensional and dimensionless variables. is the Reynolds number; ρ̃ is density (kg m-3); Ũ is the average fluid velocity in the conduit (m s-1); H̃ and W̃ are, respectively, the conduit's height and width; μ̃ is the fluid viscosity (kg m-1s-1); P is the pressure (Pa); and is the velocity vector. H̃, Ũ, and μ̃Ũ/H̃ are, respectively, the length, velocity, and pressure scales. We use the Cartesian coordinate system {x, y, z} with its origin at the bead's center. The coordinates and are within the conduit's cross-section that is transverse to the flow direction, and the x coordinate is aligned with the conduit's axis. w(x) = wo − w1 |x|, where − xo ≤ x ≤ xo, defines the width of the conduit's taper. In our simulations, wo = 3.75, xo = 2.41, and w1 = 0.10.
We apply non-slip velocity boundary conditions at all solid boundaries. Since w1 ≪ 1, we utilize the lubrication approximation to specify the inlet velocity distribution [51]:
| (2) |
The outlet of the conduit is open to the atmosphere (outflow boundary condition).
The size of the computational domain was determined as a compromise between precision and computational cost. The inlet and outlet boundary conditions were specified, respectively, at − xo and xo.
The dimensionless convection-diffusion equation is
| (3) |
where is the Peclet number; C̃ is the analyte concentration in the chamber (M); C̃o is the inlet analyte concentration (M); t̃ is time (s); and D̃ is the analyte diffusivity (m2 s-1). H̃2 / D̃ is the time scale and C̃o is the analyte scale.
Since the walls of the chamber are impermeable and do not interact with the analyte, we specify along all solid surfaces ∇C • n̂ = 0, where n̂ is a unit vector normal to the surface. The inlet condition consists of a uniform concentration, C̃ (−xo,y,z,t) = C̃o. At the downstream end of the computational domain, we specify the outflow boundary condition, . The outlet condition is specified far enough downstream to have little or no effect on the surface reactions taking place on the bead's surface [42].
The reaction between the suspended target analyte and the immobilized ligand takes place on the outer surface of the bead. The reaction rate is assumed to be proportional to the product of the concentration of the analyte next to the bead's surface (Cbs) and the concentration of available binding sites on the bead surface,
| (4) |
where is the instantaneous surface concentration of the bound complex; R̃T is the concentration of the immobilized receptor sites on the bead (M m); and C̃bs is the analyte concentration next to the bead's surface (M). is the Damkohler number and (M-1) is the affinity constant.
The binding rate must be balanced by the diffusive flux at the bead's surface:
| (5) |
The quantity (1−B) in Equation 4 represents the number of unbound receptor sites. This expression does not account, however, for the fact that a large adsorbed particle, such as a quantum dot, occludes multiple receptor sites. In other words, surface exclusion effects are not accounted for in Equation 4. Exclusion effects of hard spheres on a surface have been investigated by several authors, and the results of their studies [52-56] are utilized here. We represent steric hindrance with the available surface function Φ(θ), where θ is the surface coverage (the ratio of the area covered by quantum dots and the total bead's surface area available for binding prior to the initiation of the binding process). Φ(θ) represents the probability of a binding event when the surface coverage is θ. Φ(0) = 1. As surface coverage increases, the area left available for binding and Φ(θ) decrease. Thus, 0 ≤ Φ(θ) ≤ 1.
For a Random Sequential Adsorption (RSA) process, where particles randomly and irreversibly bind to a solid surface with no overlap, the maximum obtainable surface coverage θmax for hard spheres has been determined experimentally [54] and via computer simulations [55] to be ∼0.55. θmax is also ∼0.55 when dissociation is very slow (such as in the case of a biotin-streptavidin system). An interpolating formula for Φ(θ) is available [52].
| (6) |
where . The modified form of Equation 4 that accounts for surface exclusion is
| (7) |
For our quantum dot and agarose bead system, is the projected area of a quantum dot, d̃QD is the effective diameter of the quantum dot, and is the projected area of a streptavidin molecule on the bead surface. The diameter of a streptavidin molecule (d̃STV) is taken to be ∼5 nm [57]. The factor ¼ is included in the expression for θ because a single streptavidin molecule has four binding sites.
The time-dependent reaction (Equation 7) was implemented as a weak form boundary condition in COMSOL™. Equations 3, 5, and 7 were solved concurrently using a transient solver and the previously stored fluid flow field. Binding curves of B as a function of time were generated using boundary integration at the completion of computations.
The computer code was verified by ascertaining that grid refinement and increases in the length of the computational domain (2x0) did not lead to significant variations in the computational results. Furthermore, simulations with artificially very large diffusion coefficients reproduced results predicted by a well-mixed model.
3. Results and discussion
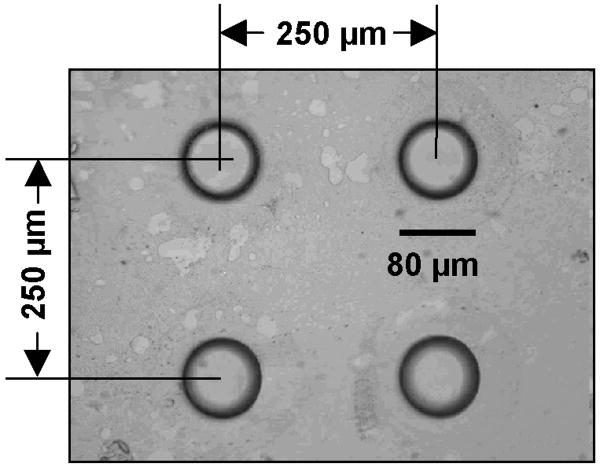
Our ability to repeatedly load wells with beads and perform binding experiments required a reproducible set of COC substrates. This set was fabricated using custom-made hot embossing tools. For example, Fig. 4 depicts an embossed well array in a COC substrate. The wells were tapered, and they ranged in diameter from 60 (bottom) to 80 (top) ± 2 μm and had a depth of 44 ± 4 μm. The tolerance of the distance between the well centers was a fraction of a micron. Following chip assembly and the onset of flow, the beads hydrated, swelled, and jammed against the top cover of the conduit (Fig. 3).
Figure 4.
Micrograph image of hot embossed microwells in a COC substrate. Typical tolerances for the stamped wells are ± 2 μm in diameter and ± 4 μm in depth.
To better understand how an expanded bead conformed to the conduit geometry, we took fluorescent images of a bead partially covered with quantum dots (Fig. 5). With the camera focused on the top surface of the bead (Fig. 5a, microscope magnification 400×), the bright equator of the bead appears blurry in this image because it is away from the focal plane. Figs. 5b (1800×) and 5c (3600×) are, respectively, magnified images of the framed regions in Fig. 5a and 5b. The dark circular region at the center of the bead (Figs. 5b and 5c) illustrates where the apex of the bead presses against the top surface of the conduit and is not easily accessible for binding. Fig. 5c is sufficiently magnified to allow one to observe individual quantum dots bound to the bead's surface. Fig. 5 indicates that only a small portion of the bead surface is not directly exposed to the flow and that the agarose bead and the COC generate little or no background emission.
Figure 5.
Micrograph fluorescent images of quantum dots surrounding a dark circular region of a hydrated bead pressed firmly against the top of the chamber. (a) The camera focused at the top of the bead. (b) A magnified image of the region enclosed in the framed region in (a). (c) A magnified image of the framed region in (b).
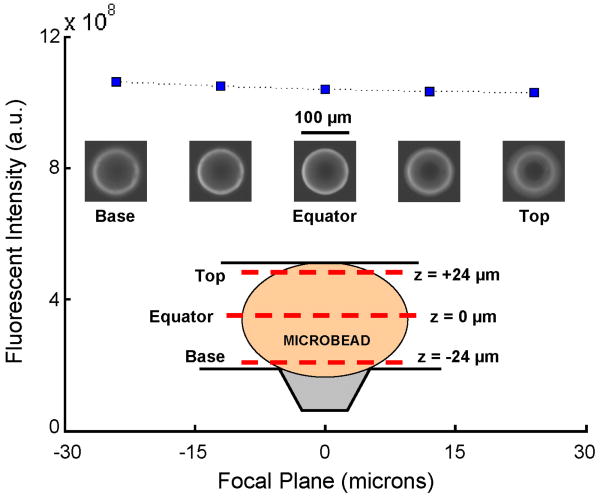
Fig. 6 (200× magnification for inset micrographs) depicts the intensity of the fluorescent emission from an agarose bead decorated with quantum dots as a function of focal plane position, -24 μm ≤ z̃ ≤ 24 μm (z̃ = 0 is the bead's equator). The conduit spans the range |z̃| ≤ 25 μm. The fluorescent intensity was obtained by integrating camera images in ImageJ over the region x̃2 + ỹ2 < a2, where radius a = 60 μm. The experiments indicate that the integrated intensity is nearly independent of focal plane position along the bead's height. In other words, the objective's field of view is sufficiently large to collect light from the entire height of the conduit. Witness the transparency of the agarose bead to the fluorescent light.
Figure 6.
Measured fluorescent intensity with corresponding micrographs of a bead with bound quantum dots as a function of focal plane position. Intensity was measured for five ascending focal planes from the base of the bead (z = -24 μm), through the equator (z = 0), to the top of the bead (z = +24 μm). The dashed line through the data points is added for clarity and to illustrate that the integrated fluorescent intensity is nearly independent of the choice of focal plane.
Researchers have previously taken advantage of agarose bead transparency [29, 58] to study, for example, the performance of three-dimensional bead microreactors [19]. In our experiments, we utilize the bead's transparency to estimate the number of quantum dots bound to the compressed bead. To this end, we integrated the fluorescent intensity emitted from an equilibrated bead (Ib) and from the adjacent buffer laden with quantum dots of known concentration (Is) and having the same circular cross-sectional area (π a2) as the bead. A bead was deemed equilibrated when its fluorescent intensity binding curve had leveled off and remained constant with time. The number of quantum dots in a cylinder of radius a containing buffer solution is NA C̃0 πa2 H̃, where NA is Avogadro's number. The number of quantum dots attached to the bead is approximately , where Vb is the bead's volume. Repeating the same calculation for three experimental conditions, we estimate that, at equilibrium, there are approximately 27-34 million quantum dots bound to a ∼100 μm diameter bead. In the above, we implicitly assumed that the emission intensity is proportional to the number of quantum dots [37].
In most of our experiments, we included and monitored a control, unfunctionalized, agarose bead in the array. We did not detect any signal from the control beads.
Concurrently with the experiments, we carried out numerical simulations to gain further insight into the binding process. Several techniques were used to approximate the variable values input in the simulation. R̃T was estimated to be 1.7E-9 M m (i.e., ∼1E18 receptor sites per m2) based on the binding capacity data of the streptavidin agarose beads for free biotin provided by the vendor (Pierce). Because of its small size, free biotin is capable of migrating inside the bead and accessing internal binding sites. Hence, the above value of R̃T accounts also for streptavidin conjugated to the interior bead matrix. Here, we use R̃T as a surface quantity. The validity of this approximation was tested by comparing theoretical predictions with experimental data. The quantum dots' diffusion coefficient D̃ was estimated using the Stokes-Einstein equation
| (8) |
where κ̃ is the Boltzmann's constant and T̃ is the absolute temperature of the fluid. At room temperature, D̃ = 3.6E-11 m2 s-1, which agrees well with experimental measurements for quantum dot diffusivity [59]. The value of k̃d used in the simulation was approximated experimentally by fitting an exponential decay of the form c e−k̃dt̃ to the dissociation portion of the binding curves using the MATLAB™ Curve Fitting Toolbox. The parameters c and k̃d were determined during the fitting procedure. Assuming a well-mixed model, an exponential form of decay is expected because when only buffer flows over the beads, Equation 4 reduces to
| (9) |
The value of k̃a was estimated to be 1.6E5 M-1 s-1 based on literature results for the binding of biotinylated DNA to streptavidin-coated polystyrene latex beads [11].
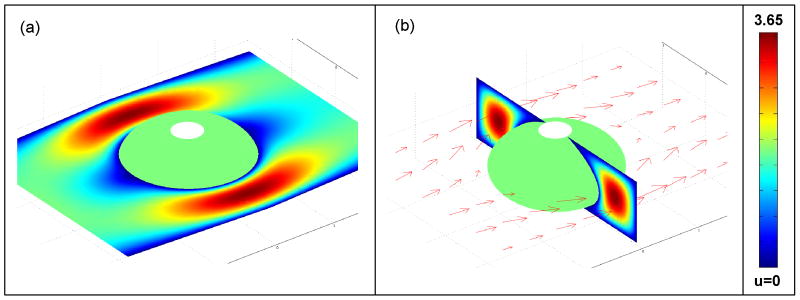
Fig. 7 depicts the flow field around the bead when the Reynolds number Re = 3.7E-4. Figs. 7a and 7b show, respectively, the flow fields at a plane located at the bead's midheight (z = 0) and a plane transverse to the flow direction at x = 0. The colors represent the magnitude of the velocities (||u⃗||), and the arrows correspond to the velocity vectors. Due to the non-slip boundary condition at the bead's surface, the fluid velocity slows down considerably in this vicinity. The velocity profile varies as a function of position around the bead. At the Reynolds numbers encountered in our experiments (Re ≪ 1), there was no separation bubble downstream of the bead. The structure of the flow field impacts the mass transfer of analyte to the bead's surface.
Figure 7.
The computed flow field around an immobilized, compressed bead with a non-slip boundary condition at its surface. (a) Horizontal slice contour plot of velocity magnitude around the bead's midplane. (b) Vertical slice contour plot of velocity magnitude and horizontal arrow plot of the velocity field. The Reynolds number Re = 3.7E-4.
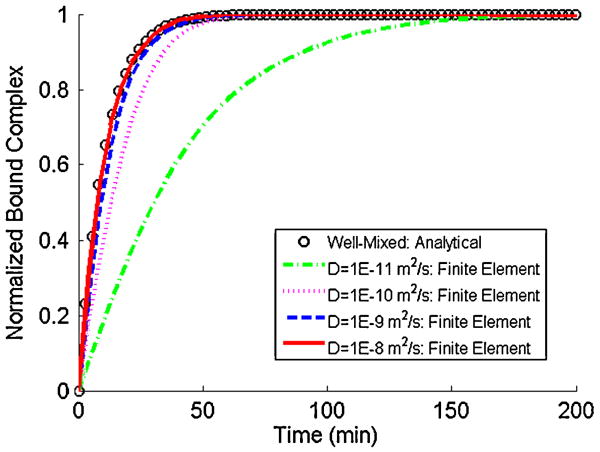
Fig. 8 depicts the predicted total bound complex (the integral of B along the bead's surface) in the absence of surface exclusion effects as a function of time when the analyte diffusion coefficient is 10-11, 10-10, 10-9, and 10-8 m2 s-1. In the above, B is normalized with the equilibrium amount of bound complex. The symbols correspond to the well-mixed case of uniform analyte concentration (C̃(x, y, z,t) = C̃o) throughout the conduit. In the well-mixed case [43],
| (10) |
As D̃ increases, the Damkohler number Da decreases, and the kinetics at the bead's surface becomes progressively more reaction-rate limited. Eventually, this situation mimics the case when C̃ is uniform throughout the entire conduit. This observation is consistent with the results of the numerical simulation. As D̃ increases, the numerical predictions approach the well-mixed case.
Figure 8.
The normalized bound complex on the bead's surface in the absence of surface exclusion effects as a function of time for various values of the diffusion coefficient. The symbols and lines correspond, respectively, to analytical (well-mixed case; Equation 10) and finite element results. C̃o = 10 nM, k̃a = 1.6E5 M-1 s-1, k̃d = 3E-5 s-1, R̃T = 1.5E-11 M m, and Ũ = 1.0E-5 m s-1.
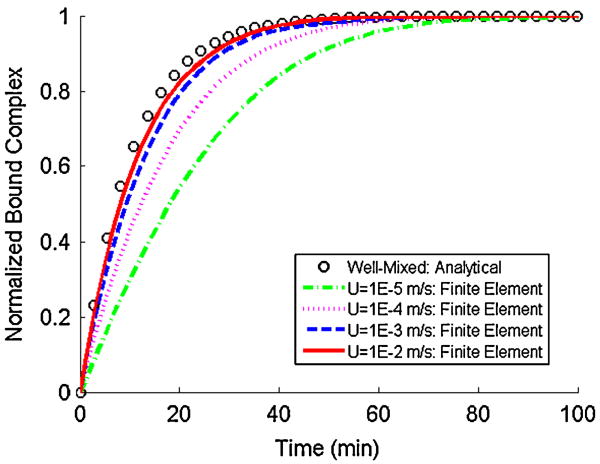
The binding rate can be accelerated not only by increasing D̃, but also by increasing the flow rate. Fig. 9 depicts the normalized bound complex in the absence of surface exclusion effects as a function of time at various flow rates. The symbols correspond to the well-mixed case. D̃ and all other parameters are kept constant in all the simulations in Fig. 9. As the flow rate increases, the Peclet number Pe increases, the quantum dots are efficiently transported to the bead's surface, and we again approximate well-mixed conditions. Figs. 8 and 9 provide yet another verification of the numerical code as the numerically computed results approach analytical predictions at limiting cases.
Figure 9.
The normalized bound complex on the bead's surface in the absence of surface exclusion effects as a function of time at various flow rates. The symbols and lines correspond, respectively, to analytical (well-mixed case; Equation 10) and finite element results. C̃o = 10 nM, k̃a = 1.6E5 M-1 s-1, k̃d = 3E-5 s-1, R̃T = 1.5E-11 M m, and D̃ = 3.6E-11 m2 s-1.
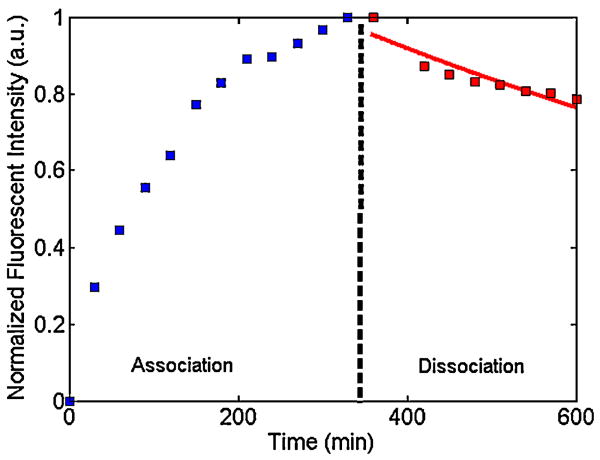
To estimate the dissociation constant k̃d in our experiments and to compare theoretical predictions with experimental observations, we carried out a sequence of experiments in which we measured the bead's emission intensity (proportional to the amount of bound complex) as a function of time. Fig. 10 depicts an example of the results of such an experiment. A solution laden with analyte at concentration C̃o = 20 nM was pumped at a uniform flow rate of 0.11 μL min-1 for 330 min, after which time the contents of the syringe pump were replaced with incubation buffer and the subsequent dissociation of the quantum dots from the bead's surface was monitored as a function of time. The dissociation of the quantum dots from the bead's surface did not strictly conform to Equation 9. Instead, following buffer flow, we initially observed a fast dissociation rate, which decreased at later times. Similar biphasic behavior has been witnessed by other groups studying microbead kinetics [12, 16]. They attributed this behavior to steric hindrance effects and heterogeneities of the receptors at the bead's surface. This explanation is not completely satisfactory, and additional studies are warranted. In our simulations, we used a single dissociation constant, which was estimated by fitting an exponential decay curve (solid line in Fig. 10) to our dissociation data. Accordingly, we estimate k̃d values ranging from 1E-5 to 4E-5 s-1. The order of magnitude of our estimates is in agreement with other bead studies [10, 20] as well as surface plasmon resonance (SPR) studies performed with planar surfaces [60-62]. Our results are consistent with findings of other groups that biotin-streptavidin dissociation kinetics are faster on a solid support than in homogeneous solution [3].
Figure 10.
Experimental association (C̃o = 20 nM) and dissociation curves. The solid (red) curve is a single exponential fit to the experimental data.
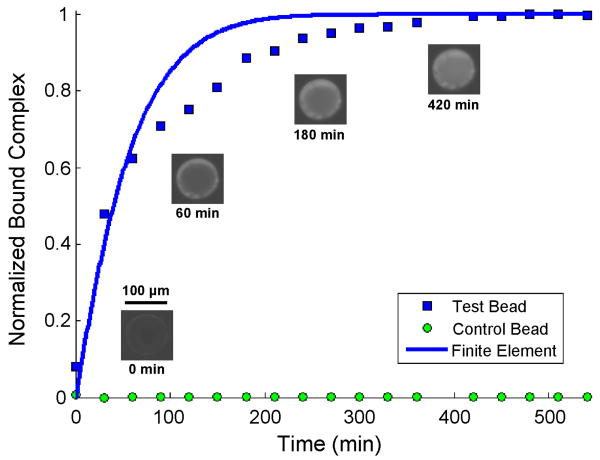
Fig. 11 compares the predictions of our model (solid line) with our experimental data (solid squares). The figure depicts the relative fluorescent intensity (obtained from experimental images after subtracting the background fluorescence emission from the bead and conduit) normalized with the maximum intensity value and the corresponding theoretical estimate as functions of time. Images of the test bead at four different times during the experiment (0, 60, 180, and 420 min) are placed adjacent to the corresponding data points. Intensity data from a plain agarose control bead (containing no streptavidin) normalized with the equilibrium intensity of the functionalized bead is depicted as a function of time (solid circles) to demonstrate lack of significant, non-specific binding of quantum dots to the agarose matrix. In the first 90 min, the theoretical predictions favorably agree with experimental data. When t̃ > 90 min, the theory predicts a higher binding rate than was observed in the experiment. The theoretical model requires a shorter amount of time to achieve equilibrium than was the case in the experiments. The reasons for this discrepancy are unknown. One possible reason for the discrepancy is that in the experiments, the quantum dots navigated the internal porous structure of the bead matrix to bind to interior streptavidin sites. The pore diameter of plain, crosslinked, 6 % agarose beads is reported to be approximately 48 nm [63], which is likely somewhat reduced by the presence of the conjugated streptavidin [64], but is still large enough to accommodate our 10-12 nm diameter quantum dots. The effective diffusion coefficient of the analyte in the agarose matrix is significantly smaller than the diffusion coefficient in the bulk of the solution, thus the slower reaction rate. Nevertheless, the theoretical predictions are in reasonable agreement with experimental observations.
Figure 11.
Normalized total bound complex as a function of time. The symbols and line correspond, respectively, to experimental data and theoretical predictions. Experimental micrographs are included adjacent to several test bead data points. C̃o = 10 nM, k̃a = 1.6E5 M-1 s-1, k̃d = 4E-5 s-1, R̃T = 1.7E-9 M m, Ũ = 8.0E-6 m s-1, and D̃ = 3.6E-11 m2 s-1, yielding Re = 3.7E-4, Pe = 11.4, and Da = 388.
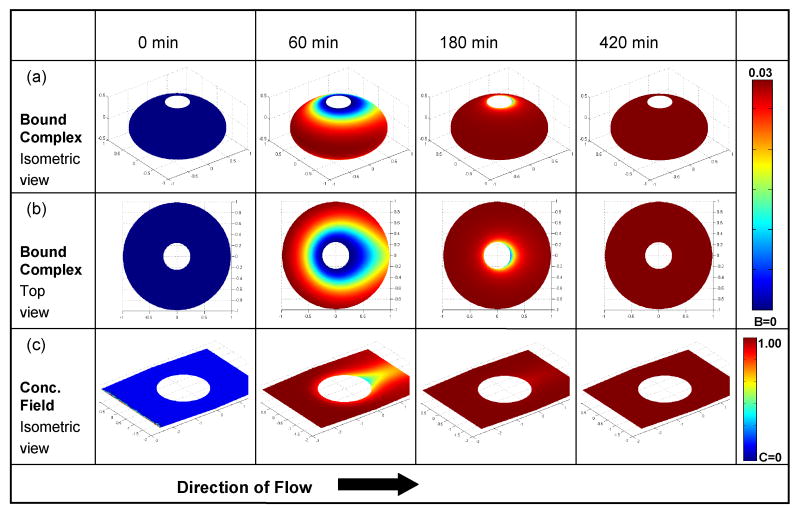
Fig. 12 depicts the predicted bound complex as a function of position on the bead's surface at times 0, 60, 180, and 420 min. The simulation conditions in Fig. 12 are identical to the ones in Fig. 11. In the simulations, analyte of known concentration was introduced into an initially analyte-free conduit. Rows a, b, and c depict, respectively, an isometric view of the bound complex, a top view of the bound complex, and the concentration distribution around the bead at the midheight plane C(x,y,0,t) as functions of position. The concentrations are color-coded and should be cross-referenced with the reference bars on the right hand side. As time progresses, the equator of the bead equilibrates first, and gradually more and more of the bead's surface is covered with quantum dots. Eventually, equilibrium is reached and B remains constant as long as the analyte concentration in the conduit remains unaltered. In the concentration field (row c) around the bead at 60 min, a depleted layer of analyte is visible near the bead's surface and especially at the rear of the bead. The depleted layer is largest at the beginning of an experiment when there are many available binding sites on the bead's surface and decreases as equilibrium is approached. At equilibrium, at ∼420 min, the concentration distribution C̃ in the entire subdomain is uniform and equal to the inlet concentration C̃o.
Figure 12.
Finite element simulation results of the concentration of the quantum dots on and around the bead as functions of time for the same conditions as in Fig. 11. (a) Isometric view of the bound complex. (b) Top view of the bound complex. (c) Isometric view of the concentration field around the bead's midplane.
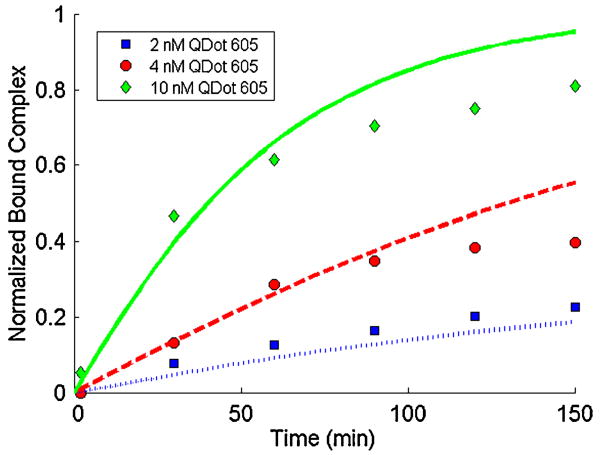
Fig. 13 depicts the measured fluorescent intensity (symbols) and the corresponding theoretical predictions (curves) at three different analyte concentrations (2, 4, 10 nM) as functions of time. As expected, higher analyte concentrations result in higher reaction rates. At relatively short times t < tc, the binding curve is nearly linear, surface exclusion effects are relatively unimportant, and there is excellent agreement between the experimental data and theoretical predictions. The time tc of the nearly linear interval decreases as the analyte concentration increases.
Figure 13.
Experimental (symbols) and finite element results (lines) of the normalized total bound complex as a function of time when C̃o = 2, 4, and 10 nM.
Finally, we used our finite element simulations to estimate the minimum analyte concentration that our bead array could detect within 10 min of incubation time. The limit of detection was defined as the amount of bound complex producing an emission intensity larger than three standard deviations above the measured background fluorescent intensity of the bead. We estimate that our bead array could detect a minimum quantum dot concentration of ∼9 pM when R̃T = 1.7E-9 M m, D̃ = 3.6E-11 m2 s-1, k̃a = 1.6E5 M-1 s-1, k̃d = 3E-5 s-1, and Ũ = 1.0E-5 m s-1. It should be noted that this value is meant to illustrate the predictive power of the simulation; the value is not representative of the detection limit of a real sandwich immunoassay since here the probe binds directly to the bead-immobilized receptor.
4. Conclusions
A method was developed to fabricate an agarose bead array within a microfluidic conduit. A well array was formed by hot embossing a plastic substrate, and beads were positioned deliberately within individual wells. The array may consist of beads of different functionalities to enable concurrent detection of multiple analytes. Multiple beads of the same functionality as well as control beads can also be included to improve detection reliability. The fabrication process is relatively simple and does not require sophisticated facilities. Direct fabrication of the well array within the conduit material is likely to reduce the device's cost and complexity.
A sequence of experiments was carried out to test the bead array. As a model system, we used agarose beads functionalized with streptavidin as a receptor and biotinylated quantum dots as the target analyte. The emission intensity of the quantum dots was monitored as a function of experimental conditions and time. The system exhibited relatively low background emission, and the experiments indicate the feasibility of using the bead array for other analytical studies, such as separating analytes of interest from complex biological samples via specific antigen-antibody interactions.
Concurrently, we carried out three-dimensional finite element simulations in which we computed the flow and concentration fields around the beads at various times and obtained predictions for the binding curves. The mathematical model consists of the solution of the momentum and advection-diffusion equations in the domain surrounding the beads and accounts for reactions at the bead's surface. The reaction kinetics model accounted for commonly overlooked surface exclusion effects, which could occur in an assay where a large adsorbing species (e.g. antibody) blocks multiple receptor sites. The simulations offer a convenient tool to predict how different experimental parameters impact the assay.
The theoretical predictions were compared and agreed reasonably well with experimental observations. This suggests that the computer simulations can provide a useful tool for the design of bead arrays and biosensors. Certain discrepancies between the theory and the experiment were observed, however. In particular, at relatively long times, the theoretical binding rate exceeded the experimental one. The precise reasons for this deviation are not yet known and will be the subject of a future investigation. One possible reason for this discrepancy is the bead's porosity, which accommodates interactions within its interior, while the mathematical model assumes the bead to be impermeable.
Although our study involved direct binding of a fluorescent label to an immobilized receptor, both the experimental and simulation platforms are useful in the analysis of more complicated biological processes such as sandwich immunoaffinity assays and DNA hybridization.
Acknowledgments
Mr. Joe Grogan provided invaluable assistance in the microfabrication lab. This work was supported, in part, by funding from the NSF Integrative Graduate Education and Research Traineeship (IGERT) program, Grant DGE-0221664, a Department of Education Graduate Assistantship in an Area of National Need (GAANN) fellowship in Lab-on-Chip Technologies, and NIH/NIDCR Grant U01-DE-017855.
References
- 1.Phillips TM, Wellner EF. Electrophoresis. 2007;28:3041. doi: 10.1002/elps.200700193. [DOI] [PubMed] [Google Scholar]
- 2.Phillips TM, Wellner EF. Electrophoresis. 2009;30:2307. doi: 10.1002/elps.200900095. [DOI] [PMC free article] [PubMed] [Google Scholar]
- 3.Verpoorte E. Lab Chip. 2003;3:60N. doi: 10.1039/b313217j. [DOI] [PubMed] [Google Scholar]
- 4.Qiu X, Thompson JA, Chen Z, Liu C, Chen D, Ramprasad S, Mauk MG, Ongagna S, Barber C, Abrams WR, Malamud D, Corstjens PLAM, Bau HH. Biomed Microdevices. 2009 doi: 10.1007/s10544-009-9334-4. [DOI] [PMC free article] [PubMed] [Google Scholar]
- 5.Christodoulides N, Tran M, Floriano PN, Rodriguez M, Goodey A, Ali M, Neikirk D, McDevitt JT. Anal Chem. 2002;74:3030. doi: 10.1021/ac011150a. [DOI] [PubMed] [Google Scholar]
- 6.Sato K, Tokeshi M, Odake T, Kimura H, Ooi T, Nakao M, Kitamori T. Anal Chem. 2000;72:1144. doi: 10.1021/ac991151r. [DOI] [PubMed] [Google Scholar]
- 7.Sato K, Tokeshi M, Kimura H, Kitamori T. Anal Chem. 2001;73:1213. doi: 10.1021/ac000991z. [DOI] [PubMed] [Google Scholar]
- 8.Sato K, Yamanaka M, Takahashi H, Tokeshi M, Kimura H, Kitamori T. Electrophoresis. 2002;23:734. doi: 10.1002/1522-2683(200203)23:5<734::AID-ELPS734>3.0.CO;2-W. [DOI] [PubMed] [Google Scholar]
- 9.Pereira SV, et al. J Chromatogr B. 2009 doi: 10.1016/j.jchromb.2009.05.007. [DOI] [Google Scholar]
- 10.Fujita K, Silver J. BioTechniques. 1993;14:608. [PubMed] [Google Scholar]
- 11.Huang S, Stump MD, Weiss R, Caldwell KD. Anal Biochem. 1996;237:115. doi: 10.1006/abio.1996.0208. [DOI] [PubMed] [Google Scholar]
- 12.Buranda T, Jones GM, Nolan JP, Keij J, Lopez GP, Sklar LA. J Phys Chem B. 1999;103:3399. [Google Scholar]
- 13.Ku C, Lentrichia BB. J Colloid Interface Sci. 1989;132:578. [Google Scholar]
- 14.Sasuga Y, Tani T, Hayashi M, Yamakawa H, Ohara O, Harada Y. Genome Res. 2006;16:132. doi: 10.1101/gr.4235806. [DOI] [PMC free article] [PubMed] [Google Scholar]
- 15.Kirby R, Cho E, Gehrke B, Bayer T, Park Y, Neikirk DP, McDevitt JT, Ellington AD. Anal Chem. 2004;76:4066. doi: 10.1021/ac049858n. [DOI] [PubMed] [Google Scholar]
- 16.Henry MR, Stevens PW, Sun J, Kelso DM. Anal Biochem. 1999;276:204. doi: 10.1006/abio.1999.4344. [DOI] [PubMed] [Google Scholar]
- 17.Stevens PW, Henry MR, Kelso DM. Nucleic Acids Res. 1999;27:1719. doi: 10.1093/nar/27.7.1719. [DOI] [PMC free article] [PubMed] [Google Scholar]
- 18.Christodoulides N, Mohanty S, Miller CS, Langub MC, Floriano PN, Dharshan P, Ali MF, Bernard B, Romanovicz D, Anslyn E, Fox PC, McDevitt JT. Lab Chip. 2005;5:261. doi: 10.1039/b414194f. [DOI] [PubMed] [Google Scholar]
- 19.Ali MF, Kirby R, Goodey AP, Rodriguez MD, Ellington AD, Neikirk DP, McDevitt JT. Anal Chem. 2003;75:4732. doi: 10.1021/ac034106z. [DOI] [PubMed] [Google Scholar]
- 20.Ogata Y, Scampavia L, Ruzicka J, Scott CR, Gelb MH, Turecek F. Anal Chem. 2002;74:4702. doi: 10.1021/ac020039h. [DOI] [PubMed] [Google Scholar]
- 21.Horstmann BJ, Kenney CN, Chase HA. J Chromatogr. 1986;361:179. doi: 10.1016/s0021-9673(01)86905-3. [DOI] [PubMed] [Google Scholar]
- 22.Laib S, MacCraith BD. Anal Chem. 2007;79:6264. doi: 10.1021/ac062420y. [DOI] [PubMed] [Google Scholar]
- 23.Mair DA, Geiger E, Pisano AP, Frechet JMJ, Svec F. Lab Chip. 2006;6:1346. doi: 10.1039/b605911b. [DOI] [PubMed] [Google Scholar]
- 24.Piruska A, Nikcevic I, Lee SH, Ahn C, Heineman WR, Limbach PA, Seliskar CJ. Lab Chip. 2005;5:1348. doi: 10.1039/b508288a. [DOI] [PubMed] [Google Scholar]
- 25.Ng JK, Feng H, Liu W. Anal Chim Acta. 2007;582:295. doi: 10.1016/j.aca.2006.09.016. [DOI] [PubMed] [Google Scholar]
- 26.Kim J, Heo J, Crooks RM. Langmuir. 2006;22:10130. doi: 10.1021/la0616956. [DOI] [PubMed] [Google Scholar]
- 27.Buranda T, Huang J, Perez-Luna VH, Schreyer B, Sklar LA, Lopez GP. Anal Chem. 2002;74:1149. doi: 10.1021/ac0109624. [DOI] [PubMed] [Google Scholar]
- 28.Ferguson JA, Steemers FJ, Walt DR. Anal Chem. 2000;72:5618. doi: 10.1021/ac0008284. [DOI] [PubMed] [Google Scholar]
- 29.Goodey A, Lavigne JJ, Savoy SM, Rodriguez MD, Curey T, Tsao A, Simmons G, Wright J, Yoo S, Sohn Y, Anslyn EV, Shear JB, Neikirk DP, McDevitt JT. J Am Chem Soc. 2001;123:2559. doi: 10.1021/ja003341l. [DOI] [PubMed] [Google Scholar]
- 30.Ng JK, Selamat ES, Liu W. Biosens Bioelectron. 2008;23:803. doi: 10.1016/j.bios.2007.08.026. [DOI] [PubMed] [Google Scholar]
- 31.Xu W, Sur K, Zeng H, Feinerman A, Kelso D, Ketterson JB. J Micromech Microeng. 2008;18:1. [Google Scholar]
- 32.Barbee KD, Huang X. Anal Chem. 2008;80:2149. doi: 10.1021/ac702192y. [DOI] [PMC free article] [PubMed] [Google Scholar]
- 33.Becker H, Heim U. Sens Actuators A Phys. 2000;83:130. [Google Scholar]
- 34.Kimerling TE, Liu W, Kim BH, Yao D. Microsyst Technol. 2006;12:730. [Google Scholar]
- 35.Wen J, Yang X, Wang K, Tan W, Zhou L, Zuo X, Zhang H, Chen Y. Biosens Bioelectron. 2007;22:2759. doi: 10.1016/j.bios.2006.11.029. [DOI] [PubMed] [Google Scholar]
- 36.Qian S, Bau HH. Anal Biochem. 2003;322:89. doi: 10.1016/j.ab.2003.07.011. [DOI] [PubMed] [Google Scholar]
- 37.Han M, Gao X, Su JZ, Nie S. Nat Biotechnol. 2001;19:631. doi: 10.1038/90228. [DOI] [PubMed] [Google Scholar]
- 38.Gao X, Nie S. Anal Chem. 2004;76:2406. doi: 10.1021/ac0354600. [DOI] [PubMed] [Google Scholar]
- 39.Yun K, Lee D, Kim H, Yoon E. Meas Sci Technol. 2006;17:3178. [Google Scholar]
- 40.Riegger L, Grumann M, Nann T, Riegler J, Ehlert O, Bessler W, Mittenbuehler K, Urban G, Pastewka L, Brenner T, Zengerle R, Ducree J. Sens Actuators A Phys. 2006;126:455. [Google Scholar]
- 41.Agrawal A, Sathe T, Nie S. J Agric Food Chem. 2007;55:3778. doi: 10.1021/jf0635006. [DOI] [PubMed] [Google Scholar]
- 42.Myszka DG, He X, Dembo M, Morton TA, Goldstein B. Biophys J. 1998;75:583. doi: 10.1016/S0006-3495(98)77549-6. [DOI] [PMC free article] [PubMed] [Google Scholar]
- 43.Vijayendran RA, Ligler FS, Leckband DE. Anal Chem. 1999;71:5405. doi: 10.1021/ac990672b. [DOI] [PubMed] [Google Scholar]
- 44.Zimmermann M, Delamarche E, Wolf M, Hunziker P. Biomed Microdevices. 2005;7:99. doi: 10.1007/s10544-005-1587-y. [DOI] [PubMed] [Google Scholar]
- 45.Hu G, Gao Y, Li D. Biosens Bioelectron. 2007;22:1403. doi: 10.1016/j.bios.2006.06.017. [DOI] [PubMed] [Google Scholar]
- 46.Parsa H, Chin CD, Mongkolwisetwara P, Lee BW, Wang JJ, Sia SK. Lab Chip. 2008;8:2062. doi: 10.1039/b813350f. [DOI] [PubMed] [Google Scholar]
- 47.Hawkins KR, Yager P. Lab Chip. 2003;3:248. doi: 10.1039/b307772c. [DOI] [PubMed] [Google Scholar]
- 48.Bowden M, Song L, Walt DR. Anal Chem. 2005;77:5583. doi: 10.1021/ac050503t. [DOI] [PubMed] [Google Scholar]
- 49.Sohn Y, Goodey A, Anslyn EV, McDevitt JT, Shear JB, Neikirk DP. Biosens Bioelectron. 2005;21:303. doi: 10.1016/j.bios.2004.08.050. [DOI] [PubMed] [Google Scholar]
- 50.Xue B, Sun Y. Chem Eng Sci. 2003;58:1531. [Google Scholar]
- 51.White FM. Viscous Fluid Flow. 2nd. McGraw-Hill; New York: 1991. [Google Scholar]
- 52.Schaaf P, Talbot JJ. J Chem Phys. 1989;91:4401. [Google Scholar]
- 53.Senger B, Voegel JC, Schaaf P. Colloids Surf A Physicochem Eng Asp. 2000;165:255. [Google Scholar]
- 54.Onoda GY, Liniger EG. Phys Rev A. 1986;33:715. doi: 10.1103/physreva.33.715. [DOI] [PubMed] [Google Scholar]
- 55.Tory EM, Jodrey WS. J Theor Biol. 1983;102:439. [Google Scholar]
- 56.Adamczyk Z, Weronski P, Musial E. J Colloid Interface Sci. 2002;248:67. doi: 10.1006/jcis.2001.8170. [DOI] [PubMed] [Google Scholar]
- 57.Yan H, Park SH, Finkelstein G, Reif JH, LaBean TH. Science. 2003;301:1882. doi: 10.1126/science.1089389. [DOI] [PubMed] [Google Scholar]
- 58.Svec F, Tennikova TB, Deyl Z, editors. Monolithic Materials: Preparation, Properties and Applications. Elsevier Science; The Netherlands: 2003. p. 121. [Google Scholar]
- 59.McHale K, Berglund AJ, Mabuchi H. Nano Lett. 2007;7:3535. doi: 10.1021/nl0723376. [DOI] [PubMed] [Google Scholar]
- 60.Perez-Luna VH, O'Brien MJ, Opperman KA, Hampton PD, Lopez GP, Klumb LA, Stayton PS. J Am Chem Soc. 1999;121:6469. [Google Scholar]
- 61.Jung LS, Nelson KE, Stayton PS, Campbell CT. Langmuir. 2000;16:9421. [Google Scholar]
- 62.Tang Y, Mernaugh R, Zeng X. Anal Chem. 2006;78:1841. doi: 10.1021/ac051868g. [DOI] [PMC free article] [PubMed] [Google Scholar]
- 63.Hagel L, Ostberg M, Andersson T. J Chromatogr A. 1996;743:33. [Google Scholar]
- 64.Horstmann BJ, Chase HA. Bioseparation. 1998;7:145. doi: 10.1023/a:1008040302250. [DOI] [PubMed] [Google Scholar]


