Abstract
Objectives
Partial seizures are often believed to be associated with EEG signals of low complexity because seizures are associated with increased neural network synchrony. The investigations reported here provide an assessment of the signal complexity of epileptic seizure onsets using newly developed quantitative measures.
Methods
Using the Gabor atom density (GAD) measure of signal complexity, 339 partial seizures in 45 patients with intracranial electrode arrays were analyzed. Segmentation procedures were applied to determine the timing and amplitude of GAD changes relative to the electrographic onset of the seizure.
Results
330 out of 339 seizures have significant complexity level changes, with 319 (97%) having an increase in complexity. GAD increases occur within seconds of the onset of the partial seizure but are not observed in channels remote from the focus. The complexity increase is similar for seizures from mesial temporal origin, neocortical temporal and extra-temporal origin.
Conclusions
Partial onset seizures are associated with early increases in signal complexity as measured by GAD. This increase is independent of the location of the seizure focus.
Significance
Despite the often predominant rhythmic activity that characterizes onset and early evolution of epileptic seizures, partial seizure onset is associated with an early increase in complexity. These changes are common to partial seizures originating from different brain regions, indicating a similar seizure dynamic.
Keywords: Epilepsy, Seizures, Complexity, Signal Processing, EEG, Matching Pursuit
Introduction
Partial seizures, the most common type of epileptic seizures (Hauser et al., 1996), are transient, dynamic events involving neural networks. These seizures are typically brief, lasting less than two minutes (Afra et al., 2008). Partial seizure onset reflects increased network synchrony with repetitive synchronous firing of neurons and propagation from the seizure onset zone. Ictal onset patterns include periodic spiking, low voltage fast activity, or organized rhythmic activity. These early patterns of seizure onset can facilitate seizure identification and localization in patients undergoing long-term monitoring for presurgical evaluations. This rhythmic activity, associated with increased neural network synchrony, may evolve over time, changing in frequency or pattern. Visual inspection of these patterns often suggests a signal that is less complex than the preictal period because one predominant frequency comprises a disproportionate amount of the signal energy.
Complexity is an abstract notion that can be confusing as it is often derived from mathematically advanced techniques that do not offer tangible interpretations of the results. Complexity of the EEG does not have a universal definition. Several taxonomies have been proposed to classify those measures (Wackerbauer et al., 1994; Rapp and Schmah, 1996) based on the characteristics they assess. Wackerbauer et al. and Grassberger have reviewed some of the existing measures (Wackerbauer et al., 1994; Grassberger, 1989). Although many variations were developed, most of the measures used for signal processing can be traced back to works from Shannon (Shannon, 1948), Kolmogorov (Kolmogorov, 1965), Hjorth (Hjorth, 1970), Lempel (Lempel and Ziv, 1976), Pincus (Pincus, 1991), Lopez-Ruiz (López-Ruiz et al., 1995), Richman (Richman and Moorman, 2000) or Lambertini (Lamberti et al., 2004).
One notable field is chaos theory which became very popular soon after the initial work by Grassberger and Procaccia (Grassberger and Procaccia, 1983). Reports of low dimensional chaos in neurons (Rapp et al. 1985) and in EEG (Babloyantz et al., 1985; Babloyantz and Destexhe, 1986) triggered a dramatic increase in research to understand brain dynamics and assess the dimensional complexity, or correlation dimension D2 of brain activity. Although early results were later shown to be biased (Theiler, 1995; Theiler, 1996), more recent studies have refocused on assessing nonlinear dynamics rather than strict deterministic chaos (Stam, 2005; Hornero et al., 2009) and have focused more on seizure prediction (Lehnertz and Litt, 2005) than intrinsic seizure activity. However using a neuronal complexity measure L based on D2, Lehnertz reported a focal decrease in complexity during epileptic events (Lehnertz and Elger, 1995).
The characterization of seizure onset was at first driven by the intent to classify such onset patterns for the purpose of improving diagnosis. Originally based on visual characteristics (Blume et al., 1984; Ebersole and Pacia, 1996), frequency parameters were then used to assess the onset patterns in a more objective manner (Spencer et al., 1992; Wetjen et al., 2009). Later on, Alacorn et al. (Alarcon et al., 1995) uses the Hjorth complexity measure among other parameters to assess the pattern of seizure onsets. Identification of seizure onset with detection algorithms often uses a combination of spectral parameters and template matching of the seizure characteristics (Qu and Gotman, 1997; Chan et al., 2008; Osorio et al., 1998). Recently increases in complexity during seizures were reported using entropy measures based on wavelet decomposition (Rosso et al., 2003).
The matching pursuit (MP) method provides a continuous time-frequency decomposition of the signal into functions called atoms. To provide a more readily applicable method to quantify and display this complexity, the Gabor atom density (GAD) was developed (Jouny et al., 2003). GAD is a composite measure based on the MP decomposition. In preliminary studies of intracranial ictal recordings, GAD changes have been demonstrated to be very reproducible patterns, similar for recurrent seizures from a given patient (with a single seizure focus). In the same study, GAD was also used to show the increased signal complexity of the EEG during seizures compared to interictal EEG, including during the period of organized rhythmic activity (ORA) for mesial lobe onset seizures.
Signal analysis of epileptic seizures is confounded by the rapidly changing and transient nature of the ictal events. Earlier investigations (Franaszczuk et al., 1998) have shown that the matching pursuit (MP) method (Mallat and Zhang, 1993) can provide continuous decompositions of these dynamic ictal events. The MP method can be applied equally well to linear and non-linear signals and is much better suited to analysis of rapidly changing signals than are most other methods (e.g. fast Fourier, autoregressive modeling). These early studies suggest that partial seizures are associated with changing signal complexity during the various phases of the seizure and that even the most rhythmic period of the seizures have greater complexity than signals generated from Duffing equation in limit cycle behavior (Bergey and Franaszczuk, 2001).
Our goal here is to study the complexity of the EEG signal at seizure onset and to provide a quantitative assessment of the changes associated with it. Prior studies have investigated the applicability of the matching pursuit method to intracranial EEG (Franaszczuk et al., 1998; Bergey and Franaszczuk, 2001; Jouny et al., 2003) and the use for specific purpose such as seizure detection (Jouny et al., 2005) or seizure propagation (Jouny et al., 2007).
The present study is a systematic application of the GAD measure to intracranial ictal recordings from patients undergoing presurgical evaluations. These analyses demonstrate that partial seizure signal complexity at the ictal onset zone reliably increases early after seizure onset. This comprehensive analysis of a large number of seizures illustrates the utility of the GAD measure for such analyses and supplements the previous reports noted above which were limited in scope.
Methods
Clinical data
Records from 50 consecutive patients with intractable epilepsy undergoing presurgical evaluations between 2004 and 2006 were selected for this study. Five patients who did not have any seizures recorded during their stay. The remaining 45 patients were included for the analysis of complexity changes at seizure onset. Intracranial recording arrays included combinations of subdural multicontact grids and strips placed over the area of interest and targeted multicontact depth electrode arrays. Seizures were recorded using a Stellate™ system with a 1000Hz sampling rate and an anti-aliasing filter set at 300Hz, converted to EDF format for storage and further processing. Analyses were carried out using bipolar montages using neighboring electrodes. Events included simple and complex partial seizures with or without secondary generalization as well as sub-clinical seizures if identified as such by the neurologists.
The research protocol was reviewed by the Johns Hopkins Institutional Review Board and data was stored in a database compliant with HIPAA (Health Insurance Portability and Accountability Act) regulations. After selection, 339 seizures from the 45 patients were available for analysis. This cohort of patients includes 22 men and 23 women. Seventeen patients were diagnosed with mesial temporal lobe epilepsy (MTLE), 5 with neocortical temporal lobe onset epilepsy (NeoTE), 15 with extra-temporal lobe epilepsy (NeoXTE) and 8 patients which could not be classified as either (e.g. multi-foci onset seizures, rapid bilateral spread). The mean age for the 45 patients is 27±13.
Onset definition and electrode choice
All seizures were reviewed and classified by neurologists with subspeciality EEG and epilepsy training and marked electrographical onsets (EO). EO is the earliest sign of epileptiform activity which subsequently evolves into seizure activity and is clearly distinct from the interictal activity. The time of the EO is labeled tEO. The electrode where this early activity was observed was marked as the focus of the seizure. When the onset of activity was regional and could not be localized to a single electrode, one of the electrodes of the onset region was chosen for final analysis. In these patients with regional seizure onset, preliminary GAD analyses were performed for all electrodes within the seizure onset zone and similar dynamics were seen for all electrodes. Therefore selection of the electrode within the seizure onset zone for these patients with regional seizure onset did not affect the results.
Assessment of complexity changes was done by comparing changes at the focus to an intracranial contact remote from but ipsilateral to the seizure focus. For subdural electrodes, the remote electrode chosen was the furthest away from the focus (e.g. an occipital electrode for a frontal onset seizure) based on 3D MRI reconstruction of the brain and overlapping electrodes placement. For depth electrodes recordings, the remote electrode was chosen from the same depth array but furthest from the focus.
Matching pursuit and GAD complexity
Analysis of the intracranial EEG (ICEEG) signals was done using the matching pursuit decomposition algorithm (Mallat and Zhang, 1993). The method is an iterative procedure which decomposes a signal on basic functions called atoms. Each atom is defined by a modulated Gaussian function representing the most basic element which can be used to decompose the ICEEG signal. The choice of Gaussian modulated functions for the atoms gives an optimal time-frequency resolution resulting in equality in the Heisenberg uncertainty principle . Δt and Δf represent the uncertainty of localization in time and frequency respectively.
The MP algorithm is an iterative procedure that is stopped when a chosen criterion is met. A new criterion to stop the decomposition was introduced that was more efficient in the analysis and detection of epileptic seizures (Jouny et al., 2003). This new criterion stops the decomposition when the latest of the atom extracted has a modulus (root square of the energy) which is below a fixed threshold. As such, this threshold specifies the precision of the time-frequency representation obtained. The decomposition threshold was set at 10μV (energy threshold of 100μV2) to obtain a sufficiently detailed time-frequency representation for all the analyses performed for this study and a comparable measure of complexity. All events were analyzed with a moving window of 4.096 seconds, overlapping 75% for a time resolution of 1.024 seconds.
The Gabor atom density (GAD) is computed as the number of atoms m required to decompose the signal divided by the size of the time-frequency space in each window analyzed:
where T is the length of the window in seconds, Fn is the Nyquist frequency and N is the number of points in the window.
Estimation of levels and times of GAD changes
In this study we hypothesize that the complexity of ICEEG, GAD, can be modeled as a series of constant levels Aj between time tj and tj+1. We assume that within each interval the signal complexity GAD is constant with added white Gaussian noise nσ(t) of variance σ2.
where M is the number of intervals with different levels, t0=0, tM=N, and N is number of points in the analyzed epoch. The levels of GAD, the times of change of level, and the variance of noise are all unknown at the start of the analysis and are computed from GAD. The maximum likelihood estimator of each level Aj is given by the sample mean of the data over each segment. The joint maximum likelihood estimator of levels Aj and times tj is found by minimization of:
This formula is amendable to a recursive evaluation so the minimization can be performed by applying a dynamic programming approach (Kay, 1998). Results of this procedure are illustrated in Figure 1C.
Figure 1.
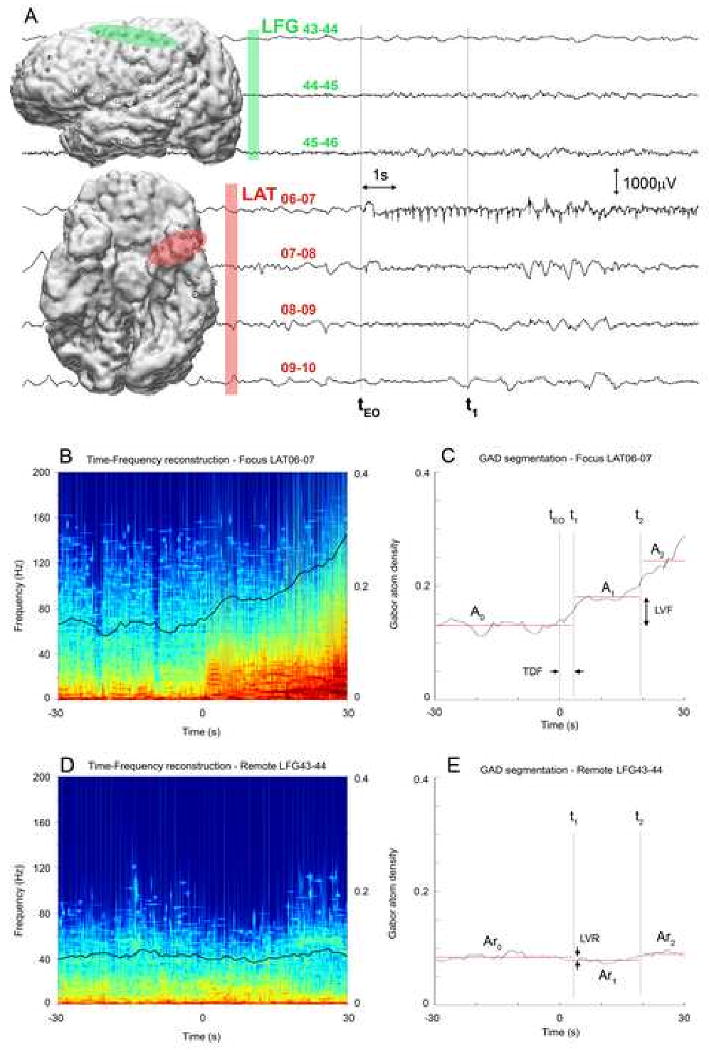
ICEEG of a seizure onset and GAD segmentation procedure to quantify complexity changes. (A) 30 seconds of the ICEEG for seven representative channels recorded at the onset of a complex partial seizure, three channels from the left frontal grid LFG (green) and four bottom channels from left anterior temporal strips LAT (red). (B & D) Color-coded matching pursuit time-frequency reconstruction of one minute of the ICEEG for focus channel LAT06-07 and remote channel LFG43-44 respectively. (C) Gabor atom density plot for the focus channel LAT06-07 and illustration of segmentation procedure. tEO is the time of electrographical onset of the epileptic seizure (marked as zero). t1, t2, A0, A1 and A2 are determined by the segmentation method. LVF is the GAD level difference between A1 and A0. TDF is the time difference between t1 and tEO. (D) Gabor atom density plot for the remote channel LFG43-44. Time t1 and t2 are same as in (C) and are used to calculate the Ar0, Ar1, Ar2 levels. LVR - the GAD level change on the remote channel - is the difference between Ar1 and Ar0.
Given a window of analysis of one minute centered on the time tEO of the onset of the seizure, we assume that the GAD changes can be modeled with M=3. A0 will represent the preictal GAD level, t1 the time of the first change of GAD level related to the onset of the seizure and A1 the GAD level after the initial GAD level change. A2 will model the variation of GAD further into the seizure. Using the same time t0 and t1 on the remote channel allows us to compute the GAD levels Ar0 and Ar1 for the remote channel. The three parameters that will be analyzed are LVF=A1-A0, TDF=t1-tEO and LVR=Ar1-Ar0.
The segmentation method was selected as a mean to quantify the time and level of GAD changes associated with the onset of ictal events. Segmentation times more than 10 seconds prior to the electrographic onset of the ictal event and past the end of the ictal event were not analyzed.
The MP method and the GAD derivative are single channel methods. Color-coded composite maps of multichannel GAD complexity measures can be assembled from multiple single channel analyses.
Results
Segmentation Analysis
Four seizures (1.2%) did not show ictal GAD level changes and five (1.5%) only had post-ictal changes detected. In some of these seizures there was an ictal GAD increase, but the low slope of the complexity increase, which violated the hypothesis of the segmentation procedure of a rapid level change, prevented the segmentation from identifying the change. Segmentation analysis identified valid ictal GAD level changes for 330 events out of 339 seizures (97.3%). Figure 1 illustrates the segmentation procedure and an example of a mesial temporal onset seizure with GAD increase corresponding to the EO. Figures 1 and 2 illustrate that these early GAD increases occur at or near the seizure focus (later in the ictal propagation zone) and not at regions remote from the seizure focus. Figure 2 is a multichannel map showing composite GAD changes for each intracranial contact, illustrating the pattern of seizure propagation. The ictal buildup is present in the basal region (LAT - left anterior temporal) and later in LMT and LPT (left mesial and posterior temporal respectively). It is interesting to note the decrease in complexity (darker blue) occuring at the same time in the others recorded regions (LFG - left frontal grid). This decreased complexity is wide spread and correlates with a flattening of the ICEEG in those areas. No high frequency activity is associated with these changes in the frontal region. This example also illustrates synchronous seizure termination in all channels and a post-ictal period characterized by very low signal complexity.
Figure 2.
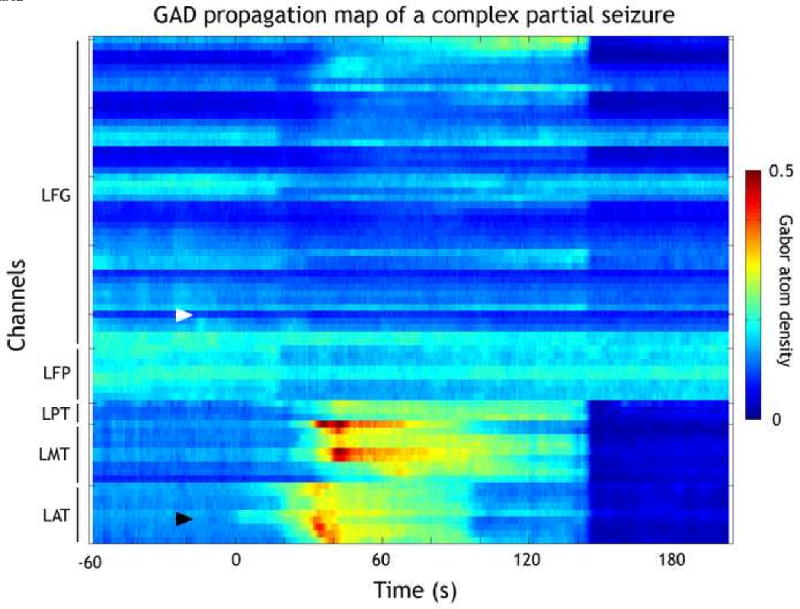
Color-coded GAD propagation map for the same seizure as illustrated in Figure 1. Propagation maps are composite reconstructions of the color-coded GAD for individual channels. Black lines on left side indicate the grids/strips. LFG: left frontal grid. LFP: left fronto-polar. LPT: left posterior temporal. LMT: left mesial temporal. LAT: left anterior temporal. Zero on the horizontal axis indicates the electrographical onset of the epileptic seizure tEO. Although this is not a spatial representation of the spread over the brain, propagation maps allow us to identify the regions involved during the spread of ictal activity. Channels are listed consecutively, but on occasion consecutive channels are on opposite sides of the grid. The GAD propagation map demonstrates the focal onset (black arrow) at LAT06-07 contacts over mesial temporal regions. In addition the propagation map reveals the subsequent regional temporal lobe spread and minimal spread to frontal lobe contacts. White arrow indicates the chosen remote contact. The postictal period beginning at 145 seconds is characterized by general low complexity signals.
GAD level changes
Figure 3 shows two GAD plots for a continuous 3 hour period for the focus and remote electrodes for one patient with mesial temporal onset seizures. Arrows indicate the two seizures occurring during that period. GAD levels for electrodes close to the focus exhibit large increases in comparison to preictal levels. By comparison the GAD levels for electrodes remote from the focus do not show significant changes until the decrease during postictal period (sz#1) or until the increase late in the seizure during the propagation of the ictal activity to that region (sz#2). The difference in baseline GAD levels between both locations is typical for mesial versus neocortical electrodes (e.g. higher for neocortical). Only relative measures of GAD changes were used to account for that difference in complexity. In this 3 hour sample, no GAD increases (comparable to the ictal changes) were seen that were not associated with seizures.
Figure 3.
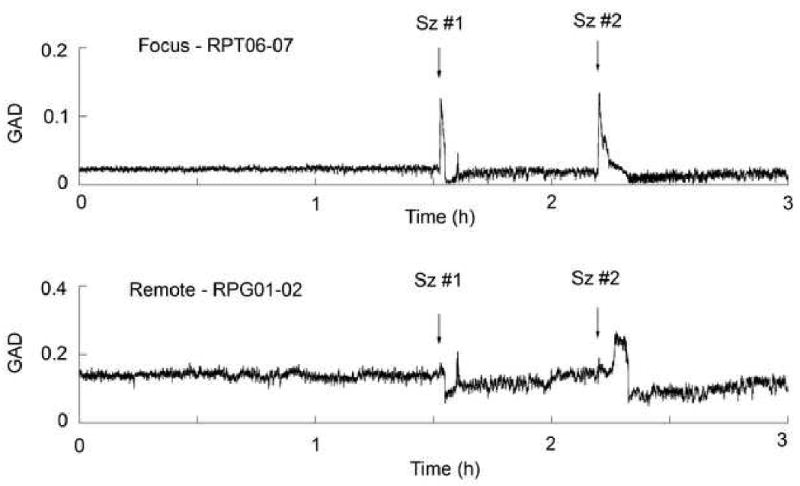
Plots of the GAD levels over a 3 hour period for the focus and remote electrodes with two complex partial seizures. Arrows indicate the time of the two seizures occurring within that window. The RPT strip was over the right posterior temporal region and the RPG grid over the right parietal region.
Of the 330 seizures with valid segmentations, 319 seizures (96.7%) have increases in GAD levels and eleven seizures (3.3%) have decreases in GAD levels at onset. Among those eleven events, eight seizures have been visually identified as having an electrodecremental onset (ED). The other five had decrease complexity but no EEG flattening.
The average GAD increase at the focus LVF is 0.06±0.03 for all seizures. The GAD level change LVR for the remote channel averages 0.01±0.02. Paired t-test comparison between LVF and LVR shows a significant difference between both locations (t=25.8, p<0.001) with the GAD increase at the focus being larger than the GAD change at the remote location (Figure 4).
Figure 4.
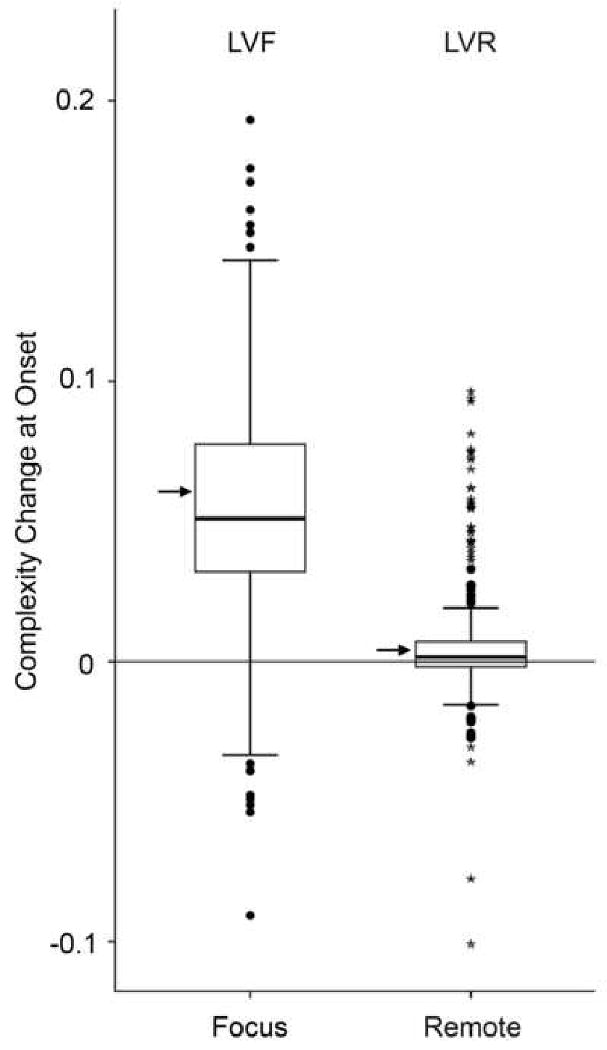
Boxplots of the GAD level changes for all 330 seizures measured at the focus (LVF) and at the remote electrode (LVR). Boxes extend from the 25% quartile to the 75% quartile (this defines the inter quartile range IQR). The black bar inside box represents the median, the arrow on the side indicates the mean. Bars above and below represents 1.5 times the IQR. Dots and stars represent mild and extreme outliers (defined as outside the IQR). LVF has one extreme outlier not represented in the graph at 0.63.
Time differences (TDF) between the GAD level change and the time of marked EO range from -10s to +24s with a window of analysis of 4.096s. GAD changes occur early in the seizure, typically within the first ten seconds and often within the first five seconds. The largest number of GAD level changes is seen in the 3-5 seconds interval (Figure 5). The histogram of TDF shows that the maximum of this distribution coincided with the length of the window of analysis. The 4.096s window of analysis is a window length which permits sufficient frequency resolution. However the window size potentially affects the ability to detect faster complexity changes. Negative values of TDF indicate cases where EEG complexity changes are detected just before the marked onset of the seizure.
Figure 5.
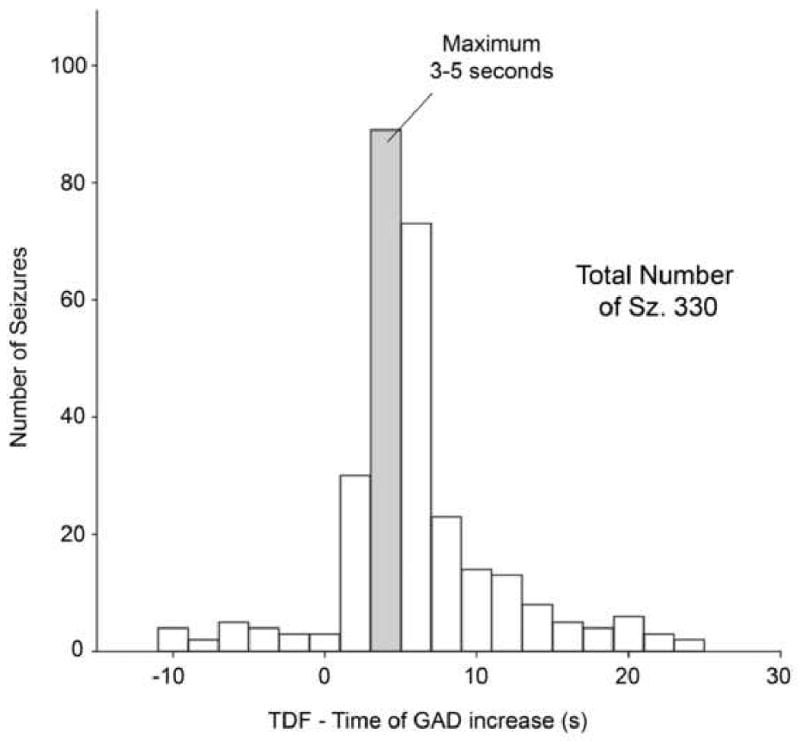
Histogram of the time of GAD increase for all 330 seizures.
To determine whether the measured complexity increases are dependent on the clinical onset zone of the seizures, we performed the analysis of variance for the GAD complexity increase at the focus (LVF) for the 37 patients with localized unifocal onset (Figure 6). The various seizure onset locations were compared (MTLE, NeoTE and NeoXTE). However we have unequal group size for each location and unequal number repetitions; number of seizures per patient ranged from 1 to 86. To avoid biased results from patients with a large number of seizures and the possible effect of clustering which would affect neocortical onset patients mostly, only the first seizure of each patient was considered in this analysis. As mentioned previously, patterns of GAD increase (e.g. rate of increase and degree of increase) early in the seizure are remarkably consistent from seizure to seizure in a given patient. This reflects the similarities of the time-frequency energy reconstructions for multiple seizures from a single focus in a given patient. Levene statistic W for homogeneity of variance do not show significant difference in variance (W=0.921; p=0.408). The one-way ANOVA shows that there is no significant difference in the GAD increase between groups (F=0.063; p=0.94). A similar analysis for TDF shows that there is no difference in the time of GAD increase (F=0.086; p=0.92).
Figure 6.
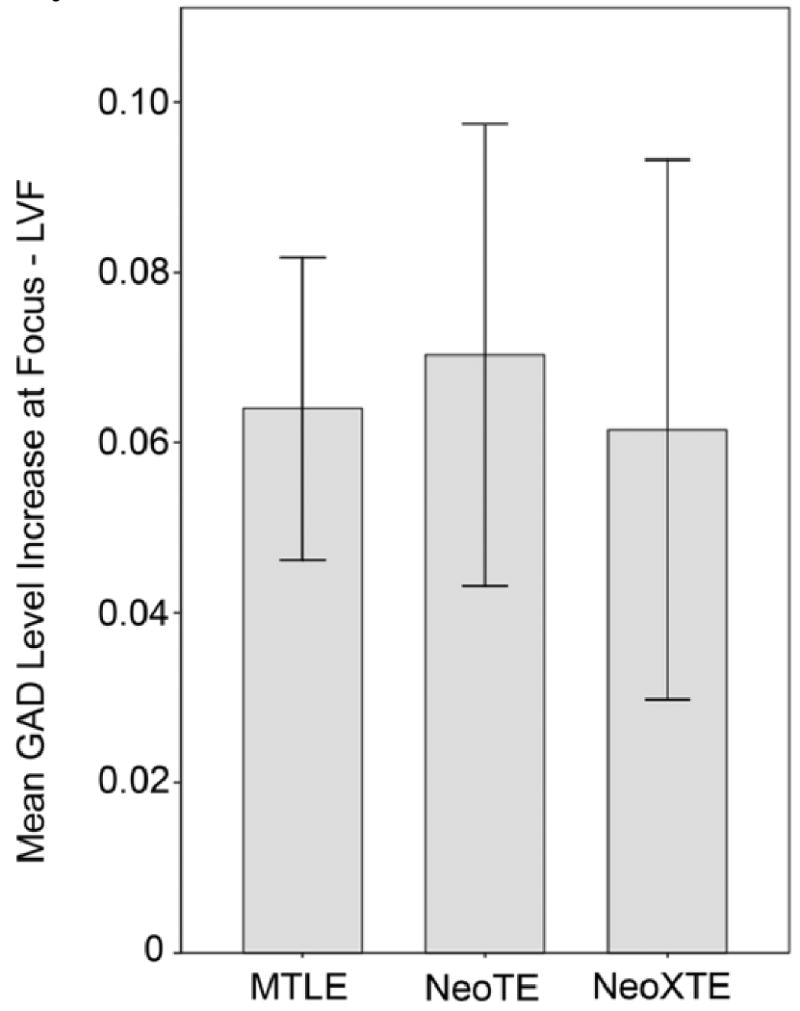
Comparison of the GAD increase at focus (LVF) by region of onset. MTLE: mesial temporal lobe epilepsy. NeoTE: neocortical temporal epilepsy. NeoXTE: neocortical extra-temporal epilepsy. There is no significant difference between the regions of onset. Similar GAD increase was observed for all regions.
Discussion
Our approach to complexity assesses the features of the EEG signal using a single measure (GAD) capable of distinguishing relative degrees of complexity. The Gabor atom density measure based on the matching pursuit time-frequency decomposition is based on the number of basic oscillations (modulated Gaussian functions) needed to represent the EEG signal during a limited period of time. By definition GAD is a density measure of the time-frequency representation of the EEG signal.
This study of 339 seizures in 45 patients was designed to include a realistic broad spectrum of partial seizure variability that can be encountered in presurgical patients monitored with intracranial arrays. No preselection of patients was made and all epileptic seizures were considered for all the patients regardless of the final diagnosis.
The complexity of the EEG as measured by GAD, the Gabor atom density, shows a consistent increase at the onset of the seizure for the vast majority of seizures (97%) and patients (91%). Rarely GAD decreased or did not change. The most common cause for GAD complexity decrease at seizure onset is the occurrence of a regional electrodecremental change. EEG flattening and the occurrence of high-frequency components can produce opposite effects on GAD levels. Electrodecremental patterns without significant high frequency activity usually decrease GAD values; high-frequency activity increases GAD values. Of the eleven events with GAD decreases at onset, five were observed in a single patient with frontal lobe onset epilepsy. Although low-voltage fast components were visible, other activities were greatly reduced at seizure onset producing an overall GAD decrease.
Choice of the window length is a compromise between time resolution and information gathered. A shorter 1.024s window (results not included here) showed that GAD increases can be seen even earlier. However unless this is used for an online detection algorithm, there is little advantage to do so. GAD complexity increases at seizure onset are present in partial seizures originating from mesial temporal structures, temporal lobe neocortex, or extra-temporal neocortical regions and there is no difference in the time of the GAD increase. This uniformity of increase suggests dynamical changes that are common to all partial seizures regardless of the site of origin of the seizure.
Although reports of seizure onset characterization using complexity measures are few, wavelet based entropies measures used by Rosso show an increase in complexity during a limited number of ictal events (Rosso et al., 2003). While most non-linear analyses have focused on pre-ictal periods, an incidental report of ictal data shows an increase in synchronization (Mormann et al., 2003) and another report suggests a decrease in correlation dimension (Lehnertz and Elger, 1995).
The complexity of the EEG signal during epileptic seizures can be assessed by different measures, but previous methods have not been systematically applied to large numbers of seizures. The GAD method presented here and applied to a large number of ictal events shows a significant and frequent increase (over 95% of seizures analyzed) in complexity at the onset of partial seizures. This early GAD increase occurs within a few seconds of the electrographical onset and is not observed in channels remote from onset. Furthermore this complexity change is observed regardless of the region of onset of the seizure (mesial temporal, neocortical, and extra-temporal). Despite the apparent contradiction of increased complexity and the rhythmic synchronous activity of an epileptic seizure, simultaneous occurrence of apparent order and increased complexity is not uncommon and is a known marker of self-organization (Plastino and Rosso, 2005). Mechanisms of this increased complexity are not yet fully understood but might be linked to the increased neural network recruitment during the initiation phase of the seizure.
Acknowledgments
Funding: NIH grant NS-48222
Footnotes
Publisher's Disclaimer: This is a PDF file of an unedited manuscript that has been accepted for publication. As a service to our customers we are providing this early version of the manuscript. The manuscript will undergo copyediting, typesetting, and review of the resulting proof before it is published in its final citable form. Please note that during the production process errors may be discovered which could affect the content, and all legal disclaimers that apply to the journal pertain.
References
- Afra P, Jouny CC, Bergey GK. Duration of complex partial seizures: an intracranial EEG study. Epilepsia. 2008;49:677–684. doi: 10.1111/j.1528-1167.2007.01420.x. [DOI] [PubMed] [Google Scholar]
- Alarcon G, Binnie CD, Elwes RD, Polkey CE. Power spectrum and intracranial EEG patterns at seizure onset in partial epilepsy. Electroencephalogr Clin Neurophysiol. 1995;94:326–337. doi: 10.1016/0013-4694(94)00286-t. [DOI] [PubMed] [Google Scholar]
- Babloyantz A, Salazar J, Nicolis C. Evidence of chaotic dynamics of brain activity during the sleep cycle. Phys Lett A. 1985;111:152–156. [Google Scholar]
- Babloyantz A, Destexhe A. Low-dimensional chaos in an instance of epilepsy. Proc Natl Acad Sci USA. 1986;83:3513–3517. doi: 10.1073/pnas.83.10.3513. [DOI] [PMC free article] [PubMed] [Google Scholar]
- Bergey GK, Franaszczuk PJ. Epileptic seizures are characterized by changing signal complexity. Clin Neurophysiol. 2001;112:241–249. doi: 10.1016/s1388-2457(00)00543-5. [DOI] [PubMed] [Google Scholar]
- Blume WT, Young GB, Lemieux JF. EEG morphology of partial epileptic seizures. Electroencephalogr Clin Neurophysiol. 1984;57:295–302. doi: 10.1016/0013-4694(84)90151-2. [DOI] [PubMed] [Google Scholar]
- Chan AM, Sun FT, Boto EH, Wingeier BM. Automated seizure onset detection for accurate onset time determination in intracranial EEG. Clin Neurophysiol. 2008;119:2687–2696. doi: 10.1016/j.clinph.2008.08.025. [DOI] [PubMed] [Google Scholar]
- Ebersole JS, Pacia SV. Localization of temporal lobe foci by ictal EEG patterns. Epilepsia. 1996;37:386–399. doi: 10.1111/j.1528-1157.1996.tb00577.x. [DOI] [PubMed] [Google Scholar]
- Franaszczuk PJ, Bergey GK, Durka PJ, Eisenberg HM. Time-frequency analysis using the matching pursuit algorithm applied to seizures originating from the mesial temporal lobe. Electroencephalogr Clin Neurophysiol. 1998;106:513–521. doi: 10.1016/s0013-4694(98)00024-8. [DOI] [PubMed] [Google Scholar]
- Grassberger P, Procaccia I. Measuring the strangeness of strange attractors. Physica D. 1983;9:189–208. [Google Scholar]
- Grassberger P. Problems in quantifying self-generated complexity. Helv Phys Acta. 1989;62:489–511. [Google Scholar]
- Hauser WA, Annegers JF, Rocca WA. Descriptive epidemiology of epilepsy: contributions of population-based studies from Rochester, Minnesota. Mayo Clin Proc. 1996;71:576–586. doi: 10.4065/71.6.576. [DOI] [PubMed] [Google Scholar]
- Hjorth B. EEG analysis based on time domain properties. Electroencephalogr Clin Neurophysiol. 1970;29:306–310. doi: 10.1016/0013-4694(70)90143-4. [DOI] [PubMed] [Google Scholar]
- Hornero R, Abasolo D, Escudero J, Gomez C. Nonlinear analysis of electroencephalogram and magnetoencephalogram recordings in patients with Alzheimer's disease. Philos T R Soc A. 2009;367:317–336. doi: 10.1098/rsta.2008.0197. [DOI] [PubMed] [Google Scholar]
- Jouny CC, Franaszczuk PJ, Bergey GK. Characterization of epileptic seizure dynamics using Gabor atom density. Clin Neurophysiol. 2003;114:426–437. doi: 10.1016/s1388-2457(02)00344-9. [DOI] [PubMed] [Google Scholar]
- Jouny CC, Franaszczuk PJ, Bergey GK. Signal complexity and synchrony of epileptic seizures: Is there an identifiable preictal period? Clin Neurophysiol. 2005;116:552–558. doi: 10.1016/j.clinph.2004.08.024. [DOI] [PubMed] [Google Scholar]
- Jouny CC, Adamolekun B, Franaszczuk PJ, Bergey GK. Intrinsic ictal dynamics at the seizure focus: effects of secondary generalization revealed by complexity measures. Epilepsia. 2007;48:297–304. doi: 10.1111/j.1528-1167.2006.00963.x. [DOI] [PubMed] [Google Scholar]
- Kay SM. Fundamentals of statistical signal processing - Volume II - Detection Theory. PTR Prentice Hall; Englewood Cliffs, N.J.: 1998. [Google Scholar]
- Kolmogorov AN. Three approaches to the quantitative definition of information. Probl Inf Transm. 1965;1:1–7. [Google Scholar]
- Lamberti PW, Martin MT, Plastino A, Rosso OA. Intensive entropic non-triviality measure. Physica A. 2004;334:119–131. [Google Scholar]
- Lehnertz K, Elger CE. Spatio-temporal dynamics of the primary epileptogenic area in temporal lobe epilepsy characterized by neuronal complexity loss. Electroencephalogr Clin Neurophysiol. 1995;95:108–117. doi: 10.1016/0013-4694(95)00071-6. [DOI] [PubMed] [Google Scholar]
- Lehnertz K, Litt B. The First International Collaborative Workshop on Seizure Prediction: summary and data description. Clin Neurophysiol. 2005;116:493–505. doi: 10.1016/j.clinph.2004.08.020. [DOI] [PubMed] [Google Scholar]
- Lempel A, Ziv J. On the Complexity of Finite Sequences. IEEE T Inform Theory. 1976;22:75–81. [Google Scholar]
- López-Ruiz R, Mancini HL, Calbet X. A statistical measure of complexity. Phys Lett A. 1995;209:321–326. [Google Scholar]
- Mallat SG, Zhang Z. Matching pursuit with time-frequency dictionaries. IEEE Trans Biomed Eng. 1993;41:3397–3415. [Google Scholar]
- Mormann F, Kreuz T, Andrzejak RG, David P, Lehnertz K, Elger CE. Epileptic seizures are preceded by a decrease in synchronization. Epilepsy Res. 2003;53:173–185. doi: 10.1016/s0920-1211(03)00002-0. [DOI] [PubMed] [Google Scholar]
- Osorio I, Frei MG, Wilkinson SB. Real-time automated detection and quantitative analysis of seizures and short-term prediction of clinical onset. Epilepsia. 1998;39:615–627. doi: 10.1111/j.1528-1157.1998.tb01430.x. [DOI] [PubMed] [Google Scholar]
- Plastino A, Rosso OA. Entropy and statistical complexity in brain activity. Europhys News. 2005;36(6):224–228. [Google Scholar]
- Pincus SM. Approximate entropy as a measure of system complexity. Proc Natl Acad Sci USA. 1991;88:2297–2301. doi: 10.1073/pnas.88.6.2297. [DOI] [PMC free article] [PubMed] [Google Scholar]
- Qu H, Gotman J. A patient-specific algorithm for the detection of seizure onset in long- term EEG monitoring: possible use as a warning device. IEEE Trans Biomed Eng. 1997;44:115–22. doi: 10.1109/10.552241. [DOI] [PubMed] [Google Scholar]
- Rapp PE, Zimmerman ID, Albano AM, Deguzman GC, Greenbaun NN. Dynamics of spontaneous neural activity in the simian motor cortex: The dimension of chaotic neurons. Phys Lett A. 1985;110:335–338. [Google Scholar]
- Rapp PE, Schmah T. Complexity measures in molecular psychiatry. Mol Psychiatry. 1996;1:408–416. [PubMed] [Google Scholar]
- Richman JS, Moorman JR. Physiological time-series analysis using approximate entropy and sample entropy. Am J Physiol-Heart C. 2000;278:H2039–49. doi: 10.1152/ajpheart.2000.278.6.H2039. [DOI] [PubMed] [Google Scholar]
- Rosso OA, Martin MT, Plastino A. Brain electrical activity analysis using wavelet-based informational tools (II): Tsallis non-extensivity and complexity measures. Physica A. 2003;320:497–511. [Google Scholar]
- Shannon CE. The mathematical theory of communication. Bell System Technical Journal. 1948 [Google Scholar]
- Spencer SS, Guimaraes P, Katz A, Kim J, Spencer D. Morphological patterns of seizures recorded intracranially. Epilepsia. 1992;33:537–545. doi: 10.1111/j.1528-1157.1992.tb01706.x. [DOI] [PubMed] [Google Scholar]
- Stam CJ. Nonlinear dynamical analysis of EEG and MEG: review of an emerging field. Clin Neurophysiol. 2005;116:2266–2301. doi: 10.1016/j.clinph.2005.06.011. [DOI] [PubMed] [Google Scholar]
- Theiler J. On the evidence for low-dimensional chaos in an epileptic electroencephalogram. Phys Lett A. 1995;196:335–351. [Google Scholar]
- Theiler J. Re-examination of the evidence for low-dimensional, nonlinear structure in the human electroencephalogram. Electroencephalogr Clin Neurophysiol. 1996;98:213–222. doi: 10.1016/0013-4694(95)00240-5. [DOI] [PubMed] [Google Scholar]
- Wackerbauer R, Witt A, Atmanspacher H, Kurths J, Scheingraber H. A comparative classification of complexity measures. Chaos Soliton Fract. 1994;4:133–173. [Google Scholar]
- Wetjen NM, Marsh WR, Meyer FB, Cascino GD, So E, Britton JW, et al. Intracranial electroencephalography seizure onset patterns and surgical outcomes in nonlesional extratemporal epilepsy. J Neurosurg. 2009;110:1147–1152. doi: 10.3171/2008.8.JNS17643. [DOI] [PMC free article] [PubMed] [Google Scholar]


