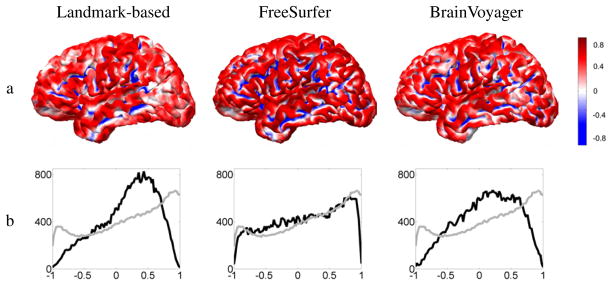
Fig. 3.
a: Average curvature of Group 1 cortical surfaces on the target brain; b: Histogram of the average curvature after registration (black), and average of the curvature histograms before registration (gray). In other words, black denotes the histogram of the curvature map displayed in row (a), and gray the typical curvature histogram a cortical surface has before registration.

