

Abstract
A comparison of methods to decrease RF power dissipation and related heating in conductive samples using passive conductors surrounding a sample in a solenoid coil is presented. Full-Maxwell finite difference time domain numerical calculations were performed to evaluate the effect of the passive conductors by calculating conservative and magnetically-induced electric field and magnetic field distributions. To validate the simulation method, experimental measurements of temperature increase were conducted using a solenoidal coil (diameter 3 mm), a saline sample (10 mM NaCl) and passive copper shielding wires (50 μm diameter). The temperature increase was 58% lower with the copper wires present for several different input powers to the coil. This was in good agreement with simulation for the same geometry, which indicated 57% lower power dissipated in the sample with conductors present. Simulations indicate that some designs should be capable of reducing temperature increase by more than 85%.
Keywords: solenoidal coil, shield, SAR, sample heating
1. INTRODUCTION
In MRI and high resolution NMR of small samples, the RF electrical fields within the sample can be a significant factor in temperature increase (ΔT) and SNR [1]. The vast majority of MR microscopy and small-volume NMR studies use solenoidal coils. In this geometry, the conservative electric (Ec) field – mainly caused by the scalar electric potential in the coil winding [2] – can be a significant component of the total electric field in the sample [1, 3]. This has led to a variety of proposed methods to reduce the Ec field (and associated heating) within the sample while still maintaining a significant B1 field intensity. These methods have included passive [4, 5] or active [6] conductors between the solenoidal coil and the sample, and use of coil geometries other than the solenoid that have significantly lower Ec fields [7–9].
In this paper we use numerical methods to compare some simple methods to decrease sample power loss and related ΔT using strategically-positioned passive conductors to partially shield the sample from the Ec field of the solenoidal coil. We refer to a set of conductors placed between the coil and the sample to shield conservative E-fields while allowing B1 to penetrate the sample as an “Ec shield.” Full-Maxwell numerical calculations of the electromagnetic fields are performed to evaluate several different arrangements of copper strips oriented along the major axis of the solenoid and arranged about the circumference of the cylinder in a manner similar to that described by Gadian [4] and applied recently by Wu and Opella [10], as well as a more recently proposed method, referred to here as the “loop-gap shield” [5]. To validate the numerical calculation method, experiments measuring ΔT with and without a specific Ec shield geometry are performed and results are compared to those from simulations of the same geometry.
2. THEORY
The time-rate of change in temperature (dT/dt) within a non-perfused material with an internal heat source, arising from the specific energy absorption rate (SAR) can be written as
| (1) |
where ρ is the mass density, c the heat capacity, and k the thermal conductivity. The SAR can be calculated as
| (2) |
where σ is the local electrical conductivity of the sample and Etotal is the magnitude of the total electric field within the sample. Etotal can be separated into two components, Ec (caused by the spatial distribution of the scalar electric potential φ), and Ei, induced by the time-varying magnetic fields. This can be expressed as
| (3) |
where A⃗ is the vector magnetic potential (Wb/m) defined such that
| (4) |
In order to reduce the absorbed power loss, E⃗total should be minimized, but changes in Ei will necessarily require changes in the B1 field distribution also. With a strategic arrangement of passive conductors, however, it is possible to implement a Faraday cage structure that cannot support significant cirumferential RF electrical currents, and thus reduce Ec with minimal effect on the B1 field [4].
3. MATERIALS AND METHODS
Numerical calculations were used to simulate and compare a variety of designs of Ec shield. To validate the numerical calculation methods, experimental measurement of temperature increase in a phantom with and without an Ec shield was performed and results were compared to simulations.
3.1 Experimental Setup
All MRI experiments were performed on a 14.1 tesla (600 MHz) Direct Drive spectrometer (Varian, Palo Alto, CA) using a custom-made solenoidal coil (3 mm diameter and 4.5 mm length) consisting of 4 turns of 0.35 mm-diameter copper. The sample (10 mM NaCl in a 1.67 mm outer diameter glass tube) was inserted into a polyamide tube (outer diameter: 2.24 mm, length 10.8 mm) which was placed into the solenoidal coil. Five copper wires of 50 μm diameter (California Fine Wire, Grover Beach, CA) oriented parallel to the axis of the coil were glued onto the outside of the polyamide tube. The RF coil was immersed in a perfluorinated liquid (FC43, 3M, Minnesota) for magnetic susceptibility matching and thermal isolation (Figure 1).
Figure 1.

The geometry of the solenoidal coil and copper wires for the experiment (a), the copper wires (b) and final assembly showing non-magnetic variable capacitors for impedance matching (c). Five copper wires were glued onto the outside of the polyamide tube to form an Ec shield, and FC43 (Perfluorotributylamine) was used for cooling of the solenoidal coil.
Estimation of temperature increases were performed using interlaced periods of RF heating and MRI temperature measurements using the proton reference frequency (PRF) method [11]. Five different time-average input powers (0, 0.15, 0.3, 0.6 and 1.2 Watts) were used for the heating periods. First, a baseline image was acquired using a single slice gradient echo (GE) sequence (TR = 100 ms, TE = 10 ms, field-of-view = 20 × 20 mm, matrix size = 256 × 96, slice thickness = 1 mm, scanning time = 9.6 sec). RF heating used a WALTZ-4 decoupling sequence which was applied for approximately 20 seconds. Imaging and heating procedures were successively repeated sixteen times for each value of the input power. Phase difference images were generated using MATLAB (The MathWorks, Inc., Natick, MA), and phase unwrapping was performed using a previously-published method [12]. Temperature increases (ΔT) with respect to the baseline image were calculated according to [11]
| (5) |
where Δφ is the difference in phase between the particular image and the baseline image acquired before the first heating period.
3.2 Numerical Calculations
For comparison of the simulation to experimental results, the modeled coil and Ec shield geometries closely matched those used in experiment. Geometries with no Ec shield and with five copper strips of 50 μm width and 10.86 mm length placed between the solenoid coil and the sample were modeled. These models were defined on a rectilinear grid with 0.012 mm resolution for use with the finite difference time domain (FDTD) method of calculation for electromagnetics.
For numerical comparisons of different Ec shield designs, a model of a 1.6 mm-diameter, 16 mm-long 10 mM saline sample (σ=0.2S/m, εr=78 at 600 MHz) was created within the solenoid coil.. Simulations with no Ec shield, and four different arrangements of evenly-spaced narrow copper strips (0.20 mm width, 10.8 mm length) or wider copper strips (0.60 mm diameter, 10.8 mm length), and a loop-gap shield [5] were performed with this arrangement. These models were defined on a rectilinear grid with 0.050 mm resolution for use with the FDTD method. These geometries are shown in Figure 2.
Figure 2.
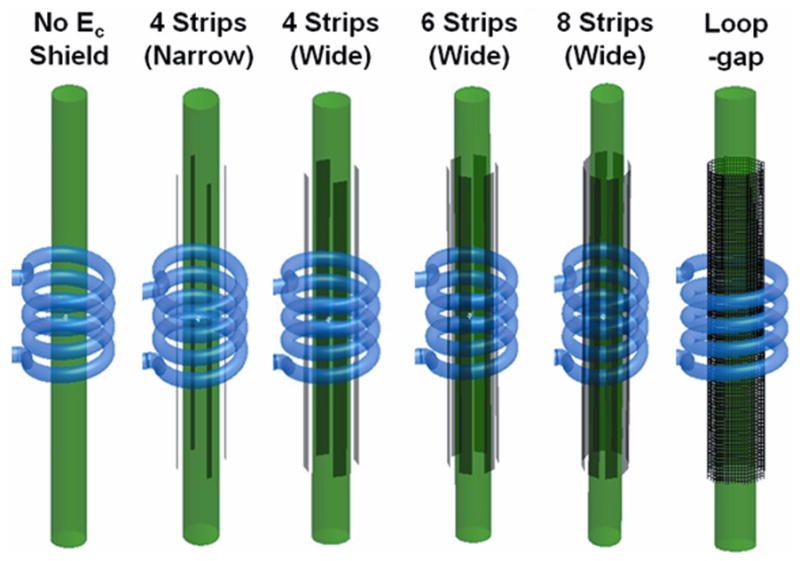
Six different geometries used for the numerical calculations. Ec shields consisting of arrangements of narrow (200 μm width) or wide (600 μm width) copper strips each with length 10.8 mm were modeled. In addition, the case without any Ec shield served as a control, and for comparison a recently-published alternative, a loop-gap shield with diameter 2.4 mm and length 10.8 mm, was also modeled.
All simulation work was performed using commercially-available FDTD software (xFDTD; Remcom, Inc; State College, PA), with the coil driven by a sinusoidally-varying 600 MHz voltage source. Analysis of the results was performed in Matlab (The MathWorks, Inc., Natick, MA). All simulation results of electromagnetic fields were normalized so that Bx = 4 mT at the coil center.
To analyze calculation results, we applied a recently-developed method for separating Ec and Ei from the results of the FDTD calculation [13]. First, E⃗i was calculated as
| (6) |
where J⃗ is the current density in the coil from the FDTD simulation, ω is the Larmor frequency, and μ0 is the permeability of free space. E⃗c was then calculated as
| (7) |
where E⃗total is the electric field obtained from the FDTD simulation. This method is reasonably accurate when the currents in the coil are much greater than the currents in the sample and when the problem geometry is small enough that wavelength effects are negligible [13]: both conditions are well-satisfied by the experimental setups analyzed here.
4. RESULTS
Figure 3 shows the experimentally-measured increase in signal phase observed in a rectangular region of interest at the center of the phantom (see dotted line in Figure 4) on gradient echo images acquired between periods of heating when a time-average input power of 1.2W is applied and no Ec shield is present. Most of the phase change (and thus temperature increase) occurs between the first (baseline) and second image, or during the first period of heating. After this, the effects of thermal conduction and mechanisms of heat transfer to the environment surrounding the sample become significant, and the temperature increases at a notably slower rate.
Figure 3.

Phase at the center of the sample throughout a single experiment involving a weak saline phantom (10 mM NaCl) without Ec shield and an input power of 1.2 W. Images corresponding to the first two data points would be used to make temperature maps because of weighting toward SAR effects and away from thermal conduction effects.
Figure 4.
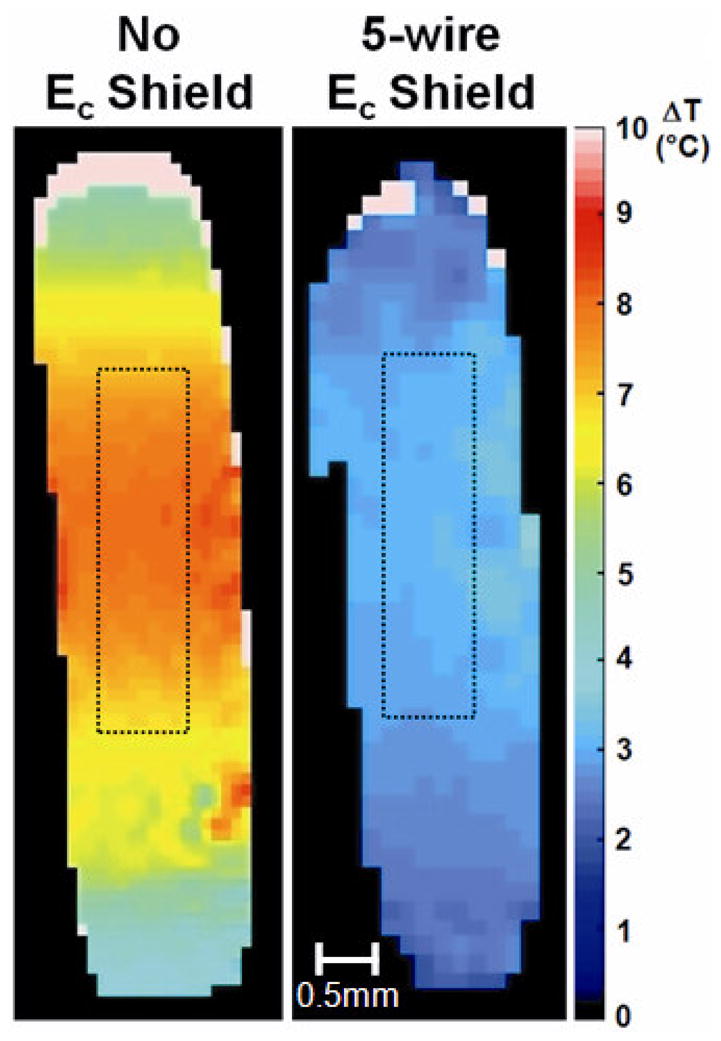
Experimentally-measured temperature increase (ΔT) map within the saline sample (10 mM NaCl: σ = 0.2, εr = 78) for different input power driving heating with (bottom) and without (top) copper wires. First two phase images were used to make phase difference map, which is necessary for the calculation of the ΔT image.
Figure 4 shows maps of the experimentally-determined temperature increase in the phantom between the first (baseline) and second gradient-echo images with and without the presence of the 5-wire Ec shield when a time-average input power of 1.2 W is applied. The dotted rectangle outlines the region used for numerical data in Figures 3 and 5 and in Table 1.
Figure 5.
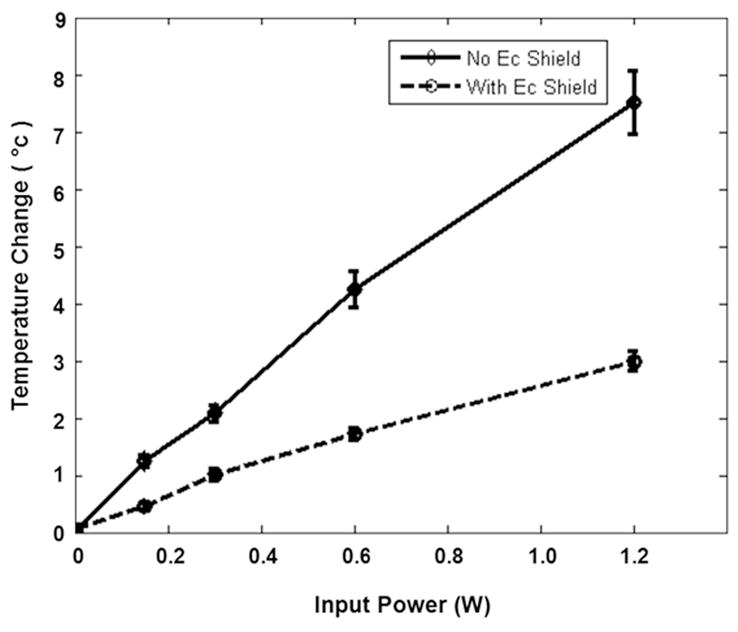
Average temperature increase (ΔT) in the rectangular region of interest of the sample for different input powers without (solid) and with (dashed) copper wires. The temperature increase (ΔT) was decreased significantly with the addition of the copper wires. Error bars indicate standard deviation of temperature in region of interest.
Table 1.
Experimentally-measured temperature change ΔT after 20 seconds of irradiation at different time-average input powers with and without the 5-wire Ec shield. With the Ec shield present, the temperature increase is approximately 60% smaller than when no Ec shield is present and RF power is applied.
| Input Power | 0W | 0.15W | 0.3W | 0.6W | 1.2W |
|---|---|---|---|---|---|
| Mean ΔT: No Ec Shield | 0.009°C | 1.25°C | 2.08°C | 4.24°C | 7.52°C |
| Mean ΔT: 5-wire Ec Shield | 0.063°C | 0.47°C | 1.01°C | 1.72°C | 2.99°C |
Table 1 and Figure 5 present experimentally-measured temperature increases at the center of the phantom with and without the 5-wire Ec shield for a variety of input powers. The temperature increase is seen to be roughly proportional to the input power level. Values with no applied power during the heating period are close to zero, and indicate the level of error in the measurement. On average the temperature increase is reduced by approximately 58% with the addition of the 5-wire Ec shield in experiment.
Table 2 presents simulated values for the average Ec and B1 fields, and standard deviation of the B1 field with and without the 5-wire Ec shield. It is seen that the presence of the 5-wire Ec shield significantly reduces Ec with minimal effect on the B1 field magnitude or homogeneity. Table 2 also gives the total power dissipated in the sample for each case, showing that the dissipated power is reduced by 57% with addition of the 5-wire Ec shield.
Table 2.
Numerically-calculated electromagnetic field properties with and without the 5-wire Ec shield. With the Ec shield present, the power dissipation is approximately 57% smaller than when no Ec shield is present, in good agreement with the experimentally measured reduction of temperature increase.
| Sample Mean Ec (kV/m) | Sample Mean B1+ (mT) | Sample Std. B1+ (mT) | Sample Power Dissipation (mW) | |
|---|---|---|---|---|
| No Ec Shield | 12.76 | 1.83 | 0.74 | 110.94 |
| 5-wire Ec Shield | 8.53 | 1.83 | 0.74 | 48.05 |
Figure 6 shows the calculated magnitude of the Ec, Ei, and B1 fields within the sample for six different simulation conditions including no Ec shield, four different arrangements of copper strips, and the loop-gap shield (geometries shown in Figure 2). Table 3 gives numerical values for Ec and B1 as well as the power dissipated in the sample for each case. The presence of any of the Ec shields is seen to reduce Ec and the dissipated power throughout the sample significantly. In all but the loop-gap shield this is accomplished with minimal effect on the B1 field distribution. Of the geometries compared here, the 8-strip Ec shield reduces the dissipated power by the greatest amount (88%), with the 6-strip and loop-gap shield designs following closely.
Figure 6.
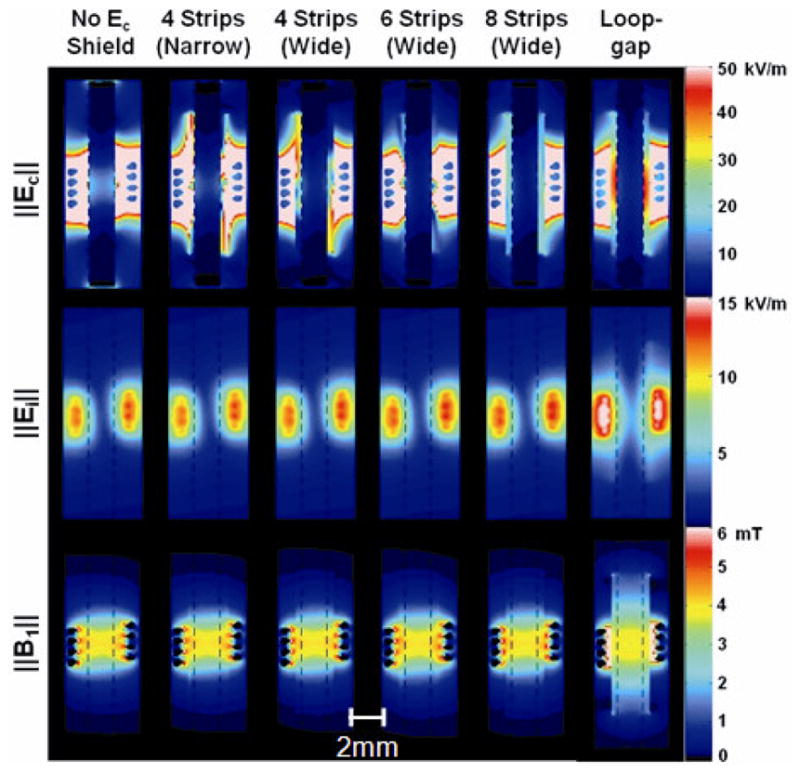
Approximate magnitude of conservative electric field (Ec, first row), magnetically induced electric field (Ei, second row), and total RF magnetic field (B1, third row) for six different conditions. All values were normalized so that Bx = 4 mT at the coil center.
Table 3.
Calculated electromagnetic field properties within the sample between the two ends of the coil. SD indicates standard deviation. All values were normalized so that Bx = 4 mT at the coil center.
| Mean ||Ec|| [kV/m] | Mean ||B1+|| [mT] | SD ||B1+|| [mT] | Power Dissipation [mW] | |
|---|---|---|---|---|
| No Ec Shield | 12.64 | 1.82 | 0.733 | 107.97 |
| 4 Strips (Narrow) | 8.84 | 1.82 | 0.732 | 44.48 |
| 4 Strips (Wide) | 7.30 | 1.82 | 0.732 | 24.59 |
| 6 Strips (Wide) | 6.26 | 1.83 | 0.735 | 13.72 |
| 8 Strips (Wide) | 6.20 | 1.83 | 0.733 | 12.81 |
| Loop-gap Shield | 6.94 | 1.87 | 0.745 | 14.52 |
5. DISCUSSION
The results of this study confirm that strategically-placed passive conductors as an Ec shield can reduce RF heating of a sample within a solenoid coil. Although this general principle has been noted in, or can be inferred from, previous works [4, 5], here numerical calculations are used to compare a number of designs, showing that the geometry of the Ec shield can largely determine its efficacy. For example, four narrow strips are shown to reduce power dissipation in the sample by 59%, but 8 broad strips can reduce it by 88%.
In general, a number of long, thin conductive strips or wires oriented parallel to the coil axis and placed on the outer surface of the cylindrical sample can reduce sample heating with minimal effect on the B1 field, since the conductors can carry a charge density distribution opposing the Ec field of the coil, which is oriented along the coil axis [13], but cannot carry any significant current in the circumferential direction and thus cannot significantly affect the B1 field of the solenoid. Another design, based on a single conductor around the surface of the cylinder – continuous except for one slit along its length oriented with the coil axis, the loop-gap shield [5] – has also been shown to significantly reduce heating, but with a significant effect on the magnitude and uniformity of the B1 field. It was noted previously that the effect on the B1 field is to make it more homogeneous along the whole length of a sample extending well beyond the ends of the solenoid [5]. This is also apparent in Figure 6 of this work. However, in Table 3 we quantified the standard deviation of the B1 field in the sample between the ends of the solenoid only, and found in that region the loop-gap shield did not improve homogeneity, but may actually slightly reduce it. Also, use of the loop-gap shield required approximately 40% greater current in the solenoid to achieve the same B1 field magnitude at the center of the coil compared to the other cases. If the sample volume is significantly longer than the solenoid, this loss of sensitivity per sample volume at the center of the coil may be offset by greater sensitivity to regions of the sample outside the solenoid.
In principle, the use of Ec shields should also affect the signal-to-noise ratio (SNR). Reducing Ec in the sample reduces sample-related noise induced in the coil, but the addition of good conductors to the imaging volume also introduces a potential new source of noise. Careful analysis of this effect would require a different method for numerical calculation (such as a finite element method or a method of moments) which is more capable of accurately representing skin depth effects at the micron level. Work in this area is ongoing.
Acknowledgments
Funding for this work was provided by the National Institutes of Health (NIH) through R01 EB000454 and by the Pennsylvania Department of Health.
Footnotes
Publisher's Disclaimer: This is a PDF file of an unedited manuscript that has been accepted for publication. As a service to our customers we are providing this early version of the manuscript. The manuscript will undergo copyediting, typesetting, and review of the resulting proof before it is published in its final citable form. Please note that during the production process errors may be discovered which could affect the content, and all legal disclaimers that apply to the journal pertain.
References
- 1.Minard KR, Wind RA. Solenoidal microcoil design-Part II: optimizing winding parameters for maximum signal-to-noise performance. Con Magn Reson Vol. 2001;13(3):190–210. [Google Scholar]
- 2.Hoult DI, Lauterbur PC. The sensitivity of the zeugmatographic experiment involving human samples. J Magn Reson. 1979;34:425–433. [Google Scholar]
- 3.Park BS, Webb AG, Smith MB, Collins CM. Conservative electric fields can dominate sample loss in high field microimaging. ISMRM-ESMRMB. 2007:3245. [Google Scholar]
- 4.Gadian DG, Robinson FNH. Radiofrequency losses on NMR experiments on electrically conducting samples. J Magn Reson. 1979;34:449–455. [Google Scholar]
- 5.Krahn A, Priller U, Emsley L, Engelke F. Resonator with reduced sample heating and increased homogeneity for solid-state NMR. J Magn Reson Mar. 2008;191(1):78–92. doi: 10.1016/j.jmr.2007.12.004. [DOI] [PubMed] [Google Scholar]
- 6.Doty FD, Kulkarni J, Turner C, Entzminger G, Bielecki A. Using a cross-coil to reduce RF heating by an order of magnitude in triple-resonance multinuclear MAS at high fields. J Magn Reson. 2006;128(2):239–253. doi: 10.1016/j.jmr.2006.06.031. [DOI] [PubMed] [Google Scholar]
- 7.Gor’kov PL, Chekmenev E, Li C, Cotten M, Buffy JJ, Traaseth NJ, Veglia G, Brey WW. Using low-E resonators to reduce rf heating in biological samples for static solid-state NMR up to 900 MHZ. J Magn Reson. 2007;185:77–93. doi: 10.1016/j.jmr.2006.11.008. [DOI] [PubMed] [Google Scholar]
- 8.Stringer JA, Bronnimann CE, Mullen G, Zhou DH, Stellfox SA, Li Y, Williams EH, Rienstra CM. Reduction of rf induced sample heating with a scroll coil resonator structure for solid state NMR probes. J Magn Reson. 2005;173:40–48. doi: 10.1016/j.jmr.2004.11.015. [DOI] [PubMed] [Google Scholar]
- 9.Dillmann B, Elbayed K, Zeiger H, Weingertner MC, Piotto M, Engelke F. A novel low-E field coil to minimize heating of biological samples in solid-state multinuclear NMR experiments. J Magn Reson. 2007;187:10–18. doi: 10.1016/j.jmr.2007.02.018. [DOI] [PubMed] [Google Scholar]
- 10.Wu CH, Grant CV, Cook GA, Park SH, Opella SJ. A strip-shield improves the efficiency of a solenoid coil in probes for high-field solid-state NMR of lossy biological samples. J Magn Reson. 2009;200:74–80. doi: 10.1016/j.jmr.2009.06.004. [DOI] [PMC free article] [PubMed] [Google Scholar]
- 11.Kuroda K, Abe K, Tsutsumi S, Ishihara Y, Suzuki Y, Satoh K. Water proton magnetic resonance spectroscopic imaging. Biomedical Thermology. 1994;13:43–62. [Google Scholar]
- 12.Jenkinson M. Fast, Automated, N-dimensional Phase-Unwrapping Algorithm. Magn Reson Med. 2003;49:193–197. doi: 10.1002/mrm.10354. [DOI] [PubMed] [Google Scholar]
- 13.Park B, Webb AG, Collins CM. A Method to Separate Conservative and Magnetically-Induced Electric Fields in Calculations for MRI and MRS in Electrically-small Samples. J Magn Reson. 2009;199:233–237. doi: 10.1016/j.jmr.2009.05.007. [DOI] [PMC free article] [PubMed] [Google Scholar]