

Abstract
Approximately 40% of Americans take dietary supplements, including vitamin E (α-tocopherol). Unlike other fat-soluble vitamins, α-tocopherol is not accumulated to toxic levels. Rather tissue levels are tightly regulated, in part via increased hepatic metabolism and excretion that could, theoretically, alter metabolism of drugs, environmental toxins and other nutrients. To date, in vivo subcellular location(s) of α-tocopherol metabolism have not been identified. The proposed pathway of α-tocopherol metabolism proceeds via ω-hydroxylation to 13′-OH-α-tocopherol, followed by successive rounds of β-oxidation to form α-CEHC. To test the hypothesis that α-tocopherol ω-hydroxylation occurs in microsomes while β-oxidation occurs in peroxisomes, rats received daily injections of vehicle, 10 mg α-tocopherol or 10 mg trolox/100 g body wt for 3 days, then microsomes, mitochondria and peroxisomes were isolated from liver homogenates. Homogenate α-tocopherol levels increased 16-fold in α-tocopherol-injected rats, while remaining unchanged in trolox- or vehicle-injected rats. Total α-tocopherol recovered in the three subcellular fractions represented 93 ± 4% of homogenate α-tocopherol levels. In α-tocopherol-injected rats, microsome α-tocopherol levels increased 28-fold, while mitochondria and peroxisome levels increased 8- and 3-fold, respectively, indicating greater partitioning of α-tocopherol to the microsomes with increasing liver α-tocopherol. In α-tocopherol-injected rats, microsome 13′-OH-α-tocopherol levels increased 24-fold compared to controls, and were 7-fold greater than 13′-OH-α-tocopherol levels in peroxisome and mitochondrial fractions of α-tocopherol-injected rats. An unexpected finding was that α-CEHC, the end product of α-tocopherol metabolism, was found almost exclusively in mitochondria. These data are the first to indicate a mitochondrial role in α-tocopherol metabolism.
Keywords: vitamin E, cytochrome P450, xenobiotic metabolism, mitochondria, peroxisome, β-oxidation, ω-oxidation, CYP
Introduction
Daily vitamin E supplements are taken by more than 35 million people in the U.S [1]. Vitamin E (α-tocopherol) has antioxidant benefits and is the most potent chain-breaking, fat-soluble antioxidant in human plasma and tissues. Even so, there is recent concern that vitamin E supplements may have adverse effects [2, 3]. However, the mechanism for adverse effects is unclear.
Unlike other fat-soluble vitamins, α-tocopherol is not accumulated in the body to toxic levels. Importantly, our previous data show that the body has the ability to eliminate “excess” α-tocopherol via increased metabolism and excretion to prevent excess accumulation of both α-tocopherol and α-CEHC, the final product of α-tocopherol metabolism, even when daily pharmacologic vitamin E doses are administered [4]. Given the importance of regulation of vitamin E concentrations in human health we have continued to focus upon elucidating the mechanism of hepatic α-tocopherol metabolism. Identification of the pathways involved in eliminating “excess” α-tocopherol, as well as the ability of α-tocopherol to modulate hepatic metabolism and excretion pathways, is needed in order that α-tocopherol supplements may be used with optimal benefits for maintaining human health, while avoiding possible adverse effects.
The proposed pathway for hepatic α-tocopherol metabolism involves an initial ω-hydroxylation to 13′-OH-α-tocopherol by a cytochrome P450 (CYP) enzyme followed by conversion to a carboxylic acid and then several steps of β-oxidation leading to the formation of α-CEHC (2,5,7,8-tetramethyl-2-(2′-carboxyethyl)-6-hydroxychroman) (structures shown in Figure 1) [5, 6]. Insect microsomes expressing recombinant human CYP enzymes have been utilized to demonstrate metabolism of γ-tocopherol, and to a much lesser extent α-tocopherol, to their respective 13′-OH-tocopherol metabolites by CYP4F2 [7, 8]. However, additional in vitro data suggests a possible role for CYP3A in α-tocopherol metabolism [6]. Still, the role of microsomes in the in vivo metabolism of α-tocopherol has yet to be confirmed.
Fig. 1.

Chemical structures of α-tocopherol, α-CEHC and trolox.
CYP enzymes and ATP binding cassette (ABC) transport proteins are members of the xenobiotic metabolism and excretion pathways. CYP enzymes are responsible for the initial step(s) in the metabolism of numerous pharmaceutical drugs, environmental toxins, and phytochemicals, i.e., tocopherols, phylloquinone, and alkylresorcinols [9-11]. ABC transporters are responsible for elimination of exogenous parent compounds and their metabolites, as well as certain endogenous compounds [12].
In rats given daily pharmacologic doses of α-tocopherol the elimination of “excess” α-tocopherol occurred concurrently with increased expression of the ABC transport protein, ABCB1 (MDR1) and a subset of hepatic CYP enzymes, including CYP3A, 2B and 2C families, but not CYP4F2 or 1A [4]. Lung ABCB1 protein levels, but not lung CYP protein levels, increased as well. Furthermore, in mice fed diets supplemented with 1000 IU α-tocopherol gene expression of a similar subset of xenobiotic enzymes and transporters, including Cyp3a11 and Abcb1a, increased as compared to mice fed diets containing 35 IU α-tocopherol [13]. α-Tocopherol modulation of xenobiotic metabolism may provide protection from environmental toxins.
To date the enzymes responsible for β-oxidation of α-tocopherol have not been identified. β-Oxidation pathways exist in both the mitochondria and the peroxisomes, however the enzymes present in these two organelles differ in their substrate specificity [14, 15]. Mitochondrial substrates include long, medium, and short straight-chain fatty acids, but not very long straight-chain fatty acids. Mitochondria show low activity toward dicarboxylic fatty acids, 2-methyl-branched fatty acids and prostaglandins. Substrates for peroxisome β-oxidation include medium, long and very long straight-chain fatty acids, as well as 2-methyl-branched fatty acids, dicarboxylic fatty acids, certain isoprenoids, and bile acid intermediates. However, peroxisomal enzymes have a low affinity for short-chain substrates such that once shortened by one or more rounds of peroxisomal β-oxidation many of the peroxisomal substrates are transferred to the mitochondria for their final rounds of β-oxidation [14, 15]. All four tocopherol forms of vitamin E (α, β, δ, and γ) have a saturated isoprenoid side-chain (phytyl tail) that resembles the structure of a 2-methyl-branched fatty acid (Figures 1 and 2).
Fig. 2.

Pristanic acid β-oxidation utilizes both peroxisomes and mitochondria. [15, 17].
*Note the similarities between pristanic acid and the phytyl tail of α-tocopherol.
Although experimental data identifying the subcellular location of tocopherol β-oxidation is not currently available in the literature, the accepted paradigm for tocopherol β-oxidation is that it occurs exclusively in peroxisomes [14-16]. However, the 2-methyl-branched fatty acids, i.e., pristanic acid, have been shown to undergo initial β-oxidation in peroxisomes followed by transfer to the mitochondria for their final cycles of β-oxidation (Figure 2) [15, 17]. Considering the structural similarities between the 2-methyl-branched fatty acids and the phytyl tail of α-tocopherol (Figures 1 and 2), we were interested to determine the in vivo role, if any, of peroxisomes and mitochondria in α-tocopherol β-oxidation.
Previously we demonstrated that 3 daily subcutaneous (SQ) α-tocopherol injections (10 mg /100 g body wt) increased hepatic 13′-OH-α-tocopherol and α-CEHC levels more than 20-fold, indicating that the liver increased α-tocopherol metabolism to prevent accumulation of α-tocopherol [4]. However the regulatory mechanisms by which α-tocopherol metabolism and excretion are controlled have not been determined. Increased hepatic α-CEHC levels could, theoretically, play a role in up-regulating pathways to prevent hepatic accumulation of α-tocopherol. At the time of these studies α-CEHC was not commercially available. Trolox is a compound containing a α-tocopherol ring structure and a truncated side chain just one carbon shorter than that of α-CEHC (Figure 1). Trolox is excreted without metabolism of the side chain making it an excellent analog for α-CEHC. Thus, as an additional control we injected rats with trolox to determine if elevated hepatic levels of a α-CEHC analog would alter the hepatic metabolism and/or accumulation of α-tocopherol in the absence of excess hepatic α-tocopherol.
We hypothesized that 1) SC injection with high doses of α-tocopherol would lead to accumulation of α-tocopherol intermediates, as well as α-CEHC, in subcellular organelles, thus allowing the identification of the organelles involved in α-tocopherol ω- and β-oxidation and 2) SC injection with high doses of trolox would compete with α-tocopherol metabolites for metabolic and excretory pathways thus altering the hepatic metabolism and/or accumulation of α-tocopherol and/or α-tocopherol metabolites. To test these hypotheses, using our SC dosing regimen in rats, we measured α-tocopherol, trolox and α-tocopherol metabolites in liver, plasma and hepatic subcellular fractions.
Materials and methods
Reagents
Vital E-300 is a non-aqueous injectable form of d-α-tocopherol containing 300 IU RRR-α-tocopherol/ml compounded with 20% ethanol and 1% benzyl alcohol in an emulsified base (Schering-Plough Animal Health, Union, NJ). Trolox was obtained from Sigma (St. Louis, MO). HPLC-grade methanol, hexane, ethanol, and glacial acetic acid were obtained from Fisher (Fair Lawn, NJ). Antibodies were obtained as follows: anti-PMP70 and anti-VDAC1/Porin (Abcam, Cambridge, MA), and anti-CYP2B (US Biological, Swampscott, MA). Secondary antibodies were from Li-Cor Biosciences (Lincoln, NE). All other chemicals were obtained at reagent grade quality from suppliers.
Animal Studies
Animal protocols were approved by the Oregon State University Animal Care and Use Committee. Male Sprague-Dawley rats (Harlan Laboratories, Livermore, CA) 275–300 g, were maintained on a 12-h light/dark cycle; food (#8604, Harlan Teklad, Livermore, CA) containing 90 IU dl-α-tocopheryl acetate/kg diet, and water were given ad libitum. Rats were acclimated for 1 week prior to the start of injections. Based on our previous data demonstrating a 20-fold increase in hepatic α-tocopherol metabolite levels following 3 daily subcutaneous (SQ) α-tocopherol injections, rats (n = 6/group) received daily SQ injections of vehicle (saline), α-tocopherol (10 mg α-tocopherol/100 g body weight) or trolox (10 mg/100 g body weight) for 3 days. On day 4, following a 12 h fast and approximately 16 h after their last injection of α-tocopherol, rats were euthanized, blood was collected in EDTA and tissues were perfused with 0.9% saline (containing 2 U/ml heparin) using a perfusion catheter inserted into the heart. Livers were excised and aliquots frozen in liquid N2 and stored at −80°C. Plasma was obtained by centrifugation and stored at −80°C.
Preparation of Subcellular Fractions and Isolation of Peroxisomes
Subcellular fractions were isolated from livers (~10 g) by conventional differential centrifugation in sucrose followed by purification of peroxisomes using an Iodixanol (Optiprep) density barrier as described by the manufacturer (Application sheets S9 and S10, Axis-Shield, Oslo, Norway) and modified by Lamhonwah et al [18]. Samples were maintained on ice or at 4°C during all procedures and a protease inhibitor cocktail (Santa Cruz Biotechnology, Santa Cruz, CA) was added to all buffers just prior to use. Briefly, livers were weighed and homogenized in ice-cold buffer A (0.25M sucrose, 10mM MOPS-NaOH (pH 7.2), 1mM EDTA, 0.1% ethanol) using a Potter-Elvehjem-type homogenizer, a 2 ml aliquot was removed and stored at −80°C. The remaining homogenate was centrifuged at 1000 X g 10 min to remove nuclei and cell debris. The resulting 1000X supernatant was centrifuged at 4000 X g (10 min) to pellet the heavy mitochondrial fraction. The 4000X supernatant was centrifuged a second time, the two 4000X pellets were combined, washed with mitochondrial buffer (0.2 M mannitol, 70 mM sucrose, 1 mM EDTA, 10 mM HEPES, pH 7.4) and the resultant pellet suspended in mitochondrial buffer and stored at −80°C. The two 4000X supernatants per sample were combined, centrifuged at 17,000 X g (20 min), then the resulting 17,000X supernatents were removed and centrifuged a second time (17,000 X g, 20 min) to further eliminate peroxisomes, and any other contaminating organelles from the subsequent microsome prep, i.e., lysosomes and mitochondria. The final 17,000X supernatants were centrifuged at 120,000 X g (90 min). The 120,000X pellet was processed for isolation of microsomes as described [4]. Sedimentation of light lysosomes that could contaminate the 17,000 X g supernatant would require separation at a higher rate of centrifugation for a longer period of time, i.e., 150,000 X g (4 h, Sigma Technical Bulletin Lysis01). To isolate peroxisomes, the 17,000X pellets were washed in buffer A, centrifuged at 17,000 X g (15 min), the wash buffer was removed and the pellets were suspended in buffer A and combined with 47% Iodixanol (per manufacturer) to make a 27.5% iodixanol density solution that was then centrifuged at 200,000 X g (3 h). The resulting pellet was washed with buffer A and centrifuged at 20,000 X g (20 min), suspended in buffer A and stored at −80°C.
Purification of peroxisomes using a 27.5% Iodixanol density barrier as described above has been shown to give high yields of peroxisomes without discernable contamination with other organelles, particularly mitochondria and lysosomes due to differences in organelle density [18, 19]. Starting amounts of liver, volumes of buffer used for the initial homogenization of liver and volumes used to suspend fraction pellets, were documented and used, in combination with concentrations of α-tocopherol, α-CEHC, and 13′-OH-α-tocopherol, to calculate total α-tocopherol, α-CEHC, and 13′-OH-α-tocopherol levels in fractions and homogenates. Concentrations of α-tocopherol, α-CEHC, and 13′-OH-α-tocopherol in homogenates and fractions were determined as described below and are either expressed as total nmols per homogenate or fraction or as % of homogenate levels.
Characterization of Subcellular Fractions by Western Blot Analyses
Composition of subcellular fractions with respect to the presence of microsomes, mitochondria and peroxisomes was confirmed by western blot analysis using primary antibodies to PMP70 (peroxisomes), VDAC1/Porin (mitochondria), and CYP2B (microsomes). Total protein concentrations were determined by the method of Bradford, using Coomassie Plus reagent per the manufacturer (Pierce Biotechnology, Rockford, IL). Equal protein quantities of homogenates, and the subcellular fractions (microsomes, peroxisomes and mitochondria) were resolved by SDS-Page electrophoresis (Bis-Tris gels, Invitrogen, Carlsbad, CA) and transferred to polyvinylidene fluoride (PVDF) membranes (Invitrogen). Protein transfer and equal loading of sample proteins were confirmed by reversible staining of blots with 0.5% Ponceau-S red/1% acetic acid. Blots were blocked in Tris-buffered saline with 0.05% tween (TBST) and 3% non-fat milk (TBST/milk). Fresh TBST/milk containing primary antibody was added to the blots for overnight incubation at 4°C. Blots were washed with TBST and incubated with the appropriate near infrared fluorophore-conjugated secondary antibody (Li-Cor Biosciences, Lincoln, NE) for 45 min at room temperature, protected from light. Blots were again washed with TBST. Protein bands were detected and quantified using a Li-Cor® Odyssey® infrared imaging system and the analysis software provided (Li-Cor Biosciences).
Measurement of α-Tocopherol, Trolox, α-CEHC, and 13′-OH-α-Tocopherol
Tissue and plasma α-tocopherol concentrations were determined by a modification of the method described by Podda et al [20] using high performance liquid chromatography (HPLC) with electro-chemical detection and quantification by comparison to standard curves generated with authentic compounds. Concentrations in whole tissues are expressed per gram of tissue. For determination of α-tocopherol and 13′-OH-α-tocopherol in hepatic homogenates and subcellular fractions, aliquots were saponified, extracted and measured by a modified LC/MS method [21]. The HPLC system was coupled through a Turboion Spray source to a triple quadrupole mass spectrometer operated in negative mode (Applied Biosystems/MDS Sciex API 3000, Foster City, CA, USA). Analytes were detected using multiple reaction monitoring (MRM): α-tocopherol, m/z 429 to 163; 13′-OH-α-tocopherol, m/z 445 to 163; and α-tocotrienol (internal standard), m/z 423 to 163. α-Tocotrienol was found to be a valid internal standard as α-tocotrienol was not detectable in diluted extracts without its specific addition; moreover, ionization was similar to tocopherols.
Tissue, homogenate and subcellular fraction α-CEHC and trolox were extracted and analyzed by LC/MS (Micromass ZQ 2000 single-quadrupole mass spectrometer (Manchester, England), using an electrospray ionization source (capillary voltage 2.5 kV, cone voltage −30 V, desolvation temperature 150°C, desolvation gas (nitrogen) 160 L/hour, nebulizer gas (nitrogen) at 80 psi, and the cone gas (nitrogen) at 50 L/hr), as previously described [22]. α-CEHC and trolox m/z ratios were 277 and 249, respectively. For this assay trolox is used as the internal standard. For trolox injected animal samples, extracts with and without added internal standard were injected and compared for quantification.
Statistical Analysis
Statistical analysis was performed using Prism version 4.0 (Graphpad Software, San Diego, CA). Data were log transformed to account for differences in the variances between groups and analyzed by one-way ANOVA and a value of P < 0.05 was considered statistically significant. Post hoc tests were performed using Tukey’s Multiple Comparisons when overall group effects were found to be significant. Data are expressed as mean ± SE.
Results
Western Blot Analysis of Marker Proteins
To determine the purity of the subcellular fractions with respect to mitochondria, microsomes and peroxisomes, the presence of marker proteins for mitochondria (VDAC/porin), microsomes (CYP2B), and peroxisomes (PMP70) were determined by western analysis of the subcellular fractions (Table 1). Microsomes and peroxisomes were ≥95% free of marker proteins from other organelles. Mitochondria fractions contained 96% of the mitochondrial marker protein expression, however mitochondrial fractions also contained 7% of CYP2B1/2 (microsome marker) and 12% of PMP70 (peroxisome marker) expression. Purity of fractions did not differ between treatment groups.
Table 1. Presence of organelle marker proteins in subcellular fractions isolated from vehicle-, α-tocopherol- and trolox-injected rats1.
| Fraction | % CYP2B1/2 | % VDAC | % PMP70 |
|---|---|---|---|
| Microsomes | 88 | 42 | 0 |
| Mitochondria | 7 | 96 | 12 |
| Peroxisomes | 5 | 0 | 88 |
Rats received 3 daily SQ injections of vehicle, α-tocopherol (10 mg α-tocopherol/100 g body weight) or trolox (10 mg/100 g body weight), subcellular fractions were isolated from liver homogenates and microsome (CYP2B1/2), mitochondria (VDAC), and peroxisome (PMP70) marker proteins were quantified by western analysis as described in methods.
Marker protein expression in subcellular fractions is expressed as percent of total expression for each protein.
VDAC protein was present in the microsome fraction isolated from one α-tocopherol-injected rat.
Tissue and Plasma α-Tocopherol Concentrations
α-Tocopherol (10 mg RRR-α-tocopherol/100 g body wt), trolox (10 mg/100 g body wt) or vehicle (control), was administered daily to rats by SQ injection for 3 days, then rats were sacrificed on day 4, between 16 and 18 h following their last injection. Hepatic α-tocopherol concentrations increased 12.5-fold (P<0.01) in rats injected daily with α-tocopherol compared with levels in vehicle-injected (30 ± 3 nmol/g liver) or trolox-injected rats (29± 4 nmol/g liver) (Figure 3). Plasma α-tocopherol concentrations increased 6-fold following α-tocopherol injections, but were unchanged by trolox injections, compared to vehicle-injected rats (Figure 3).
Fig. 3.

Liver and plasma α-tocopherol concentrations in response to subcutaneous (SQ) vehicle, α-tocopherol or trolox injections. α-Tocopherol concentrations in (A) Liver and (B) Plasma. Rats (n = 6/group) received daily SQ injections of vehicle (saline), α-tocopherol or trolox for 3 days. On day 4, following a 12 h fast, rats were killed, blood collected and livers perfused with 0.9% saline (containing 2 U/ml heparin) using a perfusion catheter inserted into the heart. Livers were excised, aliquots frozen in liquid N2 and stored at −80°C. α-Tocopherol concentrations were determined as described in the methods. Liver α-tocopherol was determined per gram of liver and expressed here per total liver in order to facilitate comparison with homogenate and subfraction α-tocopherol levels (Figure 6) and determine recovery of liver α-tocopherol during the homogenation and subfractionation procedure. All values are expressed as mean ± SE, n = 6, with * = p < 0.01 as compared with vehicle-injected rats (see methods).
Plasma and Liver α-CEHC and Trolox Concentrations
To evaluate alterations in α-tocopherol metabolism, as well as the possible accumulation of metabolites, α-CEHC was determined in vehicle-, trolox- and α-tocopherol-injected rats. Following injections of α-tocopherol, plasma α-CEHC levels increased 16-fold (P<0.01) and liver α-CEHC increased 10-fold (P<0.01) compared with control plasma α-CEHC (0.064 ± 0.01 μM) and control liver α-CEHC (5.1 ± 0.9 nmol/liver) (Figure 4). In trolox-injected rats, trolox levels in plasma (2.2 ± 0.6 μM) and liver (15.8 ± 4.3 nmol/liver) were at comparable to α-CEHC levels in plasma and liver from α-tocopherol-injected rats. These latter data confirm the utility of SQ trolox injections to replicate the high levels of α-CEHC that occur in rats given daily pharmacologic doses of α-tocopherol, thus allowing determination of possible modulation of α-tocopherol metabolism by high α-CEHC levels in the absence of increased α-tocopherol. Liver and plasma α-CEHC levels were not altered by trolox injections, as compared with vehicle-injected rats (Figure 4).
Fig. 4.

Liver and plasma α-CEHC concentrations in response to SQ vehicle, α-tocopherol and trolox injections. α-CEHC concentrations in (A) Liver and (B) Plasma were determined from SQ vehicle-, α-tocopherol and trolox-injected rats, as described in Figure 3 and the methods. Liver α-CEHC was determined per gram of liver and expressed here per total liver in order to facilitate comparison with homogenate and subfraction α-CEHC levels (Figure 7) and determine recovery of liver α-CEHC during the homogenation and subfractionation procedure. All values are expressed as mean ± SE, n = 6, with * = p < 0.01 as compared with vehicle-injected rats (see methods).
α-Tocopherol and α-Tocopherol Metabolite Concentrations in Subcellular Fractions
We were interested to identify the subcellular location of the ω-hydroxylation and β-oxidation steps in α-tocopherol metabolism, as well as to evaluate the ability of large doses of either α-tocopherol or trolox to alter the subcellular localization of α-tocopherol metabolism. Thus, rats were given 3 daily injections of vehicle, trolox or α-tocopherol, then livers were removed and α-tocopherol, 13′-OH-α-tocopherol, α-CEHC, and trolox levels were determined for the liver homogenates and the mitochondria, microsome and peroxisome fractions.
Recovery of liver α-tocopherol in liver homogenates was 94 ± 6.0% for all treatments. A portion of the α-tocopherol present in the hepatic homogenates would be expected to be present in the plasma and nuclear membranes sedimented in the 1000X pellet, as well as in the lysosomes that sediment in the 17,000X pellet. Lysosomes and light mitochondria present in the 17,000X pellet do not pass through the 27.5% Iodixanol density barrier while peroxisomes pass through and pellet below the Iodixanol, thus allowing isolation of peroxisomes [18]. Overall recovery of total homogenate α-tocopherol in the combined microsome, mitochondria and peroxisome fractions was 93 ± 4% indicating a consistent and high level of recovery of both the organelles and the homogenate α-tocopherol during the fractionation process. There were no differences in overall recovery of homogenate α-tocopherol for the 3 treatment groups.
Following 3 daily α-tocopherol injections hepatic homogenate α-tocopherol levels increased 16-fold in α-tocopherol-injected rats compared with trolox- and vehicle-injected rats (Figure 5a). In livers from α-tocopherol-injected rats, total α-tocopherol levels increased 28-fold in the microsome fraction, while α-tocopherol levels in mitochondria and peroxisome fractions increased 8- and 3-fold, respectively (Figure 5a). In Figure 5b the microsome, mitochondria, and peroxisome α-tocopherol levels are expressed as the percentage of homogenate α-tocopherol (Figure 5b). These data show that as liver α-tocopherol levels increase, the percentage of the homogenate α-tocopherol isolated in the mitochondria and peroxisome fractions decreased 2- and 5-fold, respectively, compared to the percentage of homogenate α-tocopherol isolated from the respective control fractions (P<0.05). In contrast, the percentage of homogenate α-tocopherol isolated in the microsome fraction increased nearly 2-fold (P<0.05) in α-tocopherol-injected rats compared to that isolated from the microsome fraction of controls (Figure 5b). Together these data indicate a greater partitioning of α-tocopherol to the microsome fraction with increasing liver α-tocopherol. This may be due to increased uptake and/or a decreased ability to move the α-tocopherol from the microsome to elsewhere in the cell.
Fig. 5.

Hepatic homogenate, microsome, mitochondria and peroxisome fraction α-tocopherol concentrations in response to SQ vehicle, α-tocopherol and trolox injections. (A) Total α-tocopherol and (B) Percent homogenate α-tocopherol levels determined for homogenates, microsomes, mitochondria and peroxisomes from SQ vehicle-, α-tocopherol and trolox-injected rats, as described in the methods. Total α-tocopherol is expressed as total nmol per homogenate or subfraction calculated using concentration of α-tocopherol (nmol/g), starting amount of liver (g), total volume of homogenate (ml), volume of homogenate used for fractionation (ml) and final volume used to suspend subfraction pellets. All values are expressed as mean ± SE, n = 6, with * = p < 0.01 as compared with vehicle-injected rats (see methods).
To identify the in vivo subcellular location of the first step in vitamin E metabolism, α-tocopherol ω-hydroxylation, 13′-OH-α-tocopherol levels were determined in liver homogenates, microsomes, mitochondria and peroxisomes. Following 3 daily α-tocopherol injections total 13′-OH-α-tocopherol levels increased in hepatic homogenates, microsomes, mitochondria and peroxisomes, as compared to the respective controls (P<0.01, Figure 6a). Hepatic microsome 13′-OH-α-tocopherol levels in α-tocopherol-injected rats were 7-fold higher than 13′-OH-α-tocopherol levels in either the mitochondria or peroxisome fractions isolated from α-tocopherol-injected rats (Figure 6a). In α-tocopherol-injected rats compared with controls, the percent of homogenate 13′-OH-α-tocopherol isolated in the microsome fraction more than doubled (P<0.001), while the percent of homogenate 13′-OH-α-tocopherol isolated in the mitochondria and peroxisome fractions remained unchanged at less than 5% (Figure 6b).
Fig. 6.

Hepatic homogenate, microsome, mitochondria and peroxisome fraction 13′-OH-α-Tocopherol levels in response to SQ vehicle, α-tocopherol and trolox injections. (A) Total 13′-OH-α-tocopherol and (B) Percent homogenate 13′-OH-α-tocopherol were determined from SQ vehicle-, α-tocopherol and trolox-injected rats, as described in the methods. Total 13′-OH-α-tocopherol is expressed as total nmol using concentration of 13′-OH-α-tocopherol (nmol/g), starting amount of liver (g), total volume of homogenate (ml), volume of homogenate used for fractionation (ml) and final volume used to suspend subfraction pellets. All values are expressed as mean ± SE, n = 6, with * = p < 0.01 as compared with vehicle-injected rats (see methods)
Following ω-hydroxylation, it has been proposed that 13′-OH-α-tocopherol undergoes several steps of β-oxidation to form the final product in α-tocopherol metabolism, α-CEHC. As discussed above, β-oxidation pathways are located in both the peroxisomes and mitochondria. To identify a putative subcellular location for α-tocopherol β-oxidation, α-CEHC levels were determined in hepatic homogenate, microsomes, mitochondria and peroxisomes from vehicle-, trolox- and α-tocopherol-injected rats.
Recovery of liver α-CEHC in liver homogenates was 93% ± 8% and did not significantly differ between treatment groups. Mitochondrial fractions contained 96 ± 6% of homogenate α-CEHC. Liver homogenate and mitochondrial α-CEHC levels increased 11-fold (P<0.01) and 13-fold (P<0.01), respectively, in α-tocopherol-injected rats compared with controls (4.23 ± 0.5 and 3.7 ± 0.5, respectively, Figure 7). Representative chromatograms of mitochondria and peroxisomes from vehicle and α-tocopherol-injected rats demonstrate α-CEHC in mitochondria, but not peroxisomes (Figure 8). α-CEHC was detected in all mitochondrial fractions of vehicle, trolox- and α-tocopherol-injected rats, while α-CEHC levels were below levels of detection in all peroxisome fractions irrespective of treatment group (Figure 7). α-CEHC was detected in the microsome fraction of one α-tocopherol-injected rat, while α-CEHC levels were below levels of detection in all other microsome fractions irrespective of treatment group (Figure 7). The presence of α-CEHC in the single microsome fraction was likely due to the presence of mitochondria as low VDAC (mitochondrial marker protein) expression was found in this single microsome fraction (Table 1). Peroxisome fractions were shown to be free of mitochondria in all treatment groups (Table 1). In trolox-injected rats, trolox levels in homogenates were 17 ± 6 nmol/liver, indicating ~100% recovery of total liver trolox. However, trolox concentrations in all subcellular fractions isolated from trolox-injected rats were below levels of detection.
Fig. 7.

Hepatic homogenate, microsome, mitochondria and peroxisome fraction α-CEHC levels in response to SQ vehicle, α-tocopherol and trolox injections. Total α-CEHC is expressed as total nmol calculated using concentration of α-CEHC (nmol/g), starting amount of liver (g), total volume of homogenate (ml), volume of homogenate used for fractionation (ml) and final volume used to suspend subcellular fraction pellets. All values are expressed as mean ± SE, n = 6, with * = p < 0.01 as compared with vehicle-injected rats (see methods).
Fig. 8.
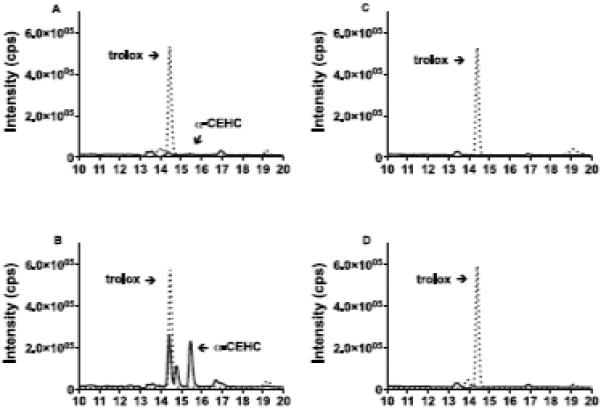
Single-quadrupole mass spectral data of α-CEHC in mitochondria and peroxisomes in response to SQ vehicle and α-tocopherol injections. Trolox was added to subcellular fraction samples from vehicle and α-tocopherol injected rats as an internal standard (see methods). α-CEHC and trolox (internal standard) in (A) a representative mitochondrial sample from a vehicle-injected rat, (B) a representative mitochondrial sample from an α-tocopherol-injected rat, (C) a representative peroxisome sample from a vehicle-injected rat and (D) a representative peroxisome sample from an α-tocopherol-injected rat. α-CEHC and trolox were determined by a single-quadrupole LC/MS using an electrospray ionization source, as described in the methods. α-CEHC (mass-to charge ratio (m/z) 277) retention time = 15.42 - 15.46 (solid line). Trolox (m/z 249) retention time = 14.4 - 14.45 (dashed line).
Similar to liver and plasma, trolox did not alter α-tocopherol, 13′-OH-α-tocopherol, or α-CEHC levels in liver homogenates, nor did it alter the distribution of either α-tocopherol or α-tocopherol metabolites among the subcellular fractions (Figures 5-7).
Discussion
In the current study we have used SQ injected α-tocopherol in rats to identify the subcellular location of α-tocopherol ω-hydroxylation and β-oxidation. Importantly, our data indicates that as liver α-tocopherol increases 1) there is a greater partitioning of α-tocopherol to the microsomes, as compared to peroxisomes or mitochondria and 2) microsome 13′-OH-α-tocopherol levels increase sharply, and to a much greater degree than 13′-OH-α-tocopherol levels in mitochondria or peroxisome fractions of the same liver. These data support earlier in vitro data indicating a key role for microsomes in α-tocopherol ω-hydroxylation in vivo.
Trolox, a structural analog of α-CEHC, was taken up by the liver and ~100% of the liver trolox was recovered in the liver homogenates. However, trolox concentraitons were below levels of detection in all subcellular fractions, indicating that trolox is not taken up by microsomes, peroxisomes or mitochondria. These data suggest that α-CEHC found in the subcellular fractions is not the result of uptake of α-CEHC produced elsewhere in the cell.
To our knowledge α-CEHC, the final product of α-tocopherol β-oxidation, has not previously been determined in hepatic subcellular fractions, nor have the enzymes involved in α-tocopherol β-oxidation been identified. Even so, the accepted paradigm in the literature is that α-tocopherol β-oxidation occurs exclusively in the peroxisomes [14-16]. Hence our finding that α-CEHC is localized to the mitochondria, not the peroxisomes, is highly significant as it indicates that α-tocopherol β-oxidation does not occur exclusively in peroxisomes, but rather mitochondria are responsible for the final step(s) in α-tocopherol β-oxidation. The presence of α-CEHC exclusively in the mitochondrial fraction was true in animals supplemented and not supplemented with α-tocopherol, thus mitochondria play a role in α-tocopherol β-oxidation at both basal dietary and high hepatic levels of α-tocopherol.
In order for tocopherols to enter the β-oxidation pathway of either peroxisomes or mitochondria the side chain must undergo ω-hydroxylation to form a 13′-hydroxyl group at the end of the phytyl tail. This terminal hydroxyl group would need to be converted to an aldehyde and then a carboxylic acid. Enzymes capable of catalyzing these reactions are located in the endoplasmic reticulum and cytoplasm [23]. Once converted to a carboxylic acid the tocopherol tail would structurally resemble a 2-methyl-branched fatty acid, i.e., pristanic acid (Figures 1 and 2). The next step would be activation to an acyl-CoA ester followed by β-oxidation.
Peroxisomal enzymes have high activity toward medium and long branched chain acyl-CoAs [16], while mitochondrial β-oxidation enzymes have low activity [23]. However, peroxisomal acyl-CoA-oxidases show very low activity towards short chain substrates [23, 24]. Thus, very long chain fatty acids and 2-methyl-branched fatty acids initially undergo one or more cycles of β-oxidation in peroxisomes and then are either hydrolyzed to free acids by peroxisomal thioesterases or transesterified to carnitine esters by enzymes present in the peroxisomes. The resulting products are then exported from the peroxisome, the free fatty acids are esterified with carnitine, and the carnitine esters are imported by the mitochondria where further rounds of β-oxidation occur (Figure 2), as reviewed in [15, 16].
Based on our findings and the structural similarities between the 2-methyl-branched fatty acids and the phytyl tail of tocopherols, we propose that α-tocopherol β-oxidation, as well as β-oxidation of other tocopherols, utilizes the same enzymatic pathway as the 2-methyl-branched fatty acids. Accordingly, once converted to the carboxylic acid, tocopherols would undergo 2 cycles of peroxisomal β-oxidation utilizing enzymes known to β-oxidize 2-methyl-branched fatty acids, followed by 3 cycles of β-oxidation in the mitochondria, again utilizing the 2-methyl-branched fatty acid β-oxidation pathway (Figure 9). Conversely, our data does not exclude a model in which the mitochondria are exclusively responsible for α-tocopherol β-oxidation.
Fig. 9.

Proposed pathway of α-tocopherol metabolism in which both peroxisomes and mitochondria play a role
Similar to α-tocopherol, the subcellular location of β-oxidation of other forms of vitamin E, including γ-tocopherol, has not been identified. However, sulfated metabolic intermediates of γ-tocopherol have been identified in the livers of rats supplemented with mega doses of γ-tocopherol [25]. The presence of sulfated intermediates is not easily explained in a model of exclusive peroxisomal β-oxidation in which tocopherols would be expected to remain in the peroxisomes until fully metabolized to CEHC. On the other hand, in our proposed model of tocopherol metabolism, specific γ-tocopherol intermediates may accumulate in the cytoplasm as they move from the peroxisomes to the mitochondria. Cytoplamic sulfotransferase enzymes may then catalyze sulfation of the intermediates to increase their solubility and allow excretion, thus preventing accumulation of γ-tocopherol intermediates. Sulfated metabolic intermediates of α-tocopherol have not to date been identified in vivo, nor were we able to identify sulfated metabolic intermediates of α-tocopherol in the current study (Leonard, S. et al unpublished data). Hence, further studies are needed to fully elucidate the complete metabolic pathway of other forms of vitamin E, as well as α-tocopherol, under conditions of both basal and elevated intakes.
We previously demonstrated that daily SQ α-tocopherol injections (10 mg /100 g body wt) significantly increased hepatic 13′-OH-α-tocopherol and α-CEHC levels indicating that the liver was able to up-regulate α-tocopherol metabolism to prevent accumulation of “excess” α-tocopherol [4]. To test the hypothesis that increased hepatic α-tocopherol metabolite levels may play a role in up-regulating pathways to prevent the accumulation of α-tocopherol and its metabolites we injected rats daily with trolox (10 mg /100 g body wt), an analog of α-CEHC with a side chain just one carbon shorter than α-CEHC (Figure 1). However, elevated hepatic levels of trolox did not alter the hepatic levels α-tocopherol or α-tocopherol metabolites, nor did it alter the subcellular distribution of hepatic α-tocopherol or α-tocopherol metabolites. These data suggest that elevated hepatic α-CEHC does not alter α-tocopherol metabolism or that trolox is not a good analogue for studies of metabolism given its shorter tail.
In conclusion, SQ α-tocopherol injections increase hepatic microsome α-tocopherol levels to a greater degree than either mitochondria or peroxisome α-tocopherol levels suggesting a greater partitioning of α-tocopherol to the microsomes with increasing hepatic α-tocopherol. 13′-OH-α-Tocopherol was also selectively increased in the microsome fraction with increased hepatic α-tocopherol. Together these data (1) support the hypothesis that microsomes are responsible for the ω-hydroxylation of α-tocopherol and (2) suggest mechanisms are in place to selectively distribute α-tocopherol to the microsomes under conditions of elevated hepatic α-tocopherol, thus facilitating increased metabolism.
An important and unexpected finding of this study is that α-CEHC is not detectable in the hepatic peroxisome fraction but rather α-CEHC is localized to the mitochondrial fraction. Thus our data is the first to indicate a role for mitochondria in α-tocopherol β-oxidation. We propose that α-tocopherol β-oxidation utilizes the 2-methyl-branched chain β-oxidation pathway that includes enzymes located in both peroxisomes and mitochondria. Further elucidation of the specific metabolic enzymes and hepatic transporters involved in the regulation of α-tocopherol levels, as well as the ability of α-tocopherol to modulate its own metabolism and/or the metabolism and excretion of pharmaceutical drugs and environmental toxins, are needed in order that α-tocopherol supplements may be used with optimal health benefits, while avoiding possible adverse effects.
Acknowledgements
This work was supported by a grant to MGT (NIH ODS and DK 067930).
Abbreviations
- α-CEHC
2,5,7,8-tetramethyl-2-(2′-carboxyethyl)-6-hydroxychroman
- CYP
cytochrome P450
- αTTP
α-tocopherol transfer protein
- SQ
subcutaneous
- TBS
tris-buffered saline
Footnotes
Publisher's Disclaimer: This is a PDF file of an unedited manuscript that has been accepted for publication. As a service to our customers we are providing this early version of the manuscript. The manuscript will undergo copyediting, typesetting, and review of the resulting proof before it is published in its final citable form. Please note that during the production process errors may be discovered which could affect the content, and all legal disclaimers that apply to the journal pertain.
References
- [1].Ford ES, Ajani UA, Mokdad AH. Brief communication: The prevalence of high intake of vitamin E from the use of supplements among U.S. adults. Ann Intern Med. 2005;143:116–120. doi: 10.7326/0003-4819-143-2-200507190-00010. [DOI] [PubMed] [Google Scholar]
- [2].Bjelakovic G, Nikolova D, Simonetti RG, Gluud C. Antioxidant supplements for prevention of gastrointestinal cancers: a systematic review and meta-analysis. Lancet. 2004;364:1219–1228. doi: 10.1016/S0140-6736(04)17138-9. [DOI] [PubMed] [Google Scholar]
- [3].Miller ER, 3rd, Paston-Barriuso R, Dalal D, Riemersma RA, Appel LJ, Guallar E. Meta-analysis: high-dosage vitamin E supplementation may increase all-cause mortality. Ann Intern Med. 2005;142:37–46. doi: 10.7326/0003-4819-142-1-200501040-00110. [DOI] [PubMed] [Google Scholar]
- [4].Mustacich DJ, Leonard SW, Devereaux MW, Sokol RJ, Traber MG. α-Tocopherol regulation of hepatic cytochrome P450s and ABC transporters in rats. Free Radic Biol Med. 2006;41:1069–1078. doi: 10.1016/j.freeradbiomed.2006.06.022. [DOI] [PubMed] [Google Scholar]
- [5].Stahl W, Graf P, Brigelius-Flohe R, Wechter W, Sies H. Quantification of the alpha- and gamma-tocopherol metabolites 2,5,7,8-tetramethyl-2-(2′-carboxyethyl)-6-hydroxychroman and 2,7,8-trimethyl-2-(2′-carboxyethyl)-6-hydroxychroman in human serum. Anal Biochem. 1999;275:254–259. doi: 10.1006/abio.1999.4312. [DOI] [PubMed] [Google Scholar]
- [6].Birringer M, Drogan D, Brigelius-Flohe R. Tocopherols are metabolized in HepG2 cells by side chain omega-oxidation and consecutive beta-oxidation. Free Radic Biol Med. 2001;31:226–232. doi: 10.1016/s0891-5849(01)00574-3. [DOI] [PubMed] [Google Scholar]
- [7].Sontag TJ, Parker RS. Cytochrome P450 omega-hydroxylase pathway of tocopherol catabolism: Novel mechanism of regulation of vitamin E status. J. Biol. Chem. 2002;277:25290–25296. doi: 10.1074/jbc.M201466200. [DOI] [PubMed] [Google Scholar]
- [8].Sontag TJ, Parker RS. Influence of major structural features of tocopherols and tocotrienols on their omega-oxidation by tocopherol-omega-hydrolase. J Lipid Res. 2007;48:1090–1098. doi: 10.1194/jlr.M600514-JLR200. [DOI] [PubMed] [Google Scholar]
- [9].Birringer M, Pfluger P, Kluth D, Landes N, Brigelius-Flohe R. Identities and differences in the metabolism of tocotrienols and tocopherols in HepG2 cells. J Nutr. 2002;132:3113–3118. doi: 10.1093/jn/131.10.3113. [DOI] [PubMed] [Google Scholar]
- [10].Harrington DJ, Booth SL, Card DJ, Shearer MJ. Excretion of the urinary 5C- and 7C-aglycone metabolites of vitamin K by young adults responds to changes in dietary phylloquinone and dihydrophylloquinone intakes. J Nutr. 2007;137:1763–1768. doi: 10.1093/jn/137.7.1763. [DOI] [PubMed] [Google Scholar]
- [11].Ross AB, Åmen P, Kamal-Eldin A. Identification of cereal alkylresorcinol metabolites in human urine—potential biomarkers of wholegrain wheat and rye intake. J. Chroma. 2004;809:125–130. doi: 10.1016/j.jchromb.2004.06.015. [DOI] [PubMed] [Google Scholar]
- [12].Borst P, Elferink RO. Mammalian ABC transporters in health and disease. Annu Rev Biochem. 2002;71:537–592. doi: 10.1146/annurev.biochem.71.102301.093055. [DOI] [PubMed] [Google Scholar]
- [13].Mustacich DJ, Gohil K, Bruno RS, Yan M, Leonard SW, Ho E, Cross CE, Traber MG. Alpha-tocopherol modulates genes involved in hepatic xenobiotic pathways in mice. J. Nutr. Biochem. 2008 doi: 10.1016/j.jnutbio.2008.05.007. [DOI] [PMC free article] [PubMed] [Google Scholar]
- [14].Mannaerts GP, van Veldhoven PP. Functions and organization of peroxisomal beta-oxidation. Ann N Y Acad Sci. 1996;804:99–115. doi: 10.1111/j.1749-6632.1996.tb18611.x. [DOI] [PubMed] [Google Scholar]
- [15].Poirier Y, Antonenkov VD, Glumoff T, Hiltunen JK. Peroxisomal β-oxidation - A metabolic pathway with multiple functions. Biochim Biophys Acta. 2006;1763:1413–1426. doi: 10.1016/j.bbamcr.2006.08.034. [DOI] [PubMed] [Google Scholar]
- [16].Wanders RJA, Waterham HR. Biochemistry of mammalian peroxisomes revisited. Annu. Rev. Biochem. 2006;75:295–332. doi: 10.1146/annurev.biochem.74.082803.133329. [DOI] [PubMed] [Google Scholar]
- [17].Verhoeven NM, Jakobs C. Human metabolism of phytanic acid and pristanic acid. Prog lipid Res. 2001;40:453–466. doi: 10.1016/s0163-7827(01)00011-x. [DOI] [PubMed] [Google Scholar]
- [18].Lamhonwah AM, Skaug J, Scherer SW, Tein I. A third human carnitine/organic cation transporter (OCTN3) as a candidate for the 5q31 Crohn’s disease locus (IBD5) Biochem Biophys Res Commun. 2003;301:98–101. doi: 10.1016/s0006-291x(02)02946-7. [DOI] [PubMed] [Google Scholar]
- [19].Van Veldhoven PP, Baumgart E, Mannaerts GP. Iodixanol (Optiprep), an improved density gradient medium for the iso-osmotic isolation of rat liver peroxisomes. Anal Biochem. 1996;237:17–23. doi: 10.1006/abio.1996.0194. [DOI] [PubMed] [Google Scholar]
- [20].Podda M, Weber C, Traber MG, Packer L. Simultaneous determination of tissue tocopherols, tocotrienols, ubiquinols and ubiquinones. J. Lipid Res. 1996;37:893–901. [PubMed] [Google Scholar]
- [21].Vaule H, Leonard SW, Traber MG. Vitamin E delivery to human skin; studies using deuterated α-tocopherol measured By APCI LC-MS. Free Radic. Biol. Med. 2004;36:456–463. doi: 10.1016/j.freeradbiomed.2003.11.020. [DOI] [PubMed] [Google Scholar]
- [22].Leonard SW, Gumpricht E, Devereaux MW, Sokol RJ, Traber MG. Quantitation of rat liver vitamin E metabolites by LC-MS during high-dose vitamin E administration. J Lipid Res. 2005;46:1068–1075. doi: 10.1194/jlr.D400044-JLR200. [DOI] [PubMed] [Google Scholar]
- [23].Reddy JK, Hashimoto T. Peroxisomal β-oxidation and peroxisome proliferator-activated receptor α: an addaptive metabolic system. Annu. Rev. Nutr. 2001;21:193–230. doi: 10.1146/annurev.nutr.21.1.193. [DOI] [PubMed] [Google Scholar]
- [24].Wanders RJ, Waterham HR. Biochemistry of mammalian peroxisomes revisited. Annu Rev Biochem. 2006;75:295–332. doi: 10.1146/annurev.biochem.74.082803.133329. [DOI] [PubMed] [Google Scholar]
- [25].Freiser H, Jiang Q. {gamma}-Tocotrienol and {gamma}-tocopherol are primarily metabolized to conjugated 2-({beta}-carboxyethyl)-6-hydroxychroman and sulfated long-chain carboxychromanols in rats. J Nutr. 2009 doi: 10.3945/jn.108.103309. [DOI] [PMC free article] [PubMed] [Google Scholar]