Abstract
Realistic surgical simulation requires incorporation of the mechanical properties of soft tissue in mathematical models. In actual deformation of soft-tissue during surgical intervention, the tissue is subject to tension, compression, and shear. Therefore, characterization and modeling of soft-tissue in all these three deformation modes are necessary. In this paper we applied two types of pure shear test, unconfined compression and uniaxial tension test to characterize porcine liver tissue. Digital image correlation technique was used to accurately measure the tissue deformation field. Due to gravity and its effect on the soft tissue, a maximum stretching band was observed from the relative strain field on sample undergoing tension and pure shear test. The zero strain state was identified according to the position of this maximum stretching band. Two new constitutive models based on combined exponential/logarithmic and Ogden strain energy were proposed. The models are capable to represent the observed non-linear stress–strain relation of liver tissue for full range of tension and compression and also the general response of pure shear.
Keywords: Soft tissue modeling, Liver tissue, Mechanical properties, Pure shear test, Nonlinear elasticity, Surgical simulation
INTRODUCTION
Understanding the mechanical behavior of very soft tissue, such as liver, brain, kidney and prostate, is necessary for developing realistic mathematical models that can be used for computer simulations in surgical planning and training systems. The mechanical properties of very soft tissues, i.e., tissues that do not bear mechanical loads, have only been extensively investigated over the last decade. Most of the reported experiments and models for the very soft tissues under finite deformation were focused on compression,24,30 indentation,1,7,19 uniaxial tension,5,6,25 and aspiration 17,27 test. The published result for the shear properties of the very soft tissues under finite deformation were limited. A punching-shear test on the porcine kidney cortex tissue was reported,10 but the information of strain was missing and the boundary conditions were not cleared defined. The impact type of simple shear test on human liver tissue was also reported.31 Since for a general surgical simulation, various loading states are involved, to develop a realistic soft tissue model would require characterization of soft-tissue in various deformation modes and under low strain rate, which is typical in surgery.
Pure shear, also referred to as planar tension, is one of the most commonly recommended tests for characterization of rubber and elastomer.4,28 Simple shear test, however, is to date the most commonly used method to measure shear properties of biological tissues. Torsional tests have been reported to measure dynamic shear modulus of soft tissue under small strain.32,33 Theoretically, a simple shear state can be transferred to a pure shear state (in which the specimen sides remain aligned with the directions of the principal stresses) by a rotation of axes. Technically, the two tests have different characteristics and are suited for different applications. For example, simple shear test was used to measure the in-plane shear properties of planar soft tissues.14,15 Simple shear test has also been reported to test very small samples, such as 3 mm × 3 mm × 3 mm passive ventricular myocardium extracted from pig hearts.8,9 The pure shear test is like a very wide tension test. The most significant aspect of pure shear test is that the specimen is much shorter in the direction of stretching than in the direction of width. The length scale we are interested in for porcine liver tissue ranges from a few mm to 200 mm. Therefore the requirement for the sample size can be easily satisfied. The advantage of pure shear test is that experimental setup is simple and reliable, and those for uniaxial tension and compression test can be used readily. To the best of the authors’ knowledge this is the first time that a pure shear test is used for characterization of biological tissues.
The mechanical properties of liver tissue are strain rate dependent.18,21,23,33 At a relative low strain rate, e.g. 0.05 s−1, however, the liver tissue has been reported to be relatively rate insensitive. Miller proposed a non-linear visco-elastic model for liver tissue based on Melvin’s in vivo experiments on Rhesus monkeys.23 The results showed that the contribution of time dependence for the experiments with the slowest strain rate, i.e. 0.2 s−1, is negligible. In Chui et al.,5 varying the strain rates from 0.003 to 0.6 s−1 did not have a significant effect on the stress–strain data for the compression and elongation experiments on porcine liver tissues. A indentation device was reported in Kerdok et al.21 to impose cyclic perturbations on the liver’s surface, inducing nominal strains up to 5% at frequencies from 0.1 to 200 Hz. The results on in vivo and ex vivo perfused porcine liver showed that the tissue behaved like a elastic spring at frequency below 40 Hz, corresponding to the maximum strain rate of 2 s−1. In this paper, all the compression, tension, and pure shear tests were conducted at nominal strain rate of 0.05 s−1, which is close to the strain rate of 0.01 s−1 reported as typical for neurosurgery.23
The very soft tissues do not bear mechanical loads except that due to gravity in its natural state. Because their stiffness is quite low at zero strain state, the deformation due to gravity can be significant. It is well known that stress–strain state on the tissue around the platen or clamps is complicated.2,15 The effect of gravity makes the deformation field non-uniform even on the central portion of the tissue in a tension, compression, or pure shear test. The digital image correlation technique was used to accurately measure the non-uniform strain on the liver tissue samples undergoing tension and pure shear tests.
In this paper, we present results of pure shear, unconfined compression and uniaxial tension tests for ex vivo porcine liver tissue undergoing finite deformation. The results showed that liver tissue behavior in one deformation mode is considerably different from its behavior in other modes; therefore, tissue constitutive models based on only one type of experiments 7,17,24,30 are not suitable for description of tissue behavior in general. There were two previous models based on both tension and compression test for very soft tissue. Miller and Chinzei were one of the first to study very soft tissue properties in tension.25 They proposed a viscoelastic model based on the generalization of the Ogden strain energy for brain tissue with strain up to 30% in compression and tension. Chui et al.5 proposed a new constitutive formulation that combined logarithmic and polynomial strain energy in modeling the combined compression and elongation experiments for liver tissue. These two previous models had limitations in representing very soft tissues: Ogden’s model had not been reported to represent the dramatic increase of stress at large strain for both tension and compression. Chui’s model is based on the polynomial form, and therefore inherits its difficulties in representing multi-modal deformation. After rigorous mathematical description of the theoretical framework, we propose two new constitutive models based on a combined exponential/logarithmic and Ogden strain energy functions. We demonstrate that the proposed model describes well the liver tissue behavior under different deformation modes and large strain. The rest of the paper is organized as follows. In “Materials and Methods” section, we describe the materials and methods used to conduct the experiments as well as theories to model liver tissue under tension, compression, and pure shear. In “Results” section, we present the results from our experimental work and theoretical models. Finally, in “Conclusions and Discussion” section, we make concluding remarks about this paper.
MATERIALS AND METHODS
Ex Vivo Experiments of Porcine Liver Tissue
Specimen Preparation
Twelve fresh porcine livers were collected from a slaughter house and kept frozen in the laboratory. All tissue specimens were cut from frozen porcine liver and remained frozen until the time of the test. Careful attention was given to the orientation of the tissue samples. The samples were extracted perpendicular to the top surface of the livers and tested in that direction. The liver outer layer of membrane (capsule) was carefully removed. Samples with large blood vessels or obvious pores were discarded in the experiments, so that the properties of the tissue in the regions that were largely homogeneous were measured. Since the structural unit of liver, the hepatic lobule, is roughly 1–2 mm in size,16 the sample side length was chosen in the range of 7–63 mm, to ensure that the tissue property was relatively uniform throughout the specimen volume and the average response of the tissue as a homogeneous continuum was measured.
The samples for the tension and pure shear tests were in the shape of rectangular prism and cut from a partially thawed liver by using a long blade knife. The tissue thawed and deformed locally upon contacting the knife. The angle between two adjacent faces of the prism was difficult to be precise as 90°. Therefore, the dimensions of opposite faces of the samples could be differed by 1–2 mm. The samples were then individually wrapped in Saran Wrap and kept in freezer overnight until the tests were to be performed. The height of the sample for tension test was approximately 25 mm, while the width and thickness was approximately 15–17 mm. The width of the sample for pure shear test was approximately 50–63 mm. The thickness was approximately 7–11 mm, and the height was approximately 13–15 mm. The dimensions of the frozen samples were measured before the test. Each dimension of a sample was measured at three different locations by using a Vernier caliper and the average value was recorded. For compression test cylindrical samples were cut by using a aluminum pipe (25.4 mm diameter) with sharp edge. The faces of the cylindrical liver specimens were trimmed manually. The diameter of a sample was ~25.4 mm. The height was in the range of 9–17 mm.
There are several reasons for freezing the fresh liver first and testing the thawed tissue samples. Besides the obvious convenience for storage, an important reason is to be able to cut the sample from a partially frozen liver into the required shape and size while avoiding excessive pre-strain in the tissue. Because the very soft tissue deforms non-uniformly under gravity, it is almost impossible to cut a sample which has a regular shape for a stress-free state and measure the stress-free sample size, which is a prerequisite for a well-defined ex vivo test. There does not exist sufficient information to prove that the frozen liver tissue is in a homogeneous and isotropic state. However, the following experimental observations may provide some evidence to support this claim:
When the liver freezes, its volume increases due to high water content. Due to this expansion, the liver tissue is likely to be in a simple and homogeneous stress state. We measured the weight and volume of eleven porcine liver lobes (They were not from the previously mentioned twelve livers for the mechanical tests). The fresh, frozen, and thawed livers were immersed into water and the volume change of the water was measured by using a graduated cylinder. The average volume of the fresh and thawed liver lobes was used to compared with the frozen liver lobes. The measured volume increase due to freezing was 0.05 ± 0.03%. The average density of the liver was estimated to be 1.06 ± 0.03 g/cm3.
After thawing the frozen cylindrical samples (for compression tests), the height of the samples consistently decreased by about 15–30%. The height change due to volume change should be less than 2%. Hence the large reduction in height may be explained by assuming that the frozen liver tissue is homogeneous and that the effect of gravity on the frozen tissue can be neglected. After the tissue thawed, the sample deformed under gravity. Another factor that may also contribute to height change is that there was a small amount of water loss observed after the sample thawed.
Based on the above observation and consideration, we will assume the liver tissue to be homogeneous in the frozen state. The dimensions measured from the frozen samples were used as the dimensions for its stress-free state (volume decrease due to thermal expansion was neglected).
In Fung11 preconditioning is recommended for stabilizing the internal structure of the tissue and leading to interpretable results. Freezing may change the mechanical properties of soft tissue, so does the preconditioning. In this sense, freezing may be regarded as one type of preconditioning, because the experimental results from the thawed liver tissue were generally consistent, interpretable and no other preconditioning was applied. While the effect of freezing on the mechanical properties of spleen tissue has been reported to be negligible,7 the exact effect of freezing on the mechanical properties of liver tissue needs to be evaluated by some specially designed experiments and is not within the scope of this paper.
Experimental Setup
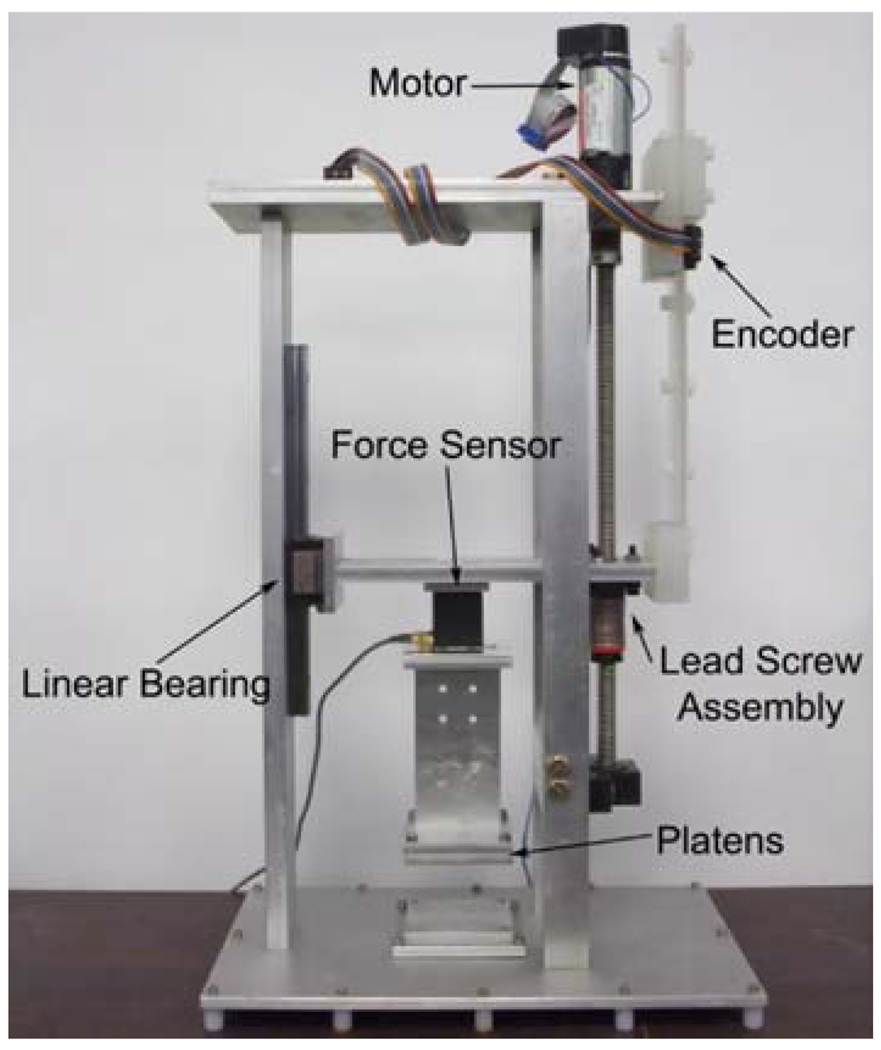
A test apparatus (see Fig. 1) has been designed and constructed to record force and displacement data in soft tissue tension, compression, and pure shear test. The device consists of a traveller attached to a lead screw assembly powered by a Maxon A-max 32 motor and Maxon GP32 planetary gearhead. The system also utilizes a US Digital linear encoder with 0.05 mm resolution per step. A force sensor is attached between the traveler and the equipment interacting with the tissue sample, which varies with the deformation mode and is described in detail in the following sections. During the pure shear and tension tests, a Transducer Techniques MDB-2.5 load cell, that allows measurement of vertical force in the range of 0.01–11 N, was utilized. For the compression test a JR3 6-axis force/torque sensor (max load 50 N) was used due to the higher range of forces. The entire device was controlled via a dSPACE DS1103 controller board (dSPACE, Inc.) which also recorded the force and displacement data.
FIGURE 1.
Experimental setup.
A Nikon digital camera D40X with the Nikon 18 mm-to-55 mm f/3.5-to-f/5.6 lens was used to capture the sequential images of the specimen undergoing deformation for the pure shear and tension tests. The 3872 × 2592 pixels colored images were acquired at 3 frames/s. A B + W polarizer was attached in front of the Nikon lens to reduce the reflection from the wet surface. A Sony digital video camera was also used to record the deformation process at 30 frames/s in the compression test.
Pure Shear Test
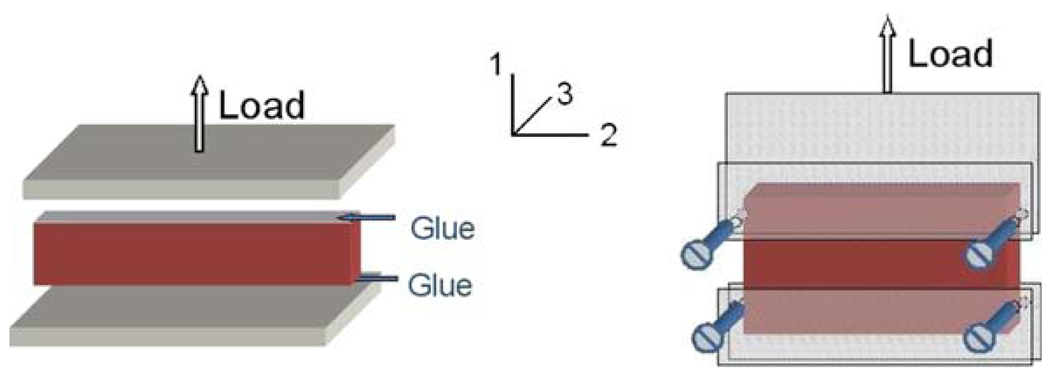
The most significant aspect of the pure shear (or planar tension) test is that the specimen is much shorter in the direction of stretching than in the width direction. The objective is to create an experiment where the specimen is constrained in the lateral direction such that all specimen thinning occurs in the thickness direction. Using the loading frame shown in Fig. 1, the planar tension tests were conducted in two different ways, as illustrated in Fig. 2. In the first setup, the frozen sample was attached to the platens by using glue (cyanoacrylate or Super Glue). The tissue close to the plates began to thaw after contacting with the glue and the plates. To assure proper attachment, the sample was compressed by approximately 2–3 mm toward the two platens when it was put on. In the second setup, the sample was held by two sets of custom-made clamps. The serrations inside the clamps provided a firm grasp to hold the tissue in place. Before the test, a frozen specimen was placed between the clamps by slightly tightening the screws. Water mist was sprayed onto the specimen surface. During the process of thawing, the two sets of screws in the clamps were tightened gradually to ensure uniform clamping prestrain and also enough gripping force to hold the tissue. The specimen was left for about 15–30 min to thaw at room temperature (~22 °C). The tests were performed at the nominal strain rate of 0.05 s−1, or roughly 0.65–0.75 mm/s, depending on the height of the samples or the testing area. The sprayed water mist may have some effect on the properties of the tissue, but due to the short period of testing time (t < 30 min), the potential influence was neglected.
FIGURE 2.
Schematic of the two types of pure shear test.
Unconfined Compression
The cylindrical tissue samples for the compression test were allowed to thaw in saran wrap and overturned several times prior to placement on the plates. This helped in maintaining the uniform shape of the sample prior to testing. The plates was covered with a thin layer of petroleum jelly to minimize friction between the plates and the tissue. The height of the sample before and after thawing was measured. A Sony digital video camera and the Nikon digital camera were used to obtain the image data from two perpendicular directions during the loading phase. The images were used to identify the samples that had uniformly expanded in radial directions.
Uniaxial Tension Test
As shown in Fig. 3, a frozen sample was attached to the bottom platen by using cyanoacrylate (Super Glue). The glue was then applied on the top of the sample. The upper plate of the testing apparatus was moved down slowly so that it touched the upper surface of the sample. To assure proper attachment, the tissue close to the two plates was compressed by approximately 1–2 mm toward the plates on each side. The specimen was left for about 15–30 min to thaw. Water mist was sprayed 2 or 3 times during that time. Upon completion of the thawing process the tension test was performed by moving the top platen at 1.25 mm/s, corresponding to the nominal strain rate of approximately 0.05 s−1. The tests were continued until the glue failed. Images of the deforming liver tissue samples in tension were acquired for later analysis.
FIGURE 3.
Schematic of the uniaxial tension and unconfined compression test.
Strain Measurement
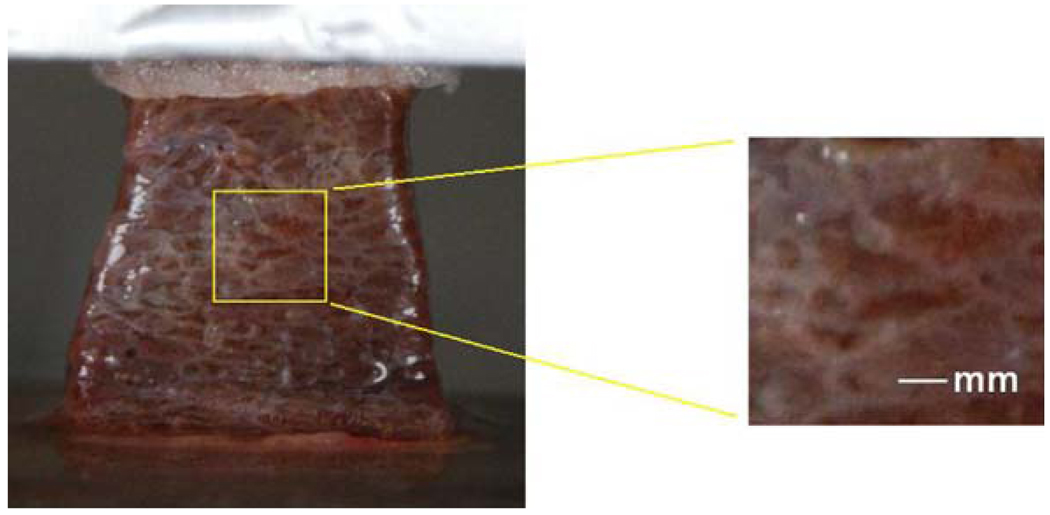
The hepatic lobules, in the size of 1–2 mm, are clearly defined by the connective tissue boundaries in a porcine liver (Fig. 4). These natural patterns on the liver tissue can be used for tracking the tissue deformation. In the tension and pure shear tests, water mist was sprayed after the sample was secured on the plates or clamps and also during the process of thawing. The white network of connective tissue started to show after the blood was diluted near the tissue surface. In the process of loading, the tissue surface roughness was slightly increased with stretching and so was the area of the patterns, therefore those patterns gradually became more distinguishable during the loading, which was desirable for the measurement. We used global digital image correlation (DIC) technique to track these patterns and calculate the strain field.12
FIGURE 4.
The image of a porcine liver tissue sample before the uniaxial tension test.
In the compression test, the front surface area decreased. Under current imaging condition (sample size, lens, camera resolution), the image of the natural textures quickly became less distinguishable in the loading direction, therefore DIC was not used to measure strain for the unconfined compression test.
Theories for Modeling of Liver Tissue
The length scale considered in a liver surgical simulation is roughly between 200 and 0.2 mm (the thickness of blade or diameter of needle), which is equal or less than the organ size and larger than the micro-structure dimensions. For this length scale, it is reasonable to treat the liver as continuum tissue with some macro-scale blood vessels inside and enclosed by capsule.17 Because of the high water content of liver tissue and its uniform histology across species, we can consider it to be incompressible, isotropic and homogeneous, especially for the length scale between 10 and 200 mm. If we assume the existence of a strain energy function and exclude the strain rate effect, the mechanical response of such materials can be described by a hyperelastic model.
Hyperelastic Strain Energy Functions for Isotropic Incompressible Material
Let X be the coordinate of a material point in the reference configuration and x its coordinate in the current configuration. The deformation gradient is given by
| (1) |
The right Cauchy–Green deformation tensor, C, is defined as
| (2) |
Since the symmetric tensor C is positive definite, by the spectral theorem, we have:
| (3) |
where N(A) is an eigenvector of C and is the eigenvalue. λ is also called principal stretch ratio. Relative to the zero stress reference configuration, the state of strain can be completely specified by the three principal stretches and the directions of the principal axes of strain. When the material is incompressible the constraint equation is:
| (4) |
which must be satisfied throughout the material.
Polynomial form of strain energy
For a isotropic, incompressible material, the strain energy function may be expressed as a function of strain invariants, given by:
| (5) |
| (6) |
The Mooney–Rivlin material is an example of a strain energy function with polynomial form of strain invariants I1 and I2. Equation (7) is the two-constant version of the energy function for the Mooney–Rivlin material
| (7) |
where C1 and C2 are material constants, and C1, C2 > 0. The simplest polynomial based energy function is the neo-Hookean model (the case where C2 = 0 in the Mooney–Rivlin model) and it is given by:
| (8) |
Ogden form of strain energy
Departing from the practice of writing the strain energy as a function of strain invariants I1 and I2, Ogden28 proposed a more general form of strain invariant for isotropic material,
| (9) |
where α is a real number, positive or negative. The Ogden form strain energy function can be written as:
| (10) |
where the Ck’s are constants and k is the number of terms included in the summation. Since I(α) is symmetric in principal stretches λ1, λ2 and λ3, the strain energy is also symmetric in the three principal stretches.
Compared with polynomial forms of models, Ogden model is mathematically more simple and provides an accurate representation of the mechanical response of rubber-like material for a large range of deformations.28
Hyperelastic Strain Energy Function for Bio-Tissues
In a typical single mode stress–strain curve of biological tissues, the initial low-stiffness toe region is followed by a region of higher stiffness. In order to represent this type of mechanical response, exponential or logarithmic functions were used. Exponential form of strain energy functions were proposed by Fung and used in Davies et al.,7 and Roan and Vemaganti30 to model spleen and liver tissues. A general form of exponential strain energy function can be written as5:
| (11) |
A combined logarithmic and polynomial form of strain energy is proposed by Chui et al.,5
| (12) |
Both strain energy functions would be good enough if only single mode of deformation, i.e., compression or tension, is present. The above functions were also used to model liver tissue in combined compression and elongation experiments.5 However, the strain energy functions in (11) and (12) are not capable of representing the three modes of deformation measured in this paper.
Combined Logarithmic/Exponential and Ogden Strain Energy Function for Very Soft Bio-Tissue
Ogden model has been reported to represent multi-axial deformations of brain tissue in small strain range.25 In order to account for the sharp increase of stiffness after the toe region, exponential or logarithmic functions are needed in the strain energy functions. Equation (13) and Equation (14) are our proposed combined energy functions for isotropic soft tissue material.
| (13) |
| (14) |
where C1, C2, C3, α1 and α2 are material constants to be determined by comparison of theory and experiment.
Constitutive Equations for Combined Logarithmic and Ogden Model
For incompressible material, the principal Cauchy stresses can be determined from:
| (15) |
Because the material is incompressible, the hydrostatic pressure p is decoupled from the deformation and has to be calculated directly from the equilibrium equations. Substituting (14) into (15), we have the principal Cauchy stresses for combined logarithmic and Ogden model as:
| (16) |
Uniaxial tension and compression
Let λ1 = λ be the stretch ratio in the direction of tension or compression, and σ1 = σ the corresponding principal Cauchy stress. The other two principal stresses are assumed to be zero, since no lateral forces are applied in the experiment. Because the material is incompressible, we have: . The stress can be expressed as:
| (17) |
and
| (18) |
Elimination of p from (17) and (18) yields
| (19) |
The nominal stress (defined as force per unit unstrained area of cross-section), is given by:
| (20) |
Pure shear
In pure shear test one of the principal stretch ratio is held fixed, λ2 = 1, say. Setting λ1 = λ and λ3 = λ−1, the stress–strain relations (16) reduces to:
| (21) |
and
| (22) |
The force per unit undeformed area of cross-section in the direction of extension is thus given by:
| (23) |
RESULTS
Experimental Results
Pure Shear Test
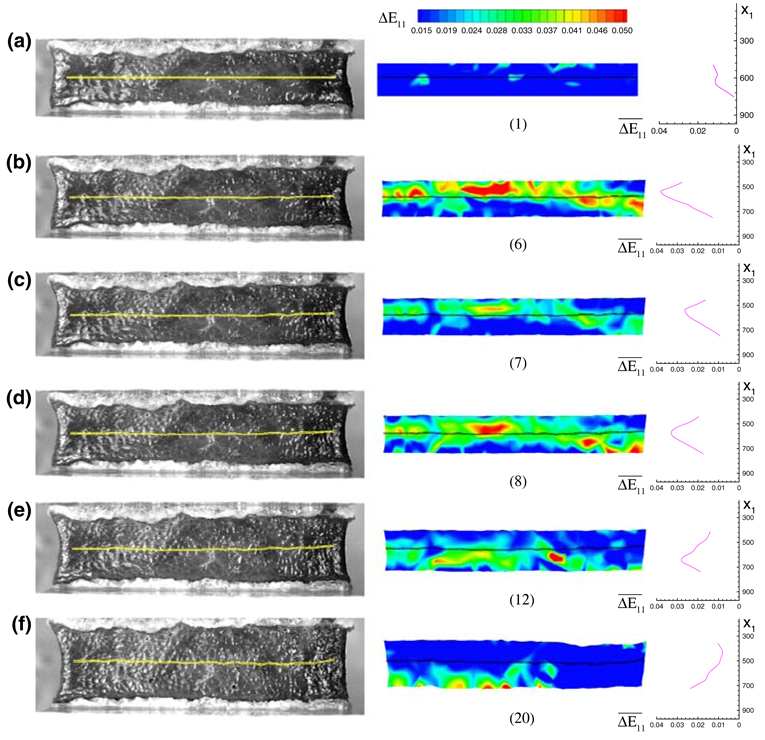
To calculate the stress–stretch curve for the pure shear test, we chose a thin region at the central portion of tissue on image 1, as shown in Fig. 5a. The deformed shape and position of that region was calculated from the result of DIC and superimposed on the corresponding images for Figs. 5b–5f. The tissue on image 1, which was the state just before the loading, was largely in compression due to two reasons: (1) gravitational force compressed the tissue; (2) the sample had been pressed a little when attached to the plates. Because of gravity, the deformation of the soft tissue was not uniform. The tissue on a lower part of the specimen was compressed more than that on the upper portion (see Fig. 4). With the top plate moving up, the tissue was getting into the tensile state gradually from top to bottom. If we assume that the tangent of the nominal stress–stretch curve is lowest when the tissue is close to the zero strain position and at the tensile side, we can expect there is a maximum stretching band and this band will moving downward as the loading is increased. The position of the zero strain state can be approximately determined by the position of this maximum stretching band.12 The maximum stretching band, which is corresponding to the peak incremental strain on the incremental strain field, can be seen from Figs. 5b–5e. ΔE11 is the incremental Lagrangian strain in the loading direction, or in other words, it is the Lagrangian strain of the tissue on a image with respect to the previous image. Because the incremental strain is small, this ΔE11 is approximately equal to the incremental engineering strain Δε11 and the incremental stretch ratio Δλ1. The curves on the right in Fig. 5 show the distribution of the incremental strain in the direction 1. is the average of the incremental strain along a material line (horizontal line on image 1). Image 7 (Fig. 5c) was chosen as the zero strain state for the thin region shown on the images. The average stretch ratio of all grids shown within that region was used to plot the stress–stretch curve for this sample. The relative force with respect to image 7 was divided by the cross-section area of the frozen sample to calculate the nominal stress. The detail of the method to estimate zero strain state was reported in Gao and Desai.12
FIGURE 5.
The image, incremental strain field ΔE11 and incremental strain distribution in the direction 1 for image 1, 6, 7, 8, 12 and 20. The maximum stretching band, corresponding to the peak incremental strain position, can be seen to move downward gradually from (b) to (f). The thin region chosen to calculate strain for the stress–stretch curve was superimposed on the images and the incremental strain field. x1 is the coordinate in the direction 1 for all the three plots in a row. The unit for coordinate is pixel.
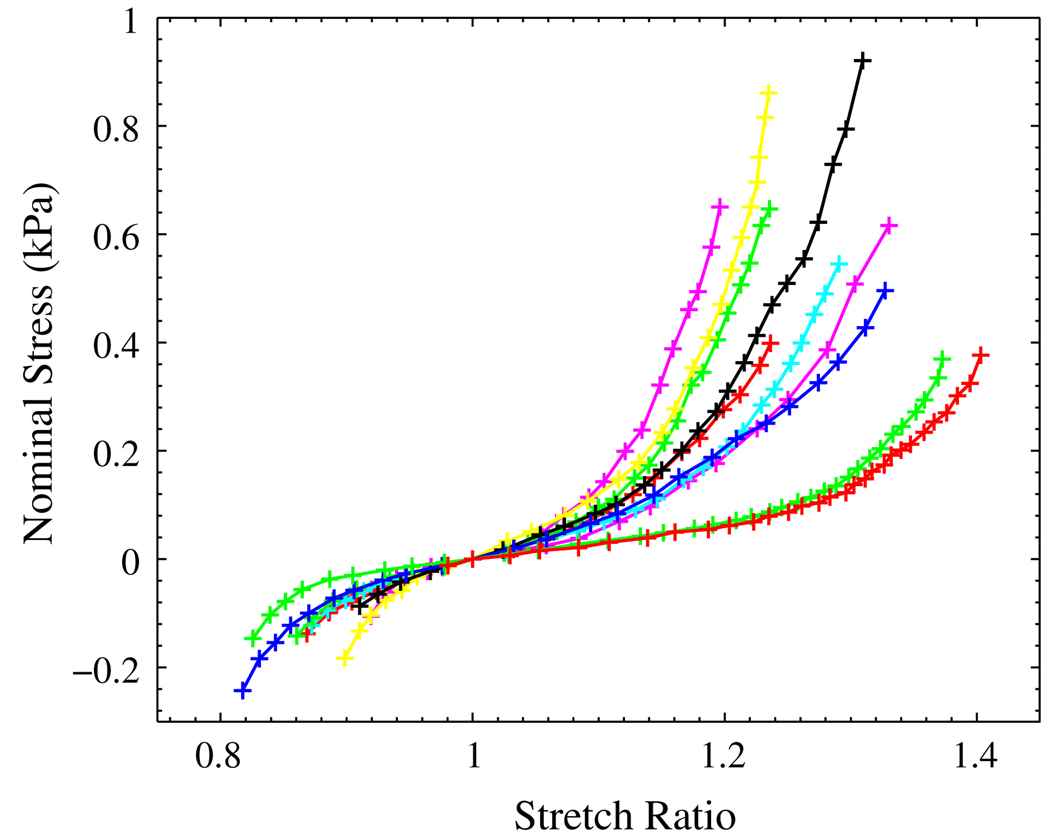
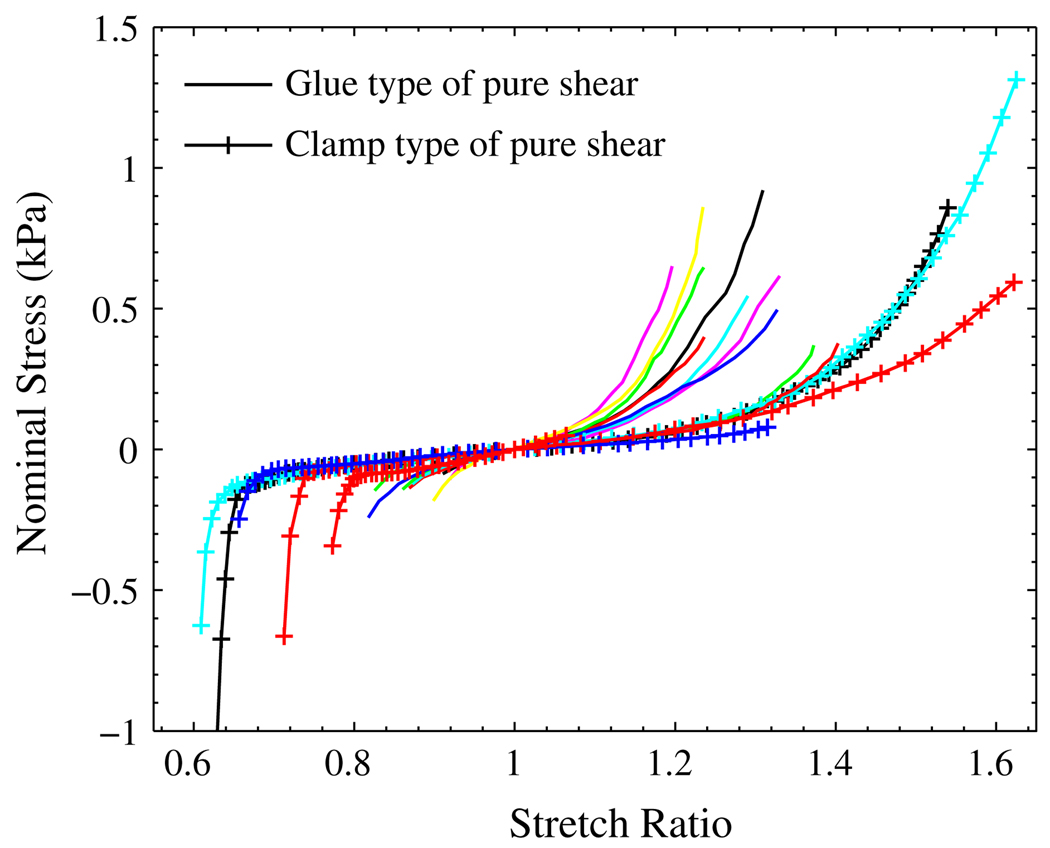
More than 45 liver samples cut from 12 porcine livers were tested using the two types of the pure shear setup. Among them, that showed big pores or vessels during stretching were discarded. For the remaining samples, we chose the ones that had the most visible texture and low reflectivity to run the DIC and analysis. Figure 6 shows the stress–stretch curves from ten samples by using glue. Figure 7 shows stress–stretch curves from another five samples by using clamps. The previous ten curves in Fig. 6 were also plotted in Fig. 7.
FIGURE 6.
Nominal stress–stretch relationships for liver tissue under the glue type of pure shear test.
FIGURE 7.
Nominal stress–stretch relationships for liver tissue under the pure shear test: the solid lines are from the glue type of pure shear test; the lines with ‘+’ are from the clamp type of pure shear test.
In the second type of pure shear test, clamps were used to hold the liver tissue. A frozen specimen was first placed between the clamps by slightly tightening the screws. During the process of thawing, the two sets of screws in the clamps were tightened gradually to ensure enough gripping force to hold the tissue. Because of the tightening, the tissue sandwiched between the clamps was compressed and expanded in the 1–2 plane. As the result, the tissue in the test region was pre-compressed in the direction 1. The compression can also be seen from the stress–strain curves in Fig. 7. Without the method of setting zero origin by identifying the position of maximum stretching band, the stress–stretch curves could end up with a long strain artifacts on the tensile side.13
If we compare the results from the two types of pure shear test, the measured mechanical properties from the clamp type are much softer than those measured from the glue type. There are several reasons that could contribute to this difference: (1) the pre-strain was different; (2) the boundary conditions were different; and (3) the livers used in the glue type of test were different from those used for clamp type of test.
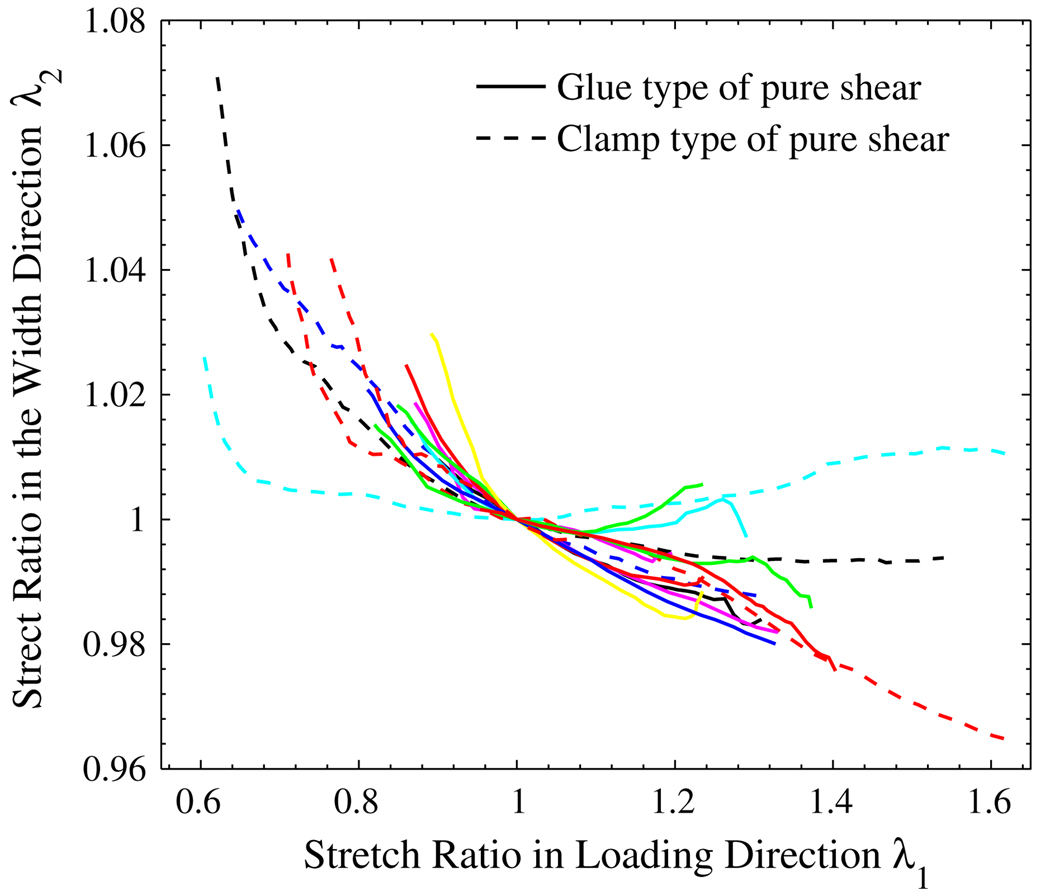
For a ideal pure shear test, the stretch ratio in the width direction (direction 2) is supposed to be 1. Figure 8 shows the measured stretch ratio in the width direction for all the samples. The solid lines are for the glue type, and the dashed lines are for the clamp type. We can see that the width of the pure shear specimens has been maintained relatively well. For most of the samples, the width change was observed to be within ±3%.
FIGURE 8.
The measured stretch ratio in the loading direction (λ1) vs. stretch ratio in the width direction (λ2).
Unconfined Compression
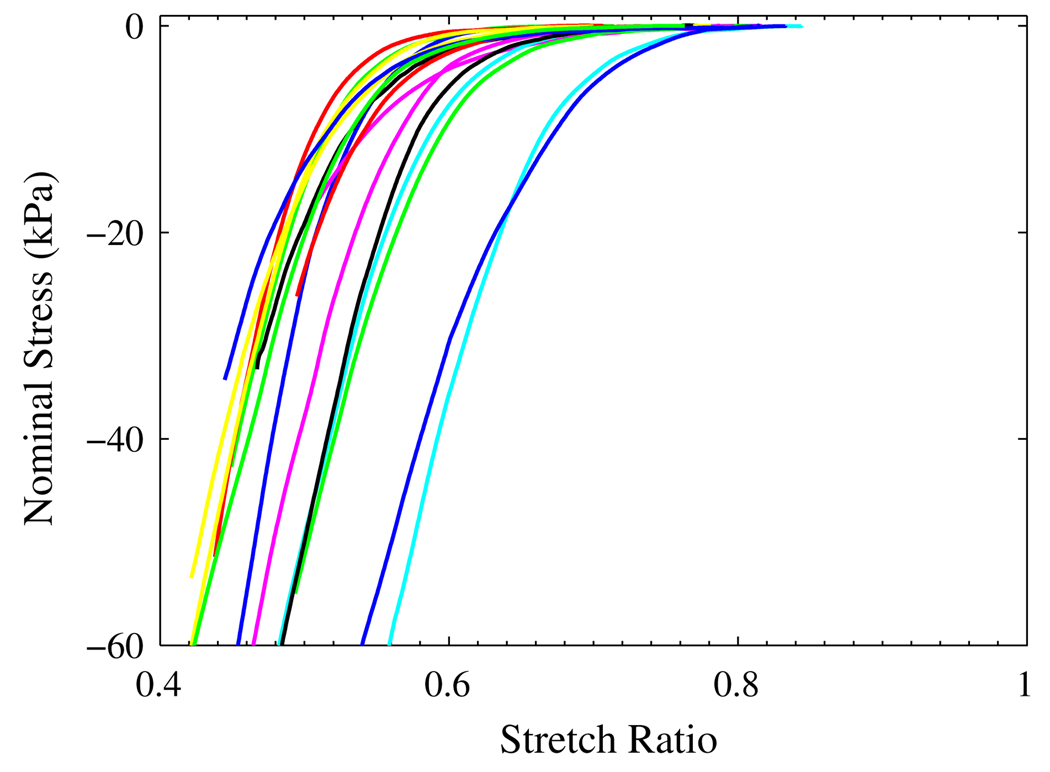
Figure 9 shows the nominal stress vs. stretch ratio curves for unconfined compression test. Among the 50 samples tested, only the ones that had uniformly expanded in radial directions were picked for analysis and the results were plotted in Fig. 9. The height of frozen sample, Hf, was measured and used as the original length for the sample. After thawing, the height of the sample decreased 15–30% to Ht. The stretch ratio was calculated as
| (24) |
where d is the displacement of the top platen. Because we observed there were small amount of liquid left on the plastic wrap after the tissue sample thawed, the stretch ratio calculated from (24) could be less than its true value. The nominal stress was calculated by the measured force divided by the cross-section area of the frozen sample. Because the effect of gravity was not considered in the stress calculation, the result is only an approximation, especially when the stress is very low.
FIGURE 9.
The nominal stress vs. stretch ratio curves from unconfined compression test.
Tension Test
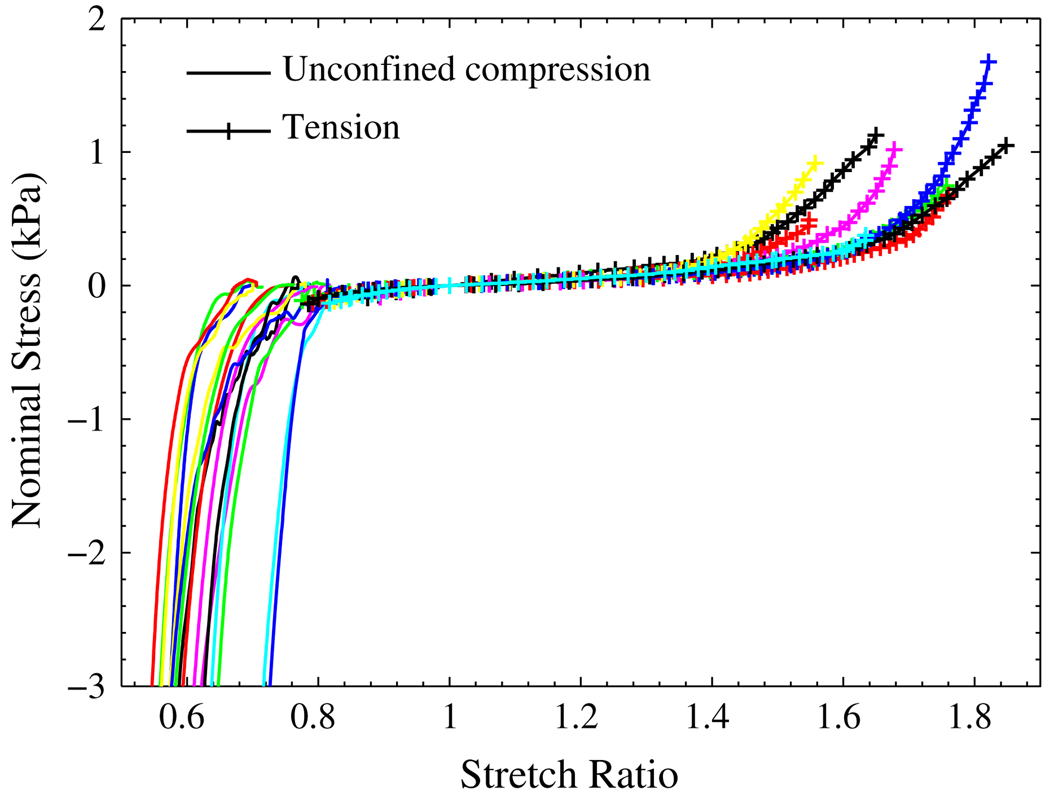
The tension test and its strain measurement, which has been discussed in Gao and Desai,12 were similar to that of the glue type of pure shear test. Before the loading process, the samples were largely in compression. With the top plate moving up, the tissue was getting into the tensile state gradually from top to bottom. The position of the zero stress state can be approximately determined by the position of the maximum stretching band. In Fig. 10 the tension test results were plotted together with those from the unconfined compression. The overall trend for uniaxial test of both tension and compression can be seen.
FIGURE 10.
The nominal stress vs. stretch ratio curves from uniaxial unconfined compression and tension test: the solid lines are for compression test, and the lines with ‘+’ are from the tension test.
Theoretical Analysis
In this paper, we do not attempt a best fit to the experimental data using an optimization algorithm. Instead, the purpose of this section is to demonstrate the ability of the new models to represent experimental results. We also present the following method, which can model the exact length of the toe regions for both tension and compression.
In Fig. 10, the stiffness of some curves increases sharply at λ ≈ 0.65 for compression and at λ ≈ 1.8 for tension. It is the following part of the Eq. (20):
| (25) |
that decides the length of the toe region. Therefore, we can assume that stress is approaching infinity at λ = 0.61 and λ = 1.85 by forcing the following conditions:
| (26) |
| (27) |
Consequently, by solving (26) and (27), we get:
| (28) |
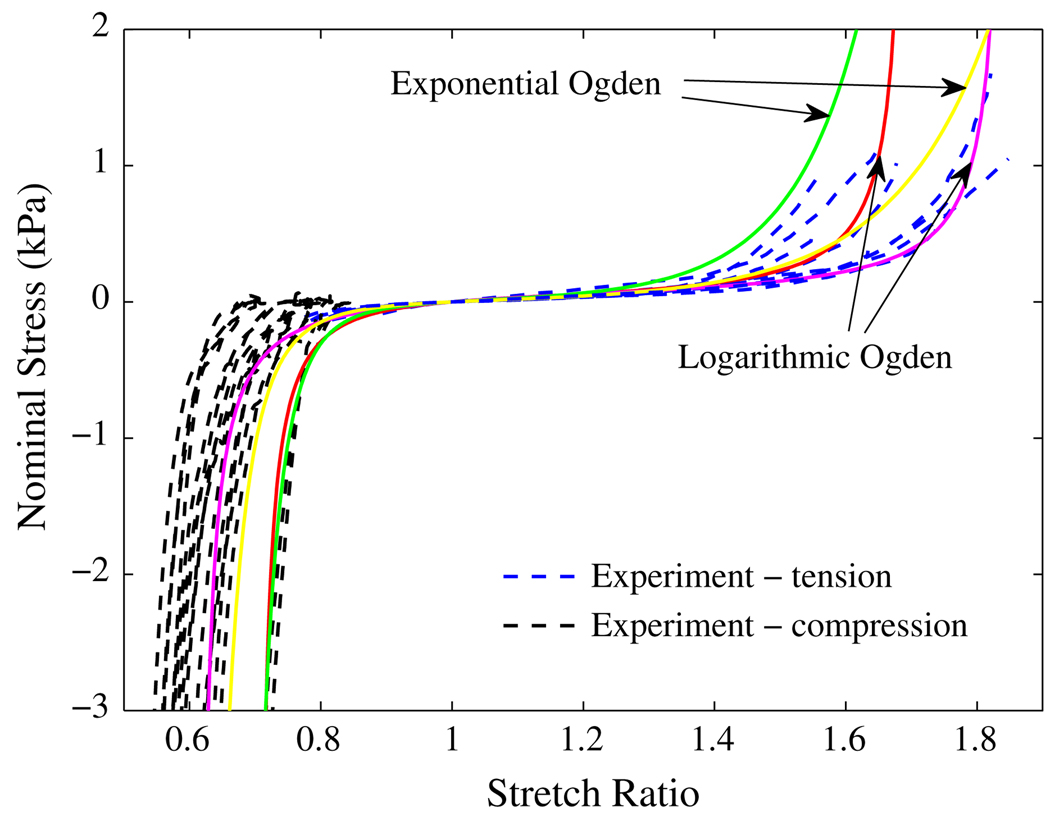
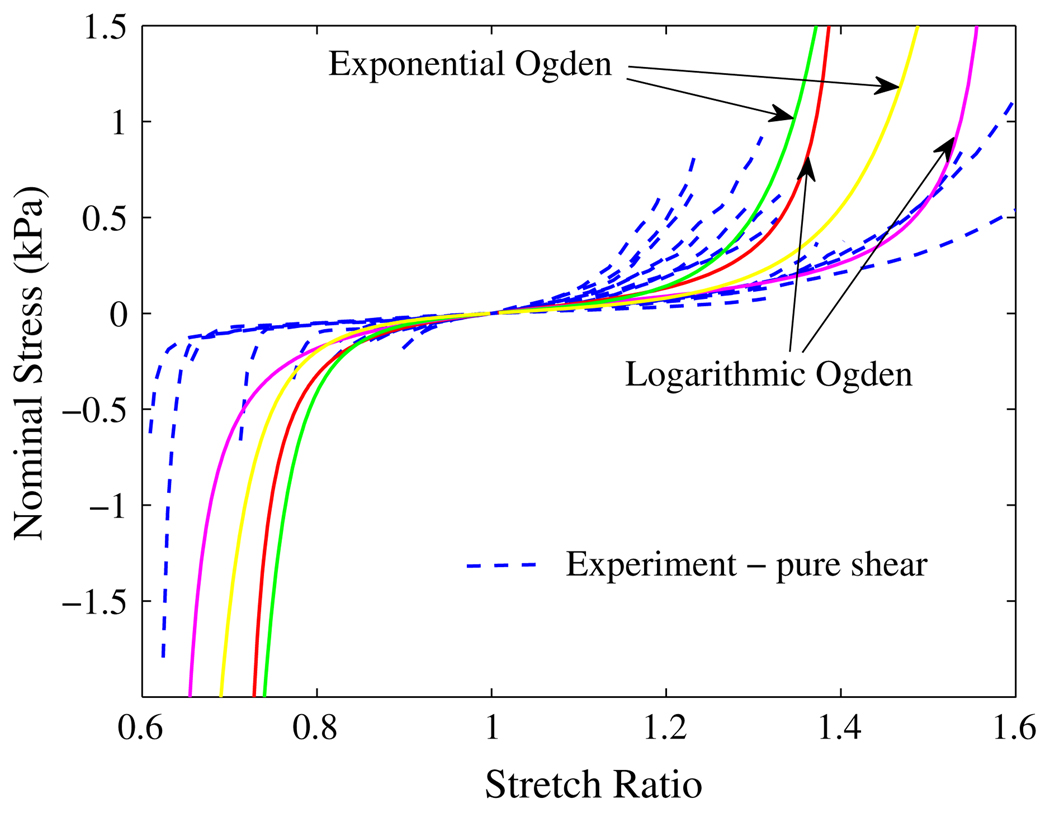
The parameters α1 and C2 for exponential-Ogden model can be determined similarly. In this paper, we neglect the second term in Eq. (13) and Eq. (14), and consider only the exponential-Ogden or logarithmic-Ogden term in the strain energy functions. Then the last unknown parameter, C1, can be determined by approximating the tangent of the stretch–stress curves at the toe region. Four sets of parameters have been obtained and the stress–stretch curves were plotted in Fig. 11 and Fig. 12 with the experimental data. The two logarithmic-Ogden curves have the following parameters:
C1 = 55; C2 = 0.09709266322; α = −7.1344372985
C1 = 60; C2 = 0.6318692445; α = −2.54366182
FIGURE 11.
Nominal stress vs. stretch ratio curves for liver tissue under uiaxial tension and compression: the dashed lines are from experiments; the solid lines are the predicted by the models.
FIGURE 12.
Nominal stress vs. stretch ratio curves for liver tissue under pure shear: the dashed lines are from experiments; the solid lines are the predicted by the models.
The material constants of the two exponential-Ogden curves are:
C1 = 9; C2 = 1.305650218; α = −4.1096665
C1 = 10; C2 = 1.6; α = −3.06760187
The unit of C1 is Pascal.
Comparing the experimental results with those predicted by the new models in Fig. 11 and Fig. 12, we can say that the models represent the general mechanical response of liver tissue at the current experimental conditions. The overall result is very good, considering there are only three material constants for each model. The fitting results can be improved through some appropriate optimization.
CONCLUSIONS AND DISCUSSION
For a general surgical simulation, various loading states are involved. To develop a realistic soft tissue model would require characterization of soft-tissue in various deformation modes and under low strain rate, which is typical in surgery. Most of the reported experiments and models for the very soft tissues under finite deformation were focused on compression, indentation, and uniaxial tension tests. The published results for the shear properties of the very soft tissues under finite deformation were limited. In this paper we conducted two types of pure shear test, unconfined compression and uniaxial tension on more than 130 samples from 12 porcine livers.
Digital Image Correlation technique was used to measure the deformation field. The effect of gravity was observed. Because of gravity, the deformation field was not uniform in the vertical direction. There was a maximum stretching band moving downward gradually in the tension and pure shear test. Based on this phenomenon, the zero strain state can be determined approximately.
Two new constitutive models based on combined exponential/logarithmic and Ogden strain energy were proposed. The models are capable to describe the full range of deformation for both compression and tension, and also good for representing tissue deformation in pure shear. To the best of our knowledge, this is the first result of its kind. Although we only consider modeling ex vivo liver tissue in this paper, the strain energy functions and the approach to determine their material parameters are quite general and can be used for modeling a wide variety of soft tissue.
Under physiological conditions, liver is perfused with blood, both from hepatic arterial and portal venous sources. This perfusion imparts a certain degree of liver dilation that is not present in a unperfused state and hence influences the deformation properties.3,21,22 Hyperelastic models are usually the backbone of other type of models for biological tissues.34 Hyper-viscoelastic model20,23,27 and biphasic poroelastic model26,29 have been reported for describing liver or brain tissue under in vivo perfused state. We plan to run in vivo test on porcine liver in the future. The soft tissue model proposed in this paper can be used as a base model or a building block for the modeling and simulation of whole liver under in vivo condition.
ACKNOWLEDGMENT
This work was supported by the National Institutes of Health (NIH) under Grant 1R01EB006615.
Footnotes
Portions reprinted, with permission, from: “Zhan Gao, Kevin Lister, and Jaydev P. Desai, 2008. Constitutive modeling of liver tissue: experiment and theory. In: 2nd IEEE RAS & EMBS International Conference on Biomedical Robotics and Biomechatronics, BioRob 2008, pp. 477–482, October 19–22, 2008, Scottsdale, AZ” ©2008 IEEE.
Portions reprinted, with permission, from: “Zhan Gao, Theodore Kim, Doug L. James, Jaydev P. Desai, 2009. Semi-automated soft-tissue acquisition and modeling for surgical simulation. In: 5th Annual IEEE Conference on Automation Science and Engineering, CASE 2009, pp. 268–273, August 22–25, 2009, Bangalore, India.” ©2009 IEEE.
REFERENCES
- 1.Brown JD, Rosen J, Sinaman MN, Hannaford B. In vivo and postmortem compressive properties of porcine abdominal organs. In: Medical Image Computing and Computer-Assisted Intervention, MICCAI 2003, No. 2878 in Lecture Notes in Computer Science. 2003:238–245. [Google Scholar]
- 2.Butler DL, Grood ES, Noyes FR, Zernicke RF, Brackett K. Effects of structure and strain measurement technique on the material properties of young human tendons and fascia. J. Biomech. 1984;17(8):579–596. doi: 10.1016/0021-9290(84)90090-3. [DOI] [PubMed] [Google Scholar]
- 3.Carter F, Frank T, Davies P, McLean D, Cuschieri A. Measurements and modelling of the compliance of human and porcine organs. Med. Image Anal. 2001;5:231–236. doi: 10.1016/s1361-8415(01)00048-2. [DOI] [PubMed] [Google Scholar]
- 4.Charlton D, Yang J, Teh K. A review of methods to characterize rubber elastic behavior for use in finite element analysis. Rubber Chem. Technol. 1994;67:481–503. [Google Scholar]
- 5.Chui C, Kobayashi E, Chen X, Hisada T, Sakuma I. Combined compression and elongation experiments and non-linear modelling of liver tissue for surgical simulation. Med. Biol. Eng. Comput. 2004;42(6):787–798. doi: 10.1007/BF02345212. [DOI] [PubMed] [Google Scholar]
- 6.Chui C, Kobayashi E, Chen X, Hisada T, Sakuma I. Transversely isotropic properties of porcine liver tissue: experiments and constitutive modelling. Med. Biol. Eng. Comput. 2007;45(1):99–106. doi: 10.1007/s11517-006-0137-y. [DOI] [PubMed] [Google Scholar]
- 7.Davies PJ, Carter FJ, Cuschieri A. Mathematical modelling for keyhold surgery simulations: a biomechanical model for spleen tissue. IMA J. Appl. Math. 2002;67:41–67. [Google Scholar]
- 8.Dokos SI, LeGrice J, Smaill BH, Kar J, Young AA. A triaxial-measurement shear-test device for soft biological tissues. J. Biomech. Eng. 2000;122:471–478. doi: 10.1115/1.1289624. [DOI] [PubMed] [Google Scholar]
- 9.Dokos S, Smaill BH, Young AA, LeGrice IJ. Shear properties of passive ventricular myocardium. Am. J. Physiol.-Heart Circ. Physiol. 2002;283:H2650–H2659. doi: 10.1152/ajpheart.00111.2002. [DOI] [PubMed] [Google Scholar]
- 10.Farshad M, Barbezat M, Flueler P, Schmidlin F, Graber P, Niederer P. Material characterization of the pig kidney in relation with the biomechanical analysis of renal trauma. J. Biomech. 1999;32:417–425. doi: 10.1016/s0021-9290(98)00180-8. [DOI] [PubMed] [Google Scholar]
- 11.Fung YC. Biomechanics: Mechanical Properties of Living Tissues. New York: Springer; 1993. [Google Scholar]
- 12.Gao Z, Desai JP. Estimating zero strain states of very soft tissue under gravity loading using digital image correlation. doi: 10.1016/j.media.2009.11.002. In review. [DOI] [PMC free article] [PubMed] [Google Scholar]
- 13.Gao Z, Lister K, Desai JP. Constitutive modeling of liver tissue: experiment and theory; Second Biennial IEEE/RAS-EMBS International Conference on Biomedical Robotics and Biomechatronics, BioRob 2008; 2008. pp. 477–482. [Google Scholar]
- 14.Gardiner JC, Weiss JA. Simple shear testing of parallel-fibered plannar soft tissues. J. Biomech. Eng. 2001;123:170–175. doi: 10.1115/1.1351891. [DOI] [PubMed] [Google Scholar]
- 15.Guo DL, Chen BS, Liou NS. Investigating full-field deformation of planar soft tissue under simple-shear tests. J. Biomech. 2007;40(5):1165–1170. doi: 10.1016/j.jbiomech.2006.04.013. [DOI] [PubMed] [Google Scholar]
- 16.Ham AW. Chap. Pancreas, Liver and Gallbladder. 6th ed. Philadelphia and Toronto: J. B. Lippincott Company; 1969. Histology; pp. 711–717. [Google Scholar]
- 17.Hollenstein M, Nava A, Valtorta D, Snedeker JG, Mazza E. Chap. Mechanical Characterization of the Liver Capsule and Parenchyma. Vol. 4072. Berlin/Heidelberg: Springer; 2006. Biomedical Simulation, Lecture Notes in Computer Science; pp. 150–158. [Google Scholar]
- 18.Hu T, Desai JP. Euro-Haptics. Munich, Germany: 2004. Modeling large deformation in soft-tissues: experimental results and analysis. [Google Scholar]
- 19.Hu T, Lau C, Desai JP. Instrumentation for testing soft-tissue undergoing large deformation: ex vivo and in vivo studies. ASME J. Med. Devices. 2008;2(4):041001-1–041001-6. [Google Scholar]
- 20.Jordan P, Socrate S, Zickler T, Howe R. Constitutive modeling of porcine liver in indentation using 3d ultrasound imaging. J. Mech. Behav. Biomed. Mater. 2009;2:192–201. doi: 10.1016/j.jmbbm.2008.08.006. [DOI] [PMC free article] [PubMed] [Google Scholar]
- 21.Kerdok AE, Ottensmeyer MP, Howe RD. Effects of perfusion on the viscoelastic characteristics of liver. J. Biomech. 2006;39:2221–2231. doi: 10.1016/j.jbiomech.2005.07.005. [DOI] [PubMed] [Google Scholar]
- 22.Mazza E, Nava A, Hahnloser D, Jochum W, Bajka M. The mechanical response of human liver and its relation to histology: an in vivo study. Med. Image Anal. 2007;11:663–672. doi: 10.1016/j.media.2007.06.010. [DOI] [PubMed] [Google Scholar]
- 23.Miller K. Constitutive modelling of abdominal organs. J. Biomech. 2000;33:367–373. doi: 10.1016/s0021-9290(99)00196-7. [DOI] [PubMed] [Google Scholar]
- 24.Miller K, Chinzei K. Constitutive modelling of brain tissue: experiment and theory. J. Biomech. 1997;30:1115–1121. doi: 10.1016/s0021-9290(97)00092-4. [DOI] [PubMed] [Google Scholar]
- 25.Miller K, Chinzei K. Mechanical properties of brain tissue in tension. J. Biomech. 2002;35(4):483–490. doi: 10.1016/s0021-9290(01)00234-2. [DOI] [PubMed] [Google Scholar]
- 26.Miller K, Taylor Z, Nowinski WL. Towards computing brain deformations for diagnosis, prognosis and neurosurgical simulation. J. Mech. Med. Biol. 2005;5(1):105–121. [Google Scholar]
- 27.Nava A, Mazza E, Furrer M, Villiger P, Reinhart W. In vivo mechanical characterization of human liver. Med. Image Anal. 2008;12:203–216. doi: 10.1016/j.media.2007.10.001. [DOI] [PubMed] [Google Scholar]
- 28.Ogden R. Large deformation isotropic elasticity—on the correlation of theory and experiment for incompressible rubberlike solids. Proc. R. Soc. Lond. Ser. A. 1972;326:565–584. [Google Scholar]
- 29.Paulsen KD, Miga MI, Kennedy FE, Hoopes PJ, Hartov A, Roberts DW. A computational model for tracking subsurface tissue deformation during stereotactic neurosurgery. IEEE Trans. Biomed. Eng. 1999;46(2):213–225. doi: 10.1109/10.740884. [DOI] [PubMed] [Google Scholar]
- 30.Roan E, Vemaganti K. The nonlinear material properties of liver tissue determined from non-slip uniaxial compression experiments. J. Biomech. Eng. 2007;129:450–456. doi: 10.1115/1.2720928. [DOI] [PubMed] [Google Scholar]
- 31.Saraf H, Ramesh K, Lennon A, Merkle A, Roberts J. Measurement of the dynamic bulk and shear response of soft human tissues. Exp. Mech. 2007;47:439–449. [Google Scholar]
- 32.Shuck LZ, Advani SH. Rheological response of human brain tissue in shear. J. Basic Eng. 1972;94(4):905–911. [Google Scholar]
- 33.Valtorta D, Mazza E. Dynamic measurement of soft tissue viscoelastic properties with a torsional resonator device. Med. Image Anal. 2005;9:481–490. doi: 10.1016/j.media.2005.05.002. [DOI] [PubMed] [Google Scholar]
- 34.Vito RP, Dixon SA. Blood vessel constitutive models—1995–2002. Annu. Rev. Biomed. Eng. 2003;5:413–439. doi: 10.1146/annurev.bioeng.5.011303.120719. [DOI] [PubMed] [Google Scholar]


