Abstract
In this letter we propose a kinematic model to explain how collisions with a surface and rotational Brownian motion give rise to accumulation of micro-swimmers near a surface. In this model, an elongated microswimmer invariably travels parallel to the surface after hitting it from an oblique angle. It then swims away from the surface, facilitated by rotational Brownian motion. Simulations based on this model reproduce the density distributions measured for the small bacteria E. coli and Caulobacter crescentus, as well as for the much larger bull spermatozoa swimming between two walls.
Swimming aids the function of microorganisms, such as enhancing the formation of biofilms on surfaces [1]. Swimming also helps transport sperms toward eggs for fertilization [2]. The density of cells as a function of distance from a surface has been measured for swimming E. coli [3] and bull spermatozoa [4], showing interestingly in both cases values much higher near the surface than far away. This near surface accumulation has mainly been attributed to the hydrodynamic attraction between the cells and the surface [4, 5]. Recently, Berke et al. [3] combined the effects of the hydrodynamic attraction and the translational Brownian motion of the cells to predict the distribution of E. coli as a function of distance. As noted by the authors [3], however, this interpretation is not applicable to cells within 10 μm from the surface, where the cell density is the highest. The hydrodynamic interaction among the microswimmers has been shown to be important only at high cell concentrations [6, 7].
In this letter we present a different account for the near surface accumulation. We ignore the hydrodynamic attraction but emphasize the role of collision with a surface at a low Reynolds number [8], an interaction that deflects the swimming direction, and the role of rotational Brownian motion of individual microswimmers in a confined environment. We show that a typical microswimmer with an elongated shape tends to swim parallel to a surface after hitting it at an oblique angle and therefore accumulate near the surface. Rotational Brownian motion [9] then relaxes the accumulation by randomly changing the swimming direction so that the cells have chances to swim away from the surface. In the extreme case of no rotational Brownian motion, all the cells would end up swimming in close proximity with the surface. In the opposite extreme of very fast rotational Brownian motion, the cells will quickly change to any possible swimming direction and subsequently would be found anywhere with equal probability. In reality, a microswimmer randomly changes its swimming direction with a finite rotational diffusion constant, resulting in a distribution in between the two extremes, that is, more cells stay near the surface and fewer far away.
We used the bacterium C. crescentus strain CB15 SB3860 to examine the near surface swimming and accumulation. Swarmer cells of this mutant swim forward only and do not follow circular trajectories near a surface [10]. The strains were synchronized with the plate releasing method [10] to obtain cultures with primarily swimming cells. The synchronized culture was sealed between a glass slide and a coverslip with vacuum grease for optical microscopy observation. Broken coverslip pieces were used as spacers so that the thickness of the sample chamber is ~200 μm. A 20× objective (Nikon Plan Apo, NA 0.75) was used on a Nikon E800 microscope to take 5 snap shots of swimming cells at 0.1 second intervals under darkfield mode using a CoolSnap CCD camera (Princeton Instruments) and MetaMorph software (Universal Imaging). The cell density as a function of distance from the glass surface was measured following the method of Berke et al. [3]. We noted that although this objective has a 1.4 μm depth of field, cells up to nearly 5 μm off the focal plane appeared as bright spots. Therefore the measured cell density was an average over an ~10 μm thick layer. The swimming speed and the rotational diffusion constant were obtained from the videos taken for cells over 50 μm away from both surfaces. The average swimming speed was ~45 μm/s. The rotational diffusion constant was measured from ~200 swimming trajectories. The swimming direction at moment t was taken as the direction from the position at t to the position at t + 0.1 s. The change in direction Δϕ over time interval Δt was obtained and the rotational diffusion constant Dr was calculated to be 0.12 rad2/s, using the equation <Δϕ2 >= 2Dr Δt.
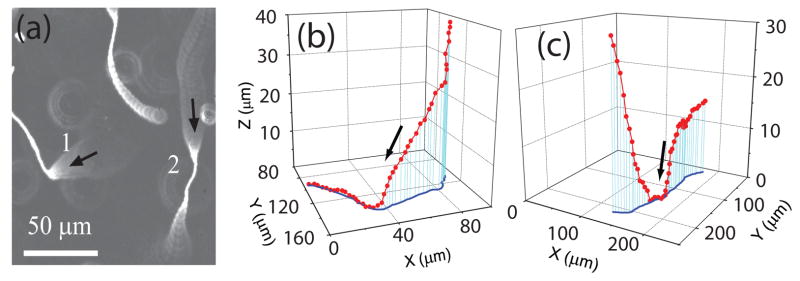
With particular interest we examined the 3-D trajectories as the cells approached and swam near a surface, until they took off. To do so, we focused the objective on the top surface and recorded the swimming trajectories. Example trajectories are shown in Fig. 1a by overlaying consecutive frames taken at the rate of 10 frames per second. The cell body appeared as a sharp bright spot when it was in the focal plane and as a ring when it was away. Wu et al. [11] found that the ring size was proportional to the distance of the cell from the focal plane and therefore could be calibrated to determine the distance. Two examples of 3-D trajectories of the cells 1 and 2 in Fig. 1a are plotted in Figs. 1b and 1c. Most cells approached the surface at an angle and then swam parallel to the surface for some time before departure. The manner of C. crescentus hitting a surface is similar to that of E. coli observed with three dimensional tracking microscopy [12].
Figure 1.
Trajectories of Caulobacter swarmer cells swimming near a glass surface. (a) Overlay of consecutive darkfield images taken at 10 frames per second. (b) and (c) are 3-D plots (red) and projections (blue) on the glass surface of the trajectories of cells 1 and 2 in (a). Arrows indicate the swimming directions.
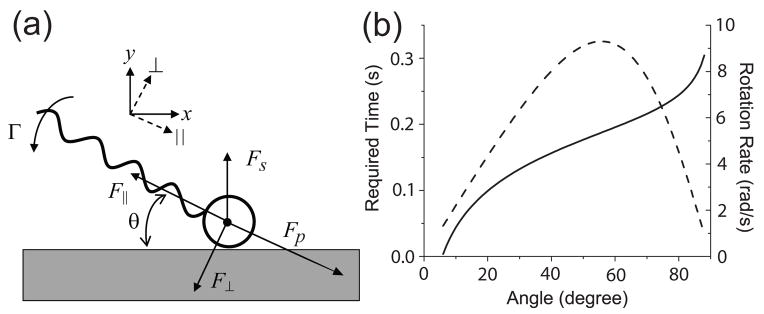
We analyzed the force and torque on C. crescentus swimming near a surface and found that it would invariably swim parallel to the surface shortly after hitting the surface. As a simple model, we approximated the cell as a sphere attached with a helical filament of length L propelled by a longitudinal force Fp. After the cell hits the surface at an angle θ, its velocity component along the direction normal to the surface (y-axis, Fig. 2a) becomes zero. It maintains a swimming speed Vx along the x-axis and a rotation rate Ω along the z-axis (not shown in the figure). We ignored the increase in hydrodynamic drag on the cell due to the nearby surface [10, 13] and assumed that the surface only provides a normal force Fs to stop the swimming along the y-axis. The hydrodynamic drag force on the whole cell (sphere plus helical filament) is split into components parallel and perpendicular to the long axis, F|| and F⊥ The hydrodynamic torque Γ on the whole cell is depicted with respect to the sphere center. The forces and torque are related to the velocity components as
Figure 2.
(a) Force and torque analysis of a forward swimming cell hitting a surface. (b) Required time (solid) for the cell to become parallel to the surface and the rotation rate (dashed) as functions of angle θ.
| (1) |
where V|| = Vx cos θ and V⊥ = Vx sin θ are the velocity components along and perpendicular to the helical axis and A is the friction matrix, for which Aij > 0 and A23 = A32.
At a low Reynolds number, the force balance along x-axis requires Fp cos θ + F|| cos θ + F⊥ sin θ = 0 and torque balance along z-direction requires Γ = 0. Substituting the hydro-dynamic forces and torque with eq. 1, the balance equations determine the swimming speed and rotation rate as
| (2) |
| (3) |
Since , the common denominator in the expressions above is always positive. In the case as shown in Fig. 2a, Vx > 0 and Ω > 0. Therefore the cell swims toward the right and the filament rotates toward the surface.
We can estimate how fast the cell turns parallel to the surface as its head glides on the surface. Mathematically, the cell would take an infinitely long time to become parallel to the surface, as calculated from eq. 3. In practice, however, since the rotational Brownian motion of C. crescentus varies its orientation by 0.1 rad within less than 0.1 sec, we estimate instead the time needed for the cell alignment with the surface to fall below 0.1 rad. The parameters for a typical C. crescentus [10, 14] are A11 = 2.2 ×10⁻⁸ Nsm−1, A22 = 2.5 ×10⁻⁸ Nsm−1, A33 = 1.9 × 10⁻¹⁹ Nms, and A23 = 5.3 × 10⁻¹⁴ Ns. The propulsive force is Fp = A11V ~ 1 × 10⁻¹² N, where V is the bulk swimming speed. The rotation rate after hitting a surface is shown in Fig. 2b, which reaches 9 rad/s at 55°. If a cell hits the surface at an angle θ0, the time for it to become parallel is (Fig. 2b). This is less than 0.2 s for a typical angle of θ0 = 30°, and less than 0.3 s for an angle as large as 85°. Therefore in the following discussion we state in a practical sense that a cell becomes parallel to the surface after a collision.
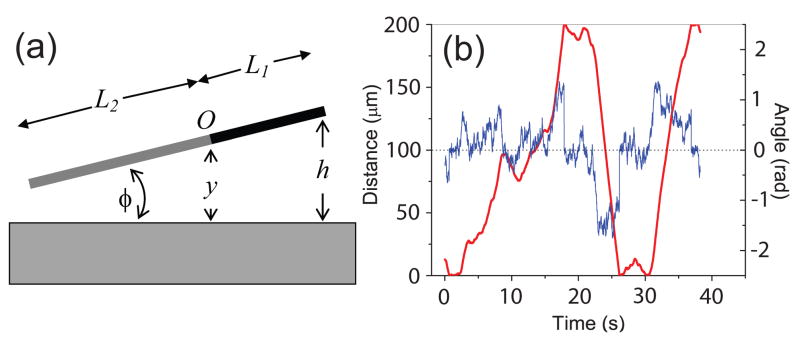
Now we examine how a swimming microorganism takes off after hitting a surface. To further simplify the model, we approximate the elongated swimmer propelled by a longitudinal force as a non-uniform rod (Fig. 3a). This rod swims forward at speed V in the bulk fluid. The rod has a rotation center at position O, which is of a distance L1 away from the head and L2 away from the tail. Since the head has a larger drag per unit length than the tail does, L1 < L2. Due to its small size, the rod undergoes constant Brownian motion with a rotational diffusion constant Dr and translational diffusion constant Dt. Since A11 ~ A22, we ignore the angle dependence of Dt.
Figure 3.
(a) Rod model of a microswimmer near surface. The black end represents that of the cell body and the gray end the flagellar filament. (b) An example of simulated distance h (red) and angle φ (blue) as functions of time for the microswimmer, using the parameters of C. crescentus. The two surfaces are separated by 200 μm.
The change in distance of the rotation center to the surface, y, is determined by the translational Brownian motion and the swimming direction, which is constantly altered by the rotational Brownian motion. Over a time interval Δt, , and , where ζ and ς are random numbers with zero mean and unit variance. The translational Brownian motion contributes much less than swimming to the displacement for microorganisms swimming at tens of μm/s. When near the surface, the changes in distance and angle are also restricted by the solid surface to satisfy y ≥ L1 sin(−φ) when the head is closer to the surface and y ≥ L2 sin φ when the tail is closer. Similar restrictions hold when a cell is near the top surface. Knowing Dt and Dr, we can track the distance y and angle φ over time. The distance of the head from the surface h, which is what was measured in the experiment, is determined by h = y + L1 sin φ. The probability distribution of a cell at distance h is obtained by tracking a cell swimming between the two surfaces over 106 – 107 sec.
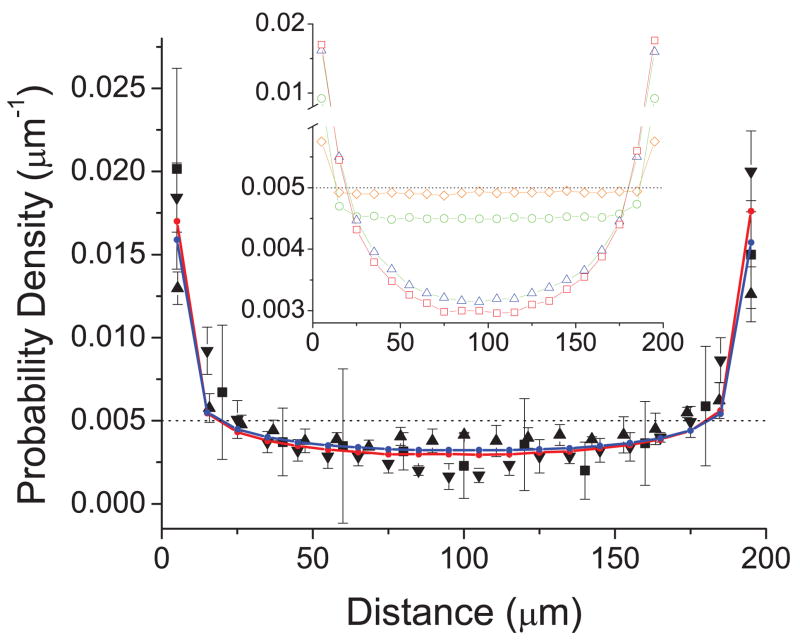
We simulated the distance and angle of swimming C. crescentus between two glass surfaces separated by 200 μm. The cell was treated as a L = L1 + L2 = 6 μm rod, with a typical Dt of 0.1 μm2/s and the measured Dr of 0.12 rad2/s. The rotation center was approximated at a position where L1 = 0.3L. Fig. 3b shows examples of distance (red) and angle (blue) varying over time. The cell hits the top and bottom surfaces repeatedly as it swims between them. The simulated distance from the bottom surface was recorded every 0.1 second and a histogram of distances was made using a bin size of 10 μm. The simulated distribution is plotted in Fig. 4 (blue) and compared with the measured one for C. crescentus (triangle). The simulation clearly shows higher densities near the surfaces, with the entire profile in excellent agreement with the measurements.
Figure 4.
Comparison between simulated density distributions at rotational diffusion constants 0.12 (blue) and 0.0001 (red) rad2/s and the measured distributions of C. crescentus (up triangles), E. coli (down triangles, ref [3]), and bull spermatozoa (squares, ref [4]). Inset compares simulated distribution at rotational diffusion constants of 10 (diamonds), 1 (circle), 0.1 (triangles), and 0.0001 (squares) rad2/s at a swimming speed of 50 μm/s, corresponding to rod lengths of ~1.3,~2.8, ~6, and ~60 μm, respectively. The dotted lines indicate the probability density if there is no surface accumulation.
This model is also applicable to the distribution of E. coli and bull spermatozoa between two surfaces. We took the cell number distribution of E. coli from reference [3] and that of bull spermatozoa from reference [4], converted them to probability density, and plotted them in comparison with that of C. crescentus in Fig. 4. E. coli is similar to C. crescentus in size and it is reasonable that they have similar distributions. Bull spermatozoa are ten times larger, yet surprisingly the distribution is similar to that of bacteria. Nevertheless, this similarity is actually predicted by our model. To simulate for bull spermatozoa for comparison, we treated it as a 60 μm long rod swimming at 45 μm/s, the same speed as C. crescentus, with a Dt of 0.01 μm2/s and a Dr of 10 −4 rad2/s, which is ~1000 times smaller than that of C. crescentus. The simulation results show only a small difference in density distribution between the bull spermatozoa (red) and the C. crescentus (blue), despite the large difference in Dr.
We estimate the density distribution analytically by treating swimming trajectories as semiflexible polymers. A swimming trajectory in bulk fluid can be described equivalently as the contour of a semiflexible polymer with a persistence length Lp = V/Dr [15]. Our simulation shows that microswimmers with different V and Dr values but the same persistence length of swimming trajectories have the same near-surface distribution (data not shown). In the simulation we obtained the histogram of distance using a bin size of 10 μm, which is equivalent to dividing the fluid between the two glass surfaces into layers of thickness Δh = 10 μm and aquiring the probability of finding a microswimmer in each layer. The probability of finding a microswimmer within a layer is proportional to the average length of the trajectories in that layer. The average trajectory length is equivalent to the average contour length of a semiflexible polymer with one end laid on the wall surface and the other free. The average contour length before the far end wanders a distance h from the surface, if h ≪ Lp, is estimated to be [16]. Accordingly, the average contour length in the nth layer from the surface where the polymer originates is . Normalized by that in the first layer, the relative contour length in the nth layer is n2/3 −(n−1)2/3, which is independent of the persistence length, as long as n Δh ≪ Lp. This approximation is excellent for bull spermatozoa (Lp ~ 400 mm) and reasonably adequate for C. crescentus (Lp ~ 400 μm). Therefore, despite the difference in persistence length by 1000 times, density distributions of these two systems are similar, as seen in the results of both observation and simulation. The relative density ratios among the first 5 slices are 1, 0.59, 0.49, 0.44, and 0.40, respectively, dropping sharply when close to the surface and then slowly at a distance away. The agreement with observation and simulation indicates that the above estimation captures the basic physical picture, although we have ignored factors such as the re-entrance of the trajectory into a layer it has left, the repeated collisions with the wall in the first layer, and the contribution of polymers started from the other surface. Note that this estimation is only valid for very large persistence length. The accumulation effect is weaker for trajectories of shorter persistence length, corresponding to even smaller microswimmers with larger Dr (inset of Fig. 4).
In this model we have ignored the hydrodynamic interaction between the swimming cell and a nearby surface, which carries the forward swimming cell towards the surface. Berke et al. [3] calculated this effect for bacteria when the cell is >10 μm away from the surface. A simple estimation shows that this effect is much smaller than the combined effect of rotational Brownian motion and swimming when the cell is nearly parallel to the surface. For example, at a distance h = 10 μm and angle φ = 0.1 rad, calculation based on their model yields a reorientation rate of ~0.01 rad/s and an speed of ~1 μm/s towards the surface, while in 1 second the rotational Brownian motion reorients the cell by as much as 0.4 rad on average, resulting in a change in the component of swimming speed normal to the surface up to 10 μm/s. When the distance is less than 1 μm, the near-field hydrodynamic interaction tends to tilt the flagellar filament away from the surface [17]. The tilt angle is smaller than 0.01 rad for a typical bacterium, which has negligible effect compared with the extent of frequent changes in orientation caused by rotational Brownian motion. The near-field hydrodynamic interaction may prolong the dwell time of the cell near the surface [13]. This effect on the density distribution, however, is expected to be limited since the distribution is binned by 10 μm in distance. The hydrodynamic interaction in the range of 1 to 10 μm is not adequately described theoretically. Its effect on distribution of cells in this range, however, proves to be secondary by the good agreement between the experimental measurements and the simulation results ignoring it. Above analysis also agrees with recent computations showing that hydrodynamic interaction between microswimmers and the surface does not qualitatively alter the distribution [8].
In conclusion, we have demonstrated major effects of collision and rotational Brownian motion on near surface accumulation of swimming microorganisms. The collision with a surface resets the swimming direction to be parallel to it and the rotational Brownian motion then randomly alters the swimming direction. Combination of these two effects leads to the accumulation. An excellent agreement is obtained between the simulations based on this picture and the experimental results.
Acknowledgments
This work is supported by NIH GM077648 and NSF CMMI 0825873. We thank Professors Y. Brun and B. Ely for providing the bacterial strains and Dr. Jizeng Wang for an insightful discussion.
References
- 1.Watnick P, Kolter R. J Bacteriol. 2000;182:2675. doi: 10.1128/jb.182.10.2675-2679.2000. [DOI] [PMC free article] [PubMed] [Google Scholar]
- 2.Levitan DR, Petersen C. Trends Ecol Evol. 1995;10:228. doi: 10.1016/S0169-5347(00)89071-0. [DOI] [PubMed] [Google Scholar]
- 3.Berke AP, Turner L, Berg HC, Lauga E. Phys Rev Lett. 2008;101:038102. doi: 10.1103/PhysRevLett.101.038102. [DOI] [PubMed] [Google Scholar]
- 4.Rothschild L. Nature. 1963;198:1221. [Google Scholar]
- 5.Fauci LJ, Mcdonald A. Bulletin of Mathematical Biology. 1995;57:679. doi: 10.1007/BF02461846. [DOI] [PubMed] [Google Scholar]
- 6.Underhill PT, Hernandez-Ortiz JP, Graham MD. Phys Rev Lett. 2008;100:248101. doi: 10.1103/PhysRevLett.100.248101. [DOI] [PubMed] [Google Scholar]
- 7.Hernandez-Ortiz JP, Stoltz CG, Graham MD. Phys Rev Lett. 2005;95:204501. doi: 10.1103/PhysRevLett.95.204501. [DOI] [PubMed] [Google Scholar]
- 8.Hernandez-Ortiz JP, Underhill PT, Graham MD. J Phys: Condens Matter. 2009;21:204107. doi: 10.1088/0953-8984/21/20/204107. [DOI] [PubMed] [Google Scholar]
- 9.Berg HC. Random walks in biology. Princeton University Press; Princeton: 1993. rev. ed. [Google Scholar]
- 10.Li G, Tam LK, Tang JX. Proc Nat Acad Sci. 2008;105:18355. doi: 10.1073/pnas.0807305105. [DOI] [PMC free article] [PubMed] [Google Scholar]
- 11.Wu MM, Roberts JW, Buckley M. Exp Fluids. 2005;38:461. [Google Scholar]
- 12.Frymier PD, Ford RM, Berg HC, Cummings PT. Proc Nat Acad Sci USA. 1995;92:6195. doi: 10.1073/pnas.92.13.6195. [DOI] [PMC free article] [PubMed] [Google Scholar]
- 13.Lauga E, DiLuzio WR, Whitesides GM, Stone HA. Biophys J. 2006;90:400. doi: 10.1529/biophysj.105.069401. [DOI] [PMC free article] [PubMed] [Google Scholar]
- 14.Koyasu S, Shirakihara Y. J Mol Biol. 1984;173:125. doi: 10.1016/0022-2836(84)90407-8. [DOI] [PubMed] [Google Scholar]
- 15.Friedrich BM. Phys Biol. 2008;5:026007. doi: 10.1088/1478-3975/5/2/026007. [DOI] [PubMed] [Google Scholar]
- 16.Odijk T. Macromolecules. 1983;16:1340. [Google Scholar]
- 17.Hill J, Kalkanci O, McMurry JL, Koser H. Phys Rev Lett. 2007;98:068101. doi: 10.1103/PhysRevLett.98.068101. [DOI] [PubMed] [Google Scholar]


