

Abstract
Networks of genes are typically generated from expression changes observed between control and test conditions. Nevertheless, within a single control state many genes show expression variance across biological replicates. These transcripts, typically termed unstable, are usually excluded from analyses because their behavior cannot be reconciled with biological constraints. Grouped as pairs of covariant genes they can however show a consistent response to the progression of a disease. We present a model of coherence arising from sets of covariant genes that was developed in-vitro then tested against a range of solid tumors. DGPMs, Decoherence Gene Pair Models, reflect changes in network topology reflective of the metastatic transition. Across a range of solid tumor studies the model generalizes to reveal a richly connected topology of networks in healthy tissues that becomes sparser as the disease progresses reaching a minimum size in the advanced tumors with minimal survival.
Keywords: disease genes, networks, coherence, prognostic markers
Introduction
Gene regulatory networks (GRNs) have become an increasingly useful means of representing the interactions between genes that lead to complex expression states. These typically densely linked and self-referential networks utilize multiple paths of feedback to modulate gene expression. In part, these properties arise from the use of a small shared vocabulary of transcription factors, paired with a hierarchy of other transcription control processes [1]. Our understanding of the hierarchy is expanding to include sense-antisense transcript interactions, small non-coding transcript binding and a combination of higher order short range epigenetic marks and long range chromatin looping. Modeling often reveals robust cellular states that emerge from feedback [2] between sets of responsive genes. Feedback and feed-forward interactions between variable genes are key to maintaining homeostasis [3]. Groups of genes that vary their expression in response to changes in the cellular environment or genes that are subject to cyclical waves of expression such as circadian rhythm cell signaling [4] inherently form variable networks. For example, genes like PER2 [5] that are responsive but do not exhibit stochastic expression have been shown to concordantly vary their expression within a unique subset of variable genes [6]. Other sets of genes may vary their expression in coherent ways between individuals due to factors encountered in the environment. This has been demonstrated in the case of the androgen disrupting fungicide vinclozolin, that can exert long lasting changes in the epigenetic states of many genes [7].
Several strategies have been used to construct interaction maps to describe GRNs, including the qualitative [8], continuous, stochastically perturbed [9] and, more recently, the topos [10] models. While the complexity of interactions modeled varies, they share the approach of linking sets of genes that singly or as an aggregate show a change between controlled states relative to a significance statistic that characterizes variance within states. In developing DGPMs, Decoherence Gene Pair Models, we have taken the alternative approach of utilizing genes that exhibit irregular behavior that are typically not included in network models. Pairs of genes that show a linked pattern of expression can be assigned as nodes in a coherence network joined by a network edge. Their expression linkage may be determined by a linear relationship e.g. ExpressionGene1 ≈ kExpressionGene2, but non-linear functions can also prove useful. This approach is generally weakly constrained in terms of network membership. As biological sample sets are permuted individual gene pairs may be included or removed from the network. Nonetheless, changes in network parameters such as size and linkage are typically robust with respect to this permutation [11]. The absolute number of coherent transcripts in conjunction with other parameters, such as network degree, provides a useful proxy of tissue homogeneity [12, 13].
Extending existing work [14], we hypothesized that the very responsiveness of large numbers of genes located in the variable segments of regulatory networks may provide a useful set of biomarkers. Their utility lies in the ready generalization of their behavior to many forms of tissue differentiation, albeit generalization is achieved at a cost of causality. This strategy provides a complementary perspective to the many disease specific gene networks used to model tumor progression. In this manuscript we first describe expression coherence as a function of in vitro differentiation, then extend the approach to model solid tumor coherence. By identifying aggregate networks of covariant genes across biological replicates the response of variable genes to disease onset and progression was assessed. The extent of expression coherence between genes suggests the extent to which biological replicates form a homogeneous group within their organizational or developmental states. The variable genes modeled in DGPMs may track tissue trajectory stability in models that can be readily extended to disease progression and in some cancers, survivability.
Methods
Network Generation
Networks are generated through linking pairs of genes that are in turn linked to form more complex groups. The process begins with a subset of genes, determined to have expression association. They are selected from the set of all possible pairs of genes available on an expression measurement platform (e.g., an array with 40,000 expression probes may generate 800 million unique pairs of genes). To characterize the degree of expression coherence for any pair of genes across a set of biological replicates a flexible algorithm was developed. A user defined connection function is chosen to map the expression data across biological samples from one gene onto the expression data from the second gene. The connection function may be linear, non-linear or categorical. For this study a simple linear function was chosen. The extent to which the selected connection function can map the expression of one gene onto the second gene determines strength of the linkage between two genes and hence determines whether they are included in the subset of gene-pairs used to initialize a network.
In the case of a linear connection function (Y=K.X), linkage may be readily determined by the correlation r between X and Y following a least square fit of K. Given the large number of gene pairs, an alternate approach considers each sample separately and then characterizes the variance of K across sample replicates. The latter approach was utilized since it offers the advantage of removing outlier values yielding a trimmed coefficient of variation. Given a set of expression measurements for two genes X (Ex) and Y (Ey) for each sample from a set of N samples, we define a connection parameter (Ki) for each sample. A linear fold change function generates symmetrical connection parameters between the two genes. Hence the network linkage may be considered bidirectional (thereby obviating consideration of both X→Y in addition to Y→X) (i).
| (i) |
| (ii) |
Z, is an optional sensitivity parameter that was nominally set to 1 for Ex>Ey and -1 for Ey>Ex. Outlier samples were generally excluded, except where noted, by setting δ to 1. Genes for analysis were required to exceed a median expression above a minimum platform threshold that was typically determined by a low expression spike in transcript or the signal limit at which ‘p detected’ exceeded 0.99.
A robust coefficient of variation (CVtrim) was calculated (expression ii) from the trimmed standard deviation (SD) about the median (MD). A limiting coefficient of variation (CVlimit) was selected as a comparator against which CVtrim may be assessed to determine whether the gene pair is sufficiently coherent across the samples to be included in a network. This approach was repeated for all possible gene pairs and visualization software such as Cytoscape (http://www.cytoscape.org/) [15] and Osprey (http://biodata.mshri.on.ca/osprey) [16] used to display the resulting networks. Since network size may be very large for well synchronized groups of samples and for small sample groups with a low degree of freedom, the CVlimit was adjusted to ensure that the networks were analytically tractable. Adjusting the selected CVlimit did not impact the general trends but small networks may lose stability while large networks present analytical challenges. Consequently the network sizes and CVlimits are reported for each dataset analyzed.
The approach permits several broad modes of coherence to be captured, from the minimal scenario where little information is shared between genes but transcripts are simply present at relatively stable levels, to the extreme case where variance across the samples for both genes is high, potentially exceeding group-median expression. The expression of the two genes is considered linked if the coefficient of variation in the connection parameter remains below a limiting threshold across biological replicates. Selection of stable sets of connection parameters that will tolerate outliers is critical to generating networks that are both inclusive and analytically tractable. The approach differs from a typical Pearson correlation where two genes that only show a stable signal would not be considered linked [12, 17]. It is also robust relative to outlier samples. A platform specific lower-expression limit is set for the inclusion of genes in the network but weighting is not quantitatively applied to increase connection strength between highly expressed genes.
Dataset Selection and Pre-Processing
Networks were generated from data retrieved from GEO, the NCBI gene expression omnibus. GEO was queried for large homogeneous and well controlled replicate group studies. Accordingly oncogenesis was emphasized to test trajectory reorganization throughout the progression of solid tumors since both the clonal stem-cell models [18] and non-clonal competitive stochastic models [19] suggest somewhat different paths. The selected datasets included GEO series GSE5747, GSE3231, GSE5764, GSE3744, GSE10072, GSE4271, GSE13041, GSE5287 and GSE3325.
Array expression data varies considerably by platform and variables from several platforms and array designs were considered in the network models. These include baseline sensitivity and linearity threshold as well as average isoform coverage per gene. To aid comparison between network models, only the Affymetrix (Human U133/U133+2/U133A, Mouse MOE430v2 & Arabidopsis ATH1) platforms were processed through the KNet coherent-network generation utility (available online at http://klab.med.wayne.edu/KNet). These platforms have relatively rich 3′ isoform coverage, but are necessarily limited relative to technologies such as mRNA-seq that can survey each exon. Details of data pre-processing are available in the Supplemental Methods.
Results
Coherence Models in Cell Differentiation & Cell Cycle Synchronization
To assess the ability of a coherence model to detect changes in cell function and synchronization between biological samples, two datasets assessing in-vitro differentiation (V6.5 embryonic stem cells) and synchronization (Arabidopsis) were assessed. Expression data from triplicate arrays of functional specification over a period of 12 days (NCBI GEO: GSE3231) was used to create datasets representing various stages of differentiation. In brief, Initial time point data were serially combined with the corresponding time course data from later time points (Supplemental Methods). Groups formed from samples measured at earlier time points were more functionally similar than groups formed by combining samples from the earliest with those from the latest time points since the differentiative states diverge rapidly over 12 days. Array data was analyzed using the KNet algorithm to identify pairs of genes with similar expression profiles. Prior to the onset of asymmetric division this yielded large and richly linked networks in excess of 800,000 gene pairs. As shown in Figure 1A, the time between samples that were used to construct groups increased, the size of the networks decreased approaching a stable lower limit that was fourfold smaller than the initial network [20]. A similar trend was observed when the level of synchronized cells was varied between datasets. Using the Arabidopsis data series GSE5747 (http://arabidopsis.org), the network size fell by 40% when synchronized and unsynchronized groups were compared (Supplemental Data GSE5747). The size of a network formed from coherently variable genes decreased in a similar manner as the degree of functional uniformity between samples declined. Both studies support the view that coherence models provide a useful measure to assess tissue uniformity at the transcriptional level.
Figure 1.

Summary of Networks formed as a function of differentiative state. The number of gene pairs (network edges) formed is compared to time (hours) (A) Triplicate ES cells from time point 0 were combined into sample groups with triplicate samples from later time points and network size assessed. (B) Healthy and Tumor tissue array data. Microarrays from healthy and tumor tissues were aggregated into mixed sets with an increasing percentage of tumor tissue. The size of the network decreased when the proportion of tumor tissue increased within the mixed datasets.
The application of the Decoherence Gene Pair Model, DGPM, was extended to describe the network characteristics of a range of tumors. To examine the generality of the model, in-situ breast carcinoma, non-small cell epithelial adenocarcinoma, astrocytoma and glioblastoma multiform and bladder tumors were examined. These were selected since increasing cellular heterogeneity acts as a common pathway towards malignancy arising from a clonal state that is frequently driven by increasing karyotype instability [21].
In-situ Breast Carcinoma
Similar to that observed in vitro, as oncogenesis progressed the stable or slightly increased level of coherent transcripts was followed by their rapid reduction. This was highlighted when invasive lobular and ductal breast carcinomas were contrasted with normal ductal and lobular breast tissues. Gene pair networks were constructed using the GSE5764 dataset [22] array data from ten mixed normal breast and ten mixed breast tumor samples. The size of networks in the malignant tissue was less than half that observed in normal healthy breast tissue. With a threshold coefficient of variance (CVLimit) of 0.07, the network size in normal breast tissues (NetworkNormalTissue) was 168 gene pairs, while in the tumor tissues (NetworkCarcinoma) was 32 pairs. The profile of expression instability was similar in tumor when compared to that in healthy tissue (Supplemental Figure 1a), indicating a specific difference in the way in which the unstable genes vary relative to each other. Accordingly, the difference between normal and tumor tissues cannot be ascribed to increased instability between tumor tissue samples.
To begin to dissect the underlying mechanism, normal and tumor tissue sample data were combined in varying proportions. Individual arrays from healthy tissue samples were serially combined into groups that had increasing numbers of breast cancer samples and the resulting sizes of the DGPM networks was determined. As shown in Figure 1B, increasing the proportion of tumor samples had the effect of serially reducing the size of the networks. This trend was qualitatively similar to the reduction in network size observed as stem cells differentiated (Figure 1A). Two models to tumor cell malignancy were considered and compared with the mixed healthy and tumor data. First, a common subset of expressed genes that simulated pathway disruption were coordinately perturbed between healthy tissue samples. Second, a relatively unconstrained and randomly selected set of expressed genes were disrupted in a similar manner. The unconstrained model of gene disruption was more similar to the observed data (Supplemental Figure 1B). While interesting, neither model unequivocally reiterated the observed trends, suggesting that oncogenesis requires both stochastic and pathway disruption.
Since GSE5764 contained a mixture of two types of breast cancers, an independent study (Supplemental Data GSE3744) of sporadic basal-like breast cancer was analyzed in a similar manner [23] to determine whether the results could be generalized to other breast cancers. A 24-fold decrease in the size of the tumor tissue gene-pair network was observed in sporadic basal-like breast tumors relative to the set of healthy breast tissue controls. As shown in Table 1, this trend was followed for tumors originating from diverse tissues exhibiting a range of grades. Unlike models that are gene, gene-set or network specific, the decoherence effect is relatively well conserved and likely arises from a similar progression towards cellular immortalization and invasion.
Table 1.
Changes in network size as a function of disease state.
| Disease | Change in Network Size | Fold change in network size relative to control condition |
|---|---|---|
| Breast Carcinomas (GSE5764) | Reduction in network size in malignant tumor tissue | -5 |
| Basal Cell-like Breast Carcinoma (GSE3744) | Reduction in network size in sporadic tumor tissue | -24 |
| Lung Adenocarcninoma (GSE994) | Reduction in network size in tumor biopsy | -17 |
| Astrocytoma (GSE4271) | Reduction in size of networks coincident with poor survival outcomes | -2 |
| Glioblastoma Multiform (GSE13041) | Reduction in size of networks in poor survival outcomes relative to median survival outcomes | -2 |
| Prostate cancer (GSE3325) | Reduction in size of networks in invasive tumors, no size difference noted between benign and primary tumors. | -3 |
| Smoking effects on the lung (GSE10072) | Small reduction in network size in general biopsy tissue, a small increase in epithelial cells | +1.8 (epithelial) |
| Advanced bladder cancer (GSE5287) | Reduction in network size amongst patients with a poor outcome post chemotherapy | -1.8 |
Non-Small Cell Epithelial Adenocarcinoma
To assess the generality of the DGPM several healthy and tumor datasets (GSE10072) were constructed from normal lung and non-small cell lung adenocarcinoma biopsies [24]. The large biopsy dataset was iteratively subdivided into smaller groups of randomly selected healthy and tumor lung biopsy samples. A total of 50 random sets, each comprising 23 biological samples were selected from the 58 adenocarcinoma biopsies and an equal number of sets were similarly selected from the 49 healthy lung biopsies. Networks formed from randomly selected subsets of adenocarcinomas were, in all cases, smaller than the networks formed from healthy lung. At their maximum size the coherence networks formed from adenocarcinomas, NetworkAdenocarcinoma 14 to 64 (mean 37 gene pairs) did not exceed 40% (CVLimit 0.07) of the size of the minimum network size formed from non-tumor lung biopsies NetworkNormal-Lung 167 to 1737 (mean 639 gene pairs). While the range of network sizes is large and may be impacted by a host of unknown parameters, the two network sets formed distinctly sized non-overlapping groups (p∼2e-32).
Although networks can be differentiated by size, they also possess relatively distinct topological signatures characterized by their linkage distribution and membership. When genes from multiple networks are considered in aggregate, an underlying superset of networked genes emerged. Approximately 95% of the genes in any single normal lung network were present in one or more of the other normal lung networks. The underlying healthy tissue aggregate networks were far removed from those of the tumor tissues with as few as 12% of the 1,569 genes in the aggregate healthy networks represented in the smaller adenocarcinoma networks. However, of the 191 genes in the adenocarcinoma network, 88% were present in the normal lung networks (Supplemental data). This suggests that considered in aggregate, the tumor networks are formed by ejecting pairs of coherent genes from healthy tissue networks while recruiting only a limited number of additional disease-linked coherent genes.
Several notable differences between the contents of the healthy and tumor networks emerged. For example, when the ontological groups formed from the individual genes in the pairs of covariant genes, the metal ion binding group was enriched ∼22 fold in the aggregate tumor networks relative to genes in the aggregate healthy tissue network (Supplemental Figure 2). This has been linked with differential expression amongst smokers [25]. In comparison, as summarized in Figure 2, the aggregate network of healthy lung tissues was richly connected, containing 1,569 genes with 5,375 network edges. Five highly connected gene hubs were evident that were virtually absent from the tumor networks. They comprised a set of genes with a documented role in either lung or other epithelial tissues, several of which were denoted as susceptible to disruption in adenocarcinoma. These included two ribosomal genes (RPL41, RPL23A) and three other genes (LYK5 (STRADA), SIRT3, EEF1A1) of a mixed cellular role. The hub gene LYK5 likely plays a key role in epithelial differentiation [26] and has been implicated in the development of adenocarcinoma [27]. As shown in Figure 3, it forms a core hub with 118 links to other transcripts in healthy lung tissue but its connectivity is greatly reduced in the adenocarcinoma network. The aggregate healthy lung networks were both large and stable while the tumor networks contained a small subset of weakly connected genes. This supports the view that the DGPM can be used to assess the degree of disruption to the transcriptome that occurs during oncogenesis and may provide an independent means to assess survival.
Figure 2.
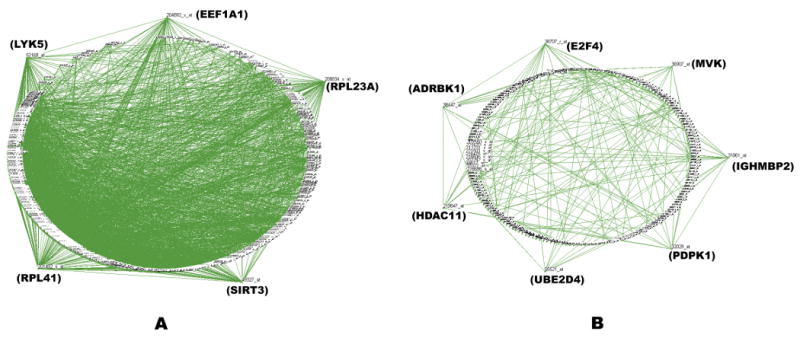
Networks formed from healthy and cancerous lung tissue. For clarity only nodes with 5 or more edges are shown. (A) Five hub-genes are evident upon combining 10 normal lung tissue networks. They form a stable super-network. (B) Seven hub-genes are evident upon combining 10 lung adenocarcinoma tissue networks. In contrast a sparser super-network is formed.
Figure 3.

Comparison of healthy tissue and tumor networks. Networks were created by cytoscape with genes arranged in a circular layout placed by their level of connectivity. Left panel, As indicated by the red lines LYK5 shows coherent expression with 118 other genes in a stable aggregate of ten healthy tumor tissue networks. Right panel, LYK5 shows coherent expression with only 2 genes as indicted by the red lines in a similar aggregate of 10 tumor tissue networks.
Survival Association in Astrocytoma and Glioblastoma Multiform & Bladder Tumors
As described above, network size may provide a tool to assess cancer survival when aneuploidy, polyploidy and genomic reorganization increase with tumor grade. Accordingly, the utility of the DGPM to infer cancer survival was assessed. Astrocytoma is a primary CNS tumor model in which grade and survival are well documented [28]. Survival times following a diagnosis of astrocytoma vary dramatically from decades for early detected grade I lesions to an average of 17 - 52 weeks for advanced grade IV tumors [29]. A subset of samples from GSE4271 was evaluated within the DGPM. Samples categorized as grade IV astocytoma with necrosis were selected and divided into two groups comprising patients who succumbed to their condition in less than 52 weeks and those who survived for greater than 120 weeks. Treatment options, stage at diagnosis and other variables were not controlled beyond those inherent to the corresponding design of the study from which the data was drawn.
Standard analytical approaches using t-test, LDA and hierarchical clustering to identify strongly predictive genes or gene sets that might indicate survival time were employed. This strategy did not identify any strong candidates that could differentiate between the patients with shorter and longer survival times (Supplemental Figure 3). By contrast the DGPM networks were substantially different. A decrease in excess of 3 fold of the size of the network was apparent when the poor survival (NetworkSurvival≤52weeks 67 gene pairs) outcome group was compared to the longer term (NetworkSurvival≥120weeks 213 gene pairs) survival group (CVLimit 0.08). The effect of a larger limiting covariance was assessed since tissue networks were relatively small. The sizes of the networks increased in both samples as a high degree polynomial (r=0.9), but as shown in Figure 4, the relationship of network sizes between short and longer-term survivors was stable.
Figure 4.

Network size as a function of the maximum permitted variance between two genes (CVlimit). Tissue samples from tumors of astrocytoma patients with short (red) and long (blue) survival times were used to generate coherence networks with a range of limiting coefficients of variation. As shown by the left ordinate, the network sizes increase as a near exponential function (r=0.98) of CVlimit. The relative sizes of the short and long survival time networks remain essentially constant (green) once the networks are beyond a lower size limit. As indicated by the right ordinate, long survival:short survival plateaus at approximately 200%.
Consistent with the adenocarcinoma data, astrocytoma tumor networks were also different in content and topology. Smaller networks may be as equally connected as larger networks, but the tumor networks from the poor survival outcome group were connected to a lesser extent when compared those from the tumors of individuals who survived for longer periods (1.04 and 2.1 edges per node respectively). As shown in Supplemental Figure 4, networks from both longer and shorter survival times resembled small world networks [30] possessing a few highly connected hubs. Edge-connectivity reduced in a log-linear manner as a function of network degree. Nonetheless there was a pronounced reduction in connectivity at all degrees when survival decreased.
Glioblastoma Multiforme (GBM) is considered an intractable grade IV astrocytomia that rapidly spreads through the cerebrospinal fluid with an untreated median survival time of under 100 days [31]. Array data (GSE13041) from GBM samples gathered during surgical intervention [32] were examined as two groups: tumors resected from patients with a poor survival outcome of under 100 days; and those from patients of longer than median survival 200 - 800 days. Each group contained a mixture of tumor grades. As expected the size of the DGPM networks fell as survival decreased (CVLimit 0.12; NetworkSurvival200-800 days : 7,583 gene pairs; NetworkSurvival<100 days 2,791 gene pairs). Interestingly, the highly connected nodes were enriched in ribosomal genes as noted in other tumor expression network studies [33] with over 70% of the most highly connected genes encoding large ribosomal subunit proteins. As survival time decreased the networks were somewhat less connected, yet became substantially more enriched with ribosomal genes. While the networks from the reference samples (GSE12649) from healthy prefrontal lobe [34] were considerably larger than those generated from tumor tissue, genes encoding ribosomal proteins were absent. The most highly connected genes in healthy tissues encoded a diverse but CNS-enriched linked set of genes. These included the neuronal receptor protein clathrin (CLTA) and KIF5C, a neuronal kinesin. This strongly argues that enrichment of linkage among ribosomal genes in the tumor tissue samples presents a surrogate marker of proliferative status in these tumors [35].
As shown by DGPM analysis of advance bladder tumors (GSE5287) the reduction in network size and connectivity in patient groups with a poor outcome is not CNS specific. In this case, patients were divided into two groups based upon their survival time post cisplatin chemotherapy. With a median survival period of 53 months, the networks formed from patients with a survival time of over 100 months was 80% larger than those formed from the patient group with a survival time less than 37 weeks (CVLimit 0.06; NetworkSurvival≥100months 3,746 gene pairs : NetworkSurvival<37 weeks 2,040 gene pairs).
Individuals who succumbed in a shorter length of time to GBM, bladder cancer and astrocytoma present smaller networks. The networks were structurally distinguishable by their degree of connectivity and the variability exhibited in hub-genes when compared to those found in normal tissues. Survival reflects selected treatment options, tumor origin and the individual's general health. Perhaps the the propensity for a tumor to aggressively invade into the surrounding and distant tissues is linked to its rate of differentiation. Accordingly, more rapidly differentiating tumors that can proliferate in multiple locations are likely to be less stable and hence less coherent when compared between cases than clonal and/or genetically stable tumors.
Prognostic Indicators in Prostatic Tumors
The DGPM utilizes a cutoff to determine whether a gene pair is introduced into the network. This can be used to clearly show that a reduction in network size concords with tumorigenicity. However, each possible gene pair is associated with a coherence parameter that as a continuous variable may capture additional information, e.g., early systemic perturbation. To examine the relative sensitivity of the coherence parameters to early stage tumors, six prostatic lesions from benign, early primary and later metastatic tumors were characterized (GSE3325) using the benign prostatic tissue as a reference [36]. The number of samples provided in this study was limiting and outlying samples were not trimmed. All gene pairs that met the threshold for coherence were assembled (CVLimit 0.02trimming omitted) NetworkBenign 631 gene pairs: NetworkPrimaryTumor 612 gene pairs: NetworkMalignantTumor 135 gene pairs). The signal ratio was calculated for each reference dataset pair then compared to the corresponding members in the primary and metastatic tumor datasets. Each pair was assigned a unique ID and the signal ratio plotted as a self organizing (Gene Expression Dynamics Inspector) GEDI map [37]. The dyad pairs in the map were constrained to their location in the benign state, creating a directly comparable series of 2D maps that follows tumor progression. As shown in Figure 5, a change in the network map is apparent when the primary and malignant states are compared. It is also evident that at the level of the individual dyad pair, the expression coherence of the gene pair may begin to fluctuate in the early stages of disease even though the network dimension and connectivity appear constant. One can thus introduce a tumor sample into a set of reference samples and observe the change in network parameters. These subtle variations likely provide an early indication of decoherence and associated change in tumor status.
Figure 5.

Visualization of a self organizing dyad-pairs network map of 32,000 elements using the Gene Expression Dynamics Inspector. Plotting the dyad ratios as a GEDI in benign prostate tissue enables rapid visualization of the ratios of the same dyad pairs in early tumor and invasive prostate tumors. Each point represents the same dyad pair in three different tissue states. Network size does not change significantly until the metastatic state is reached. Visualization shows that the dyad pairs begin to change color relative to the benign state even in the primary tumor. While there may not be an appreciable change in the number of genes passing the limiting coefficient of variation in the early stages of disease, subtle changes in the covariance between gene pairs are evident.
Discussion
Changes in gene expression between normal and tumor tissues that map to multiple points in biological networks are well documented [38, 39]. These changes are typically derived from the stably expressed genes that transition from healthy to disease states. The application of variably expressed genes to characterizing this transition has been marginalized. However, when groups of variable genes cohere, shared mechanisms of regulation may be inferred [40]. Where such underlying regulation leads to coherent expression, it is reasonable to extend the hypothesis that movement away from coherence reflects dysregulation.
As shown in the above, virtually all systems change their network dimension or linkage statistics when healthy tissues are compared with advanced tumor tissues. In the early stages tumorogenesis DGPM of solid tumors could be of a similar size or even larger than those in the healthy state. As tumorogenesis progressed and survival decreased any early increase in relative network size was always followed by a precipitous decrease in network size. Network composition in the later stages of the disease frequently changed from hubs comprised of highly connected tissue specific genes towards less highly connected hubs as exemplified by changes to networks encompassing the ribosomal protein genes [41]. One possibility is that transcription shifted from readily measured 3′ gene isoforms to unusual isoforms which were not well represented by the array platform or to which the platform was relatively insensitive. However. if this was the primary cause of network collapse, a large number of genes would need to exploit unusual 3′ isoforms that were not annotated in Refseq from which the platform was constructed. Preliminary Illumina GAII digital gene expression sequencing of the poly-adenylated termini of transcripts from normal and breast tumor tissue (data not shown) does not support this scenario. This supports the veracity of this approach towards detecting systems changes by parallels in network dimension or linkage statistics when healthy tissues are compared with advanced tumor tissues. This is typically reflected in network composition from hubs comprised of highly connected tissue specific genes towards less highly connected hubs.
The early stages of a neoplasm most likely correspond to rapid clonal expansion from a few proto-neoplastic cells. In the absence of strong resource competition, clonal expansion would be reflected as a coherent set of genes. As these cells proliferate and follow similar trajectories network expansion could be expected. Network collapse would then follow when rapidly competitive non-clonal evolution yields multiple lineages of tumor cells as they progress to aggressive metastasis [42]. As we have shown the DGPM is generalized and sensitive to the state of tumorogenesis but unlike many network models appears largely insensitive to the tissue of origin.
A range of models have been proposed to describe the divergence of cellular transcription from a homeostatic state to early clonal and later metastatic stages of cancers. These may be either deterministic or stochastic depending on whether sets of specific oncogenes or oncogene networks, common to most tumors, are proposed. Models in which karyotypic instability lead to successive chromosomal rearrangements and heterogeneous transcriptomes also require consideration. In this case expression varies stochastically until a dominant niche-specific state takes hold. Hybrid models in which constrained stochastic expression is influenced by attractor expression states towards convergence can also be considered. To an extent the DGPM can be used to differentiate between these models. As shown in Supplemental Figure 1B, by introducing specifically perturbed variants to healthy breast tissue the DGPM captured an intersection of the stochastic and deterministic models. Accordingly, the DGPM supports the view of a largely stochastic progression towards attractor states rendering the tumor profiles more similar than would be expected from a random progression alone. Further insight could be gained by exploring data stratified over time by the individual or the tumor. If sub-sets of expression profiles could be disaggregated, this would allow the pathways of expression vectors towards any attractor states to be mapped and contrasted within and between tumors. However, at present the rich time-series data needed to conduct such an analysis is not part of the GEO series that were subject to analysis. The use of high throughput RNA-seq platforms, to address these issues is on the horizon.
Ultimately network models may offer a degree of systems level insight [43, 44] into complex diseases [17, 45]. We have presented examples of solid-tumors from which coherence networks can provide insight into early cell state transitions. The prospect of biopsying a tumor sample and combining its array data with a group of reference arrays from suitably matched healthy samples to characterize changes in aggressiveness has the potential to provide a useful insight for personalized medicine.
Supplementary Material
Supplemental Methods
Supplemental Data
Supplemental Figure 1a: Coefficient of variation for expressed genes across normal breast and tumor tissues.
Figure 1b: Two models of gene disruption in breast tumor tissues
Supplemental Figure 2: Ontology mapping of gene pairs from normal lung and tumor tissue
Supplemental Figure 3: Clustering of an expression subset from long and short survival patients
Supplemental Figure 4: Network connectivity distribution from long and short survival Astrocytoma and GBM patients.
Acknowledgments
This work was supported by the Charlotte B. Failing Professorship in Fetal Therapy and Diagnosis to SAK and NIH grant R01CA131490-01 to B. Sloane, Department of Pharmacology, Wayne State University School of Medicine.
Abbreviations
- GBM
Glioblastoma Multiforme
- CV
Coefficient of Variation
Footnotes
Publisher's Disclaimer: This is a PDF file of an unedited manuscript that has been accepted for publication. As a service to our customers we are providing this early version of the manuscript. The manuscript will undergo copyediting, typesetting, and review of the resulting proof before it is published in its final citable form. Please note that during the production process errors may be discovered which could affect the content, and all legal disclaimers that apply to the journal pertain.
References
- 1.Lalancette C, Platts AE, Lu Y, Lu S, Krawetz SA. Computational identification of transcription frameworks of early committed spermatogenic cells. Mol Genet Genomics. 2008;280(3):263–74. doi: 10.1007/s00438-008-0361-2. [DOI] [PMC free article] [PubMed] [Google Scholar]
- 2.Huang S, Eichler G, Bar-Yam Y, Ingber DE. Cell fates as high-dimensional attractor states of a complex gene regulatory network. Physical Review Letters. 2005;94(12) doi: 10.1103/PhysRevLett.94.128701. p. - [DOI] [PubMed] [Google Scholar]
- 3.Weitzman JB. Co-regulation of mouse genes predicts function. J Biol. 2004;3(5):19. doi: 10.1186/jbiol18. [DOI] [PMC free article] [PubMed] [Google Scholar]
- 4.Bonnefont X, et al. Revealing the large-scale network organization of growth hormone-secreting cells. Proc Natl Acad Sci U S A. 2005;102(46):16880–5. doi: 10.1073/pnas.0508202102. [DOI] [PMC free article] [PubMed] [Google Scholar]
- 5.Arjona A, Sarkar DK. The circadian gene mPer2 regulates the daily rhythm of IFN-gamma. J Interferon Cytokine Res. 2006;26(9):645–9. doi: 10.1089/jir.2006.26.645. [DOI] [PubMed] [Google Scholar]
- 6.Storch KF, Lipan O, Leykin I, Viswanathan N, Davis FC, Wong WH, Weitz CJ. Extensive and divergent circadian gene expression in liver and heart. Nature. 2002;417(6884):78–83. doi: 10.1038/nature744. [DOI] [PubMed] [Google Scholar]
- 7.Anway MD, Leathers C, Skinner MK. Endocrine disruptor vinclozolin induced epigenetic transgenerational adult-onset disease. Endocrinology. 2006;147(12):5515–23. doi: 10.1210/en.2006-0640. [DOI] [PMC free article] [PubMed] [Google Scholar]
- 8.Stuart JM, Segal E, Koller D, Kim SK. A gene-coexpression network for global discovery of conserved genetic modules. Science. 2003;302(5643):249–55. doi: 10.1126/science.1087447. [DOI] [PubMed] [Google Scholar]
- 9.Klebanov LB, Yakovlev AY. A nitty-gritty aspect of correlation and network inference from gene expression data. Biol Direct. 2008;3:35. doi: 10.1186/1745-6150-3-35. [DOI] [PMC free article] [PubMed] [Google Scholar]
- 10.Baianu IC. Łukasiewicz-Topos Models of Neural Networks, Cell Genome and Interactome Nonlinear Dynamic Model. 2007 Available from: http://cogprints.org/3701/
- 11.Lalancette C, Platts AE, Johnson GD, Emery BR, Carrell DT, Krawetz SA. Identification of human sperm transcripts as candidate markers of male fertility. J Mol Med. 2009 doi: 10.1007/s00109-009-0485-9. [DOI] [PubMed] [Google Scholar]
- 12.Liang S, Fuhrman S, Somogyi R. Reveal, a general reverse engineering algorithm for inference of genetic network architectures. Pac Symp Biocomput. 1998:18–29. [PubMed] [Google Scholar]
- 13.Park J, Barabasi AL. Distribution of node characteristics in complex networks. Proc Natl Acad Sci U S A. 2007;104(46):17916–20. doi: 10.1073/pnas.0705081104. [DOI] [PMC free article] [PubMed] [Google Scholar]
- 14.Ruan X, Wang J, Li H, Perozzi RE, Perozzi EF. The use of logic relationships to model colon cancer gene expression networks with mRNA microarray data. J Biomed Inform. 2008;41(4):530–43. doi: 10.1016/j.jbi.2007.11.006. [DOI] [PubMed] [Google Scholar]
- 15.Shannon P, Markiel A, Ozier O, Baliga NS, Wang JT, Ramage D, Amin N, Schwikowski B, Ideker T. Cytoscape: a software environment for integrated models of biomolecular interaction networks. Genome Res. 2003;13(11):2498–504. doi: 10.1101/gr.1239303. [DOI] [PMC free article] [PubMed] [Google Scholar]
- 16.Breitkreutz BJ, Stark C, Tyers M. Osprey: a network visualization system. Genome Biol. 2003;4(3):R22. doi: 10.1186/gb-2003-4-3-r22. [DOI] [PMC free article] [PubMed] [Google Scholar]
- 17.Butte AJ, Kohane IS. Mutual information relevance networks: functional genomic clustering using pairwise entropy measurements. Pac Symp Biocomput. 2000:418–29. doi: 10.1142/9789814447331_0040. [DOI] [PubMed] [Google Scholar]
- 18.Matsui W, Huff CA, Wang Q, Malehorn MT, Barber J, Tanhehco Y, Smith BD, Civin CI, Jones RJ. Characterization of clonogenic multiple myeloma cells. Blood. 2004;103(6):2332–6. doi: 10.1182/blood-2003-09-3064. [DOI] [PMC free article] [PubMed] [Google Scholar]
- 19.Heng HH, Bremer SW, Stevens J, Ye KJ, Miller F, Liu G, Ye CJ. Cancer progression by non-clonal chromosome aberrations. J Cell Biochem. 2006;98(6):1424–35. doi: 10.1002/jcb.20964. [DOI] [PubMed] [Google Scholar]
- 20.Hailesellasse Sene K, Porter CJ, Palidwor G, Perez-Iratxeta C, Muro EM, Campbell PA, Rudnicki MA, Andrade-Navarro MA. Gene function in early mouse embryonic stem cell differentiation. BMC Genomics. 2007;8:85. doi: 10.1186/1471-2164-8-85. [DOI] [PMC free article] [PubMed] [Google Scholar]
- 21.Duesberg P, Rausch C, Rasnick D, Hehlmann R. Genetic instability of cancer cells is proportional to their degree of aneuploidy. Proc Natl Acad Sci U S A. 1998;95(23):13692–7. doi: 10.1073/pnas.95.23.13692. [DOI] [PMC free article] [PubMed] [Google Scholar]
- 22.Turashvili G, et al. Novel markers for differentiation of lobular and ductal invasive breast carcinomas by laser microdissection and microarray analysis. BMC Cancer. 2007;7:55. doi: 10.1186/1471-2407-7-55. [DOI] [PMC free article] [PubMed] [Google Scholar]
- 23.Richardson AL, et al. X chromosomal abnormalities in basal-like human breast cancer. Cancer Cell. 2006;9(2):121–32. doi: 10.1016/j.ccr.2006.01.013. [DOI] [PubMed] [Google Scholar]
- 24.Landi MT, et al. Gene expression signature of cigarette smoking and its role in lung adenocarcinoma development and survival. PLoS ONE. 2008;3(2):e1651. doi: 10.1371/journal.pone.0001651. [DOI] [PMC free article] [PubMed] [Google Scholar]
- 25.Zhang X, Liu G, Lenburg ME, Spira A. Comparison of smoking-induced gene expression on Affymetrix Exon and 3′-based expression arrays. Genome Inform. 2007;18:247–57. [PubMed] [Google Scholar]
- 26.Baas AF, Kuipers J, van der Wel NN, Batlle E, Koerten HK, Peters PJ, Clevers HC. Complete polarization of single intestinal epithelial cells upon activation of LKB1 by STRAD. Cell. 2004;116(3):457–66. doi: 10.1016/s0092-8674(04)00114-x. [DOI] [PubMed] [Google Scholar]
- 27.de Leng WW, et al. STRAD in Peutz-Jeghers syndrome and sporadic cancers. J Clin Pathol. 2005;58(10):1091–5. doi: 10.1136/jcp.2005.026013. [DOI] [PMC free article] [PubMed] [Google Scholar]
- 28.Phillips HS, et al. Molecular subclasses of high-grade glioma predict prognosis, delineate a pattern of disease progression, and resemble stages in neurogenesis. Cancer Cell. 2006;9(3):157–73. doi: 10.1016/j.ccr.2006.02.019. [DOI] [PubMed] [Google Scholar]
- 29.Daumas-Duport C, Scheithauer B, O'Fallon J, Kelly P. Grading of astrocytomas. A simple and reproducible method. Cancer. 1988;62(10):2152–65. doi: 10.1002/1097-0142(19881115)62:10<2152::aid-cncr2820621015>3.0.co;2-t. [DOI] [PubMed] [Google Scholar]
- 30.Watts DJ. Princeton studies in complexity. Princeton, N.J.: Princeton University Press; 1999. Small worlds : the dynamics of networks between order and randomnes; p. xv, 262. [Google Scholar]
- 31.Stupp R, et al. Radiotherapy plus concomitant and adjuvant temozolomide for glioblastoma. N Engl J Med. 2005;352(10):987–96. doi: 10.1056/NEJMoa043330. [DOI] [PubMed] [Google Scholar]
- 32.Lee Y, et al. Gene expression analysis of glioblastomas identifies the major molecular basis for the prognostic benefit of younger age. BMC Med Genomics. 2008;1:52. doi: 10.1186/1755-8794-1-52. [DOI] [PMC free article] [PubMed] [Google Scholar]
- 33.Prieto C, Risueno A, Fontanillo C, De las Rivas J. Human gene coexpression landscape: confident network derived from tissue transcriptomic profiles. PLoS ONE. 2008;3(12):e3911. doi: 10.1371/journal.pone.0003911. [DOI] [PMC free article] [PubMed] [Google Scholar]
- 34.Iwamoto K, Bundo M, Kato T. Altered expression of mitochondria-related genes in postmortem brains of patients with bipolar disorder or schizophrenia, as revealed by large-scale DNA microarray analysis. Hum Mol Genet. 2005;14(2):241–53. doi: 10.1093/hmg/ddi022. [DOI] [PubMed] [Google Scholar]
- 35.Yamashita D, Sano Y, Adachi Y, Okamoto Y, Osada H, Takahashi T, Yamaguchi T, Osumi T, Hirose F. hDREF regulates cell proliferation and expression of ribosomal protein genes. Mol Cell Biol. 2007;27(6):2003–13. doi: 10.1128/MCB.01462-06. [DOI] [PMC free article] [PubMed] [Google Scholar]
- 36.Varambally S, et al. Integrative genomic and proteomic analysis of prostate cancer reveals signatures of metastatic progression. Cancer Cell. 2005;8(5):393–406. doi: 10.1016/j.ccr.2005.10.001. [DOI] [PubMed] [Google Scholar]
- 37.Eichler GS, Huang S, Ingber DE. Gene Expression Dynamics Inspector (GEDI): for integrative analysis of expression profiles. Bioinformatics. 2003;19(17):2321–2. doi: 10.1093/bioinformatics/btg307. [DOI] [PubMed] [Google Scholar]
- 38.Ware JL. Growth factor network disruption in prostate cancer progression. Cancer Metastasis Rev. 1998;17(4):443–7. doi: 10.1023/a:1006114527274. [DOI] [PubMed] [Google Scholar]
- 39.Sadikovic B, Yoshimoto M, Chilton-MacNeill S, Thorner P, Squire JA, Zielenska M. Identification of interactive networks of gene expression associated with osteosarcoma oncogenesis by integrated molecular profiling. Hum Mol Genet. 2009;18(11):1962–75. doi: 10.1093/hmg/ddp117. [DOI] [PubMed] [Google Scholar]
- 40.Yu H, Luscombe NM, Qian J, Gerstein M. Genomic analysis of gene expression relationships in transcriptional regulatory networks. Trends Genet. 2003;19(8):422–7. doi: 10.1016/S0168-9525(03)00175-6. [DOI] [PubMed] [Google Scholar]
- 41.Ross DT, et al. Systematic variation in gene expression patterns in human cancer cell lines. Nat Genet. 2000;24(3):227–35. doi: 10.1038/73432. [DOI] [PubMed] [Google Scholar]
- 42.Merlo LM, Pepper JW, Reid BJ, Maley CC. Cancer as an evolutionary and ecological process. Nat Rev Cancer. 2006;6(12):924–35. doi: 10.1038/nrc2013. [DOI] [PubMed] [Google Scholar]
- 43.Gustin MP, Paultre CZ, Randon J, Bricca G, Cerutti C. Functional meta-analysis of double connectivity in gene coexpression networks in mammals. Physiol Genomics. 2008;34(1):34–41. doi: 10.1152/physiolgenomics.00008.2008. [DOI] [PubMed] [Google Scholar]
- 44.Lee DS, Park J, Kay KA, Christakis NA, Oltvai ZN, Barabasi AL. The implications of human metabolic network topology for disease comorbidity. Proc Natl Acad Sci U S A. 2008;105(29):9880–5. doi: 10.1073/pnas.0802208105. [DOI] [PMC free article] [PubMed] [Google Scholar]
- 45.Aggarwal A, et al. Topological and functional discovery in a gene coexpression meta-network of gastric cance. Cancer Res. 2006;66(1):232–41. doi: 10.1158/0008-5472.CAN-05-2232. [DOI] [PubMed] [Google Scholar]
Associated Data
This section collects any data citations, data availability statements, or supplementary materials included in this article.
Supplementary Materials
Supplemental Methods
Supplemental Data
Supplemental Figure 1a: Coefficient of variation for expressed genes across normal breast and tumor tissues.
Figure 1b: Two models of gene disruption in breast tumor tissues
Supplemental Figure 2: Ontology mapping of gene pairs from normal lung and tumor tissue
Supplemental Figure 3: Clustering of an expression subset from long and short survival patients
Supplemental Figure 4: Network connectivity distribution from long and short survival Astrocytoma and GBM patients.