Abstract
Purpose
Vessel deformations have been implicated in endoluminal device fractures, and thus better understanding of these deformations could be valuable for device regulation, evaluation, and design. The purpose of this study is to describe geometric changes of the superficial femoral artery (SFA) resulting from hip and knee flexion in older subjects.
Material and Methods
The SFAs of seven healthy subjects aged 50–70 years were imaged using magnetic resonance angiography with legs straight and with hip and knee flexion. From geometric models constructed from these images, axial, twisting, and bending deformations were quantified.
Results
There was greater shortening in the bottom third of the SFA than the top two thirds (mean±standard deviation) (Top=5.9±3.0%, Middle=6.7±2.1%, Bottom=8.1±2.0%) (P<0.05), significant twist in all sections (Top=1.3±0.8°/cm, Middle=1.8±1.1°/cm, Bottom=2.1±1.3°/cm), and greater curvature increase in the bottom third than the top two thirds (Top=0.15±0.06cm−1, Middle=0.09±0.07cm−1, Bottom=0.41±0.22cm−1) (P<0.001).
Conclusions
The SFA tends to deform more in the bottom third than the other sections, likely due to less musculoskeletal constraint distal to the adductor canal and vicinity to knee flexion. The SFAs of these older subjects curve off-axis with normal joint flexion, probably resulting from known loss of arterial elasticity with age. This slackening of the vessel enables a method for non-invasive quantification of in vivo SFA strain, which may be valuable for treatment planning and device design. In addition, the spatially-resolved arterial deformations quantified in this study may be useful for commercial and regulatory device evaluation.
INTRODUCTION
Aging and atherosclerosis are accompanied by geometric, material, and consequentially, deformational changes in arteries. For example, age is correlated with a decrease in elastin content in the abdominal aorta concomitant with increased diameter, and increased stiffness as evidenced by decreased diametric pulsatility and increased pulse propagation speed (1–8). Additionally, these effects may be exacerbated by added tissue stiffening resulting from the process of atherosclerosis (9). While these effects have been well documented in relation to the radial/circumferential structure of arteries, they are not well understood in relation to the longitudinal direction.
Arterial stress and strain may be important characteristics for the understanding of disease processes as well as for diagnosis and therapeutic strategy. For example, it has been shown that circumferential cyclic strain and deformations can cause cellular proliferation and chronic vessel re-injury as well as modulate gene expression hypothesized to affect the process of atherosclerosis (10, 11). Also, it has been shown that decreases in axial strain and tension in an artery, which can be instigated by vessel lengthening and/or a loss of axial elasticity, can generate a proliferative tissue response (12). Finally, arterial stiffness has been documented to vary with age and the state of vascular disease (13). Thus, quantification of axial arterial strain may be a useful tool for describing the health and perhaps predicting the progression of disease in blood vessels. In addition, the knowledge of arterial strain may be able to guide therapeutic strategy.
Consider the superficial femoral artery (SFA), an artery prone to the development of atherosclerotic disease, for which current surgical and interventional treatments, such as endarterectomy and angioplasty plus stenting, are far from optimal (14–16). The prevalence of atherosclerotic disease and restenosis subsequent to treatment may be caused by proliferative biology influenced by inadequate vessel healing, alteration of hemodynamic conditions, traumatic injury, and cellular mechanobiology (17–25). These mechanisms can all be related to the biomechanics of the SFA. In addition to the arterial stress and strain factors mentioned above, adverse hemodynamic conditions such as slow flow, low wall shear stress, and oscillations in wall shear stress can be affected by tortuous vascular geometry, a corollary with a loss of longitudinal tension (18–22). Furthermore, injury caused by stent-vessel interactions, especially in the presence of stent fracture, are hypothesized to cause clinical sequelae and have been hypothesized to be related to the biomechanics of SFA deformations (23–26).
To realize the benefits of describing axial vessel deformations, the methods of quantification must be able to be accomplished in vivo with minimal morbidity. For example, while the method of arterial resection and subsequent length change measurement has been performed experimentally, it is not viable for patient care (27). We present novel methods for quantifying axial deformations of the superficial femoral artery (SFA), in vivo, using magnetic resonance angiography (MRA) and simple musculoskeletal manipulation. We provide these 3D deformations of the SFA, along with torsion and bending deformations, in adults aged 50–70 years, resolved along the length of the artery.
MATERIALS AND METHODS
Subjects and Imaging Protocol
Seven male adults, aged 50–70 years, were imaged in a General Electric 1.5T Signa MR scanner (GE Medical Systems, Milwaukee, WI). Six of the seven volunteers had age-expected hypertension and hypercholesterolemia, however, all were physically active and controlled their risk factors with medication. One subject had undergone coronary stenting following infarction, and another had smoked for 30 years, however, neither exhibited symptoms of cardiovascular disease. The subjects were imaged in the supine position (Figure 1A), and then left decubitus with hip and knee flexion angles to be at least equal to the maximum flexion angles during a normal gait cycle (Figure 1B) (28). Gadolinium-enhanced MRA was performed for each subject with a transmit/receive torso coil for both body positions. The study protocol was approved by an Institutional Review Board and written consent was obtained from each volunteer.
Figure 1.
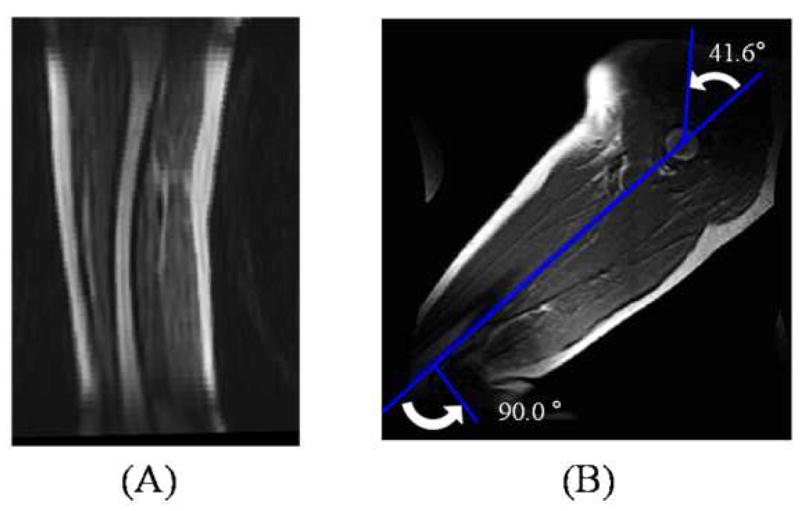
Magnetic resonance angiography was performed in the (A) supine position and in a (B) position with partial hip and knee flexion.
Oblique MRA volumes were prescribed by localizers to encompass the superficial femoral arteries of both legs. It was confirmed by non-contrast MRA prior to contrast injection that the femoropopliteal arteries were included at least from the profunda femoris artery to the most superior genicular artery (sometimes including the most superior portion of the popliteal arteries as well). For each subject, a time-resolved MRA pulse sequence (GE TRICKS) was employed to capture multiple temporal phases, with a temporal resolution of 16 to 22 sec, in total lasting 3 to 5 minutes. The scan parameters were: 8 msec repetition time, 1.6 msec echo time, 45° flip angle, 42 to 48 cm square field-of-view, 512 by 224 acquisition matrix, 48 to 54 slices, and 2.6 mm slice thickness with 1.3 mm overlap. For each of the two body positions, 20 mL of MultiHance gadolinium (Bracco Diagnostics, Inc., Milan, Italy) was injected via intravenous catheter into the antecubital vein of the right arm at a rate of 3 mL/sec followed by 20 mL of saline flush at 3 mL/sec.
Image Processing and Vessel Path Identification
Each MRA volume data set was corrected for slice-direction gradient warping (29), and the temporal phase with the optimal arterial visualization was selected for image processing and geometric quantification. Hip flexion was measured as the angle between the superior-inferior axis of the torso and the femur, while knee flexion was defined as the angle between the femur and the tibia. For both limbs, approximate centerline spline paths were constructed by hand-picked points, using custom modeling software (30), for the iliofemoral path and all of its identifiable branches, including the profunda femoris artery, descending genicular artery, superior medial and lateral genicular arteries, and unnamed muscle branches (Figure 2A). Perpendicular 2D lumen boundaries were then determined on these approximate centerlines using a level set method (31), image intensity thresholding, or manual segmentation (Figure 2B), from which lumen centroids were found and refined centerlines were constructed with cubic splines (Figure 2C). These centerline splines are analytic representations of the path, which were used to perform mathematical quantification of path characteristics, such as arc length, twist, and curvature. For curvature calculations, a 30-mode Fourier smoothing step was performed on these spline curves to eliminate artificial jaggedness caused by interpolation.
Figure 2.
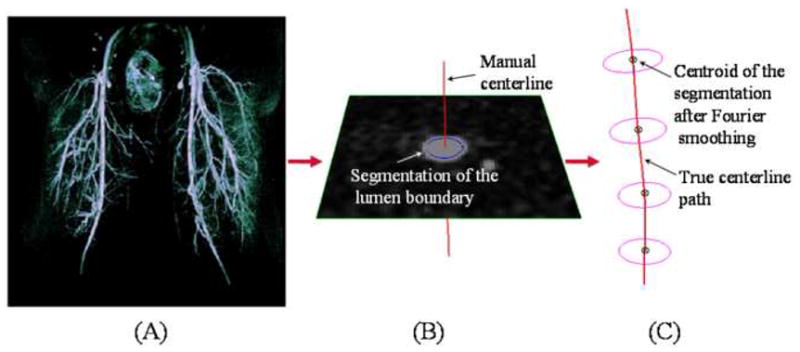
Centerline paths of the superficial femoral artery and its branches were constructed for geometric analysis. (A) Approximate centerline paths were identified by hand from magnetic resonance angiography volumetric data, next, (B) lumen boundaries were found by two-dimensional segmentation, and last, (C) true centerline paths were constructed from these segmentations.
Arterial Deformation Quantification
Before deformations could be quantified, the ostia of branch arteries were identified as fiducial markers. From views perpendicular to the branches at the ostia, center points of the ostial lumens were selected manually. This process was performed by one operator in dual image volumes simultaneously to minimize errors associated with manual operation (Figure 3A). Branch bifurcation points were defined as the projection points of the branch vessel paths onto the SFA centerline (Figure 3B). The projected bifurcation points were used as fiducial markers to determine the corresponding SFA segments, between branch vessels, for the straight and flexed leg positions to compute axial length change, axial twist, and curvature values.
Figure 3.
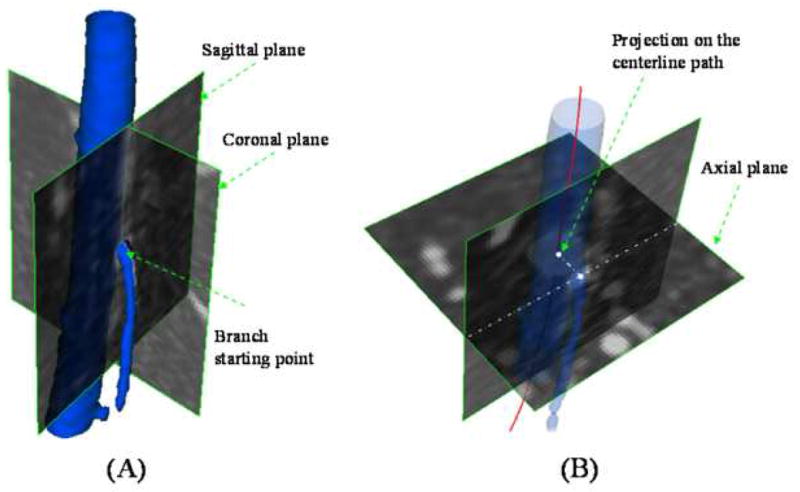
Branch vessel fiducial markers were identified on the centerline path of the superficial femoral artery (SFA). (A) Lumen centers of branch artery ostia were identified, and then (B) these points were projected onto the SFA centerline to determine bifurcation points.
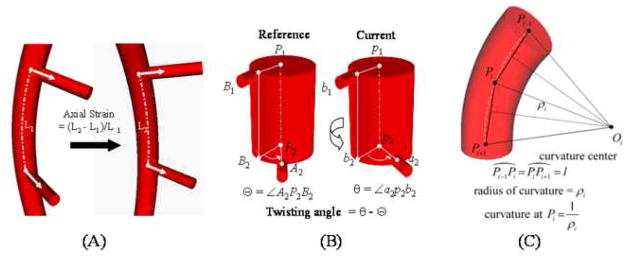
Axial length was defined from the supine to flexed leg position as the change in arc length between two adjacent branch points normalized to the supine position arc length (Figure 4A). Axial twist was defined as the absolute change (in degrees), due to leg flexion, in angle of separation between two adjacent arterial branch takeoff vectors. In the simplest case, the vessel is straight in both configurations, and the twisting angle is the difference of the angles of separation (Figure 4B). However, actual vessel deformations are a superposition of length change, planar bending, out-of-plane torsion, and axial twisting effects. As such, the off-axis components were separated from the total deformation to obtain pure twisting (32). Change in curvature was computed as the average change in curvature for a particular arc length window size (Figure 4C). The window size was selected by maximizing an off-axis deflection metric cost function as described in Appendix A.
Figure 4.
Arterial deformations were quantified using the centerline paths of the main vessel and its branches. (A) Axial strain was calculated by the percent change in centerline path length from one state to another, (B) twisting angle was defined as the change in angle of separation between two branch vectors off of the main vessel path, and (C) change in curvature of a vessel segment was computed as the difference in centerline path curvature between two states where ‘l’ is the arclength between adjacent sampled points.
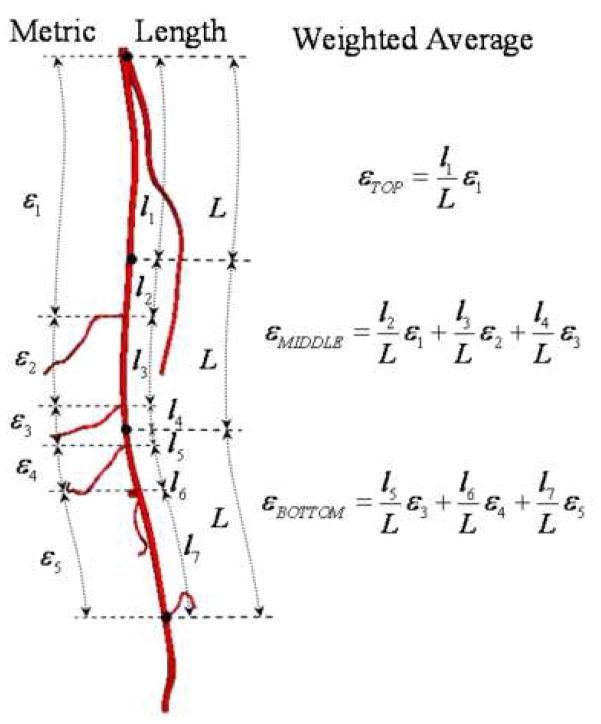
We observed dramatic variations in lower extremity vascular anatomy in terms of number of muscle branches, location of branches, and distance between branches. In order to enable statistical analysis of the quantitative data, we computed the deformations of each SFA for equal thirds of top, middle, and bottom along the vessel path by linear weighted averages (Figure 5). These thirds were established using the supine data set, with the profunda femoris and the most superior geniculate as the superior and inferior boundaries, respectively. These same two branch vessels were then used to set the boundaries of the vessel in the flexed position. Axial length changes and axial twist rates were averaged for each third, while curvature changes were presented as maximums for each third to indicate maximum off-axis vessel buckling.
Figure 5.
For axial length and axial twist deformations, average values were calculated for the top, middle, and bottom thirds of the artery. The averages were computed by weighting the deformations of the vessel segments (between branch points) by their respective arc lengths.
Statistical Analysis
Deformation quantities were compared between different sections of the SFA using paired, two-tailed t-tests with post-hoc Holm-Bonferroni correction for multiple comparisons, with a p-value corresponding to a probability of type I error less than 5% (33). F-tests were performed to query differences in variance between populations of data. Based on a previous study, the left and right SFA deformations were grouped together for all statistical calculations for a total of 14 unique data sets (25). All calculations were performed using the statistical package in Microsoft Excel.
RESULTS
All data are presented as mean ± standard deviation. The seven male subjects in the study population were 56 ± 5 years old (range 51–65 years), 178 ± 9 cm tall (range: 168–193 cm), and weighed 87 ± 9 kg (range: 73–98 kg). Their hip and knee flexion angles were 39 ± 6° (range: 32–50°) and 86 ± 6° (range: 75–93°), respectively. Quantitative deformation metrics of arc length change, axial twist rate, maximum curvature change from supine to flexed positions for the subject population are shown in Table. In addition, maximum curvatures for the supine and flexed positions are shown in the right two columns. Data are shown for each of the top, middle, and bottom thirds, as well as for the top and middle thirds combined (TM), middle and bottom thirds combined (MB), and the entire SFA combined (TMB) (Table).
Table .
The left three columns show arc length change, axial twist rate, and maximum curvature change deformations of the top, middle, and bottom thirds of the superficial femoral artery (SFA), along with deformations for the top and middle combined (TM), middle and bottom combined (MB), and entire SFA combined (TMB). The right two columns show the maximum curvatures of the SFA in the supine and flexed positions for the top, middle, bottom, TM, MB, and TMB portions of the SFA.
| Length Change (%) | Axial Twist Rate (°/cm) | Curvature Change (1/cm) | Supine Curvature (1/cm) | Flexed Curvature (1/cm) | |
|---|---|---|---|---|---|
| Top | −5.9 +/− 3.0 | 1.3 +/− 0.8 | 0.15 +/− 0.06 | 0.11 +/− 0.05 | 0.21 +/− 0.07 |
| Middle | −6.7 +/− 2.1 | 1.8 +/− 1.1 | 0.09 +/− 0.07 | 0.08 +/− 0.01 | 0.14 +/− 0.06 |
| Bottom | −8.1 +/− 2.0 | 2.1 +/− 1.3 | 0.41 +/− 0.22 | 0.11 +/− 0.06 | 0.47 +/− 0.24 |
| TM | −6.3 +/− 2.2 | 1.5 +/− 1.0 | 0.15 +/− 0.06 | 0.12 +/− 0.05 | 0.21 +/− 0.06 |
| MB | −7.4 +/− 1.6 | 1.9 +/− 1.2 | 0.41 +/− 0.22 | 0.11 +/− 0.05 | 0.47 +/− 0.24 |
| TMB | −6.9 +/− 1.9 | 1.7 +/− 1.1 | 0.41 +/− 0.22 | 0.14 +/− 0.06 | 0.47 +/− 0.24 |
The average changes in arc length of the SFA were −5.9 ± 3.0 %, −6.7 ± 2.1 %, and −8.1 ± 2.0 % for the top, middle, and bottom thirds, respectively, and all represented significant shortening (P < 0.001). The shortening observed in the bottom third was significantly greater than that of the top third (P < 0.005) as well as the top two thirds combined (P < 0.005). In addition, the variability in percent shortening of the top third was greater than that of the bottom two thirds (P < 0.05).
The axial twist rates were 1.3 ± 0.8 °/cm, 1.8 ± 1.1 °/cm, and 2.1 ± 1.3 °/cm for the top, middle, and bottom thirds of the SFA, respectively. The amount of axial twist due to hip and knee flexion was found to be significant for all sections of the SFA (P < 0.01). Although there were no significant differences in twist between the three sections of the SFA, there was a trend towards greater twisting moving inferiorly along the SFA.
In the supine position, the maximum curvatures were 0.11 ± 0.05 cm−1, 0.08 ± 0.01 cm−1, and 0.11 ± 0.06 cm−1 for the top, middle, and bottom thirds of the SFA, respectively. While there were no significant differences in maximum curvature between the thirds, the middle third had less variability than the top and bottom thirds (P < 0.001). In the flexed position, the maximum curvatures were 0.21 ± 0.07 cm−1, 0.14 ± 0.06 cm−1, and 0.47 ± 0.24 cm−1 for the top, middle, and bottom thirds of the SFA, respectively. The bottom third exhibited the greatest maximum curvature, followed by the top third, and then least in the middle third (bottom > top > middle, P < 0.01). The bottom third also exhibited greater population variability in maximum curvature compared to the top and middle thirds (P < 0.001). The maximum changes in curvature when bending from supine to flexed leg position were 0.15 ± 0.06 cm−1, 0.09 ± 0.07 cm−1, and 0.41 ± 0.22 cm−1 for the top, middle, and bottom thirds of the SFA, respectively (P < 0.005). The SFA showed greatest curvature change in the bottom third, next in the top third, and least in the middle third (bottom > top > middle, P < 0.005). In addition, the variability in maximum curvature change was significantly greater in the bottom third as compared to the top and middle thirds (P < 0.001).
DISCUSSION
For the population in this study, the observation that shortening of the SFA due to leg flexion was greater in the bottom third as compared to the top two-thirds (P < 0.005) is likely due to the fact that knee flexion was significantly greater than hip flexion (P < 0.001). In addition, the greater variability of arc length shortening in the top third of the SFA is likely due to the lesser musculoskeletal constraints around the hip as compared to the knee. The non-significant trend for greater twisting in the inferior sections of the SFA could be due to greater flexion in the knee as already mentioned, as well as the more complex musculoskeletal influences on the geniculate branches as described in Cheng et al. (25).
The spatially-resolved curvature metrics for the SFA reveal markedly non-uniform deformations. In the straight leg position, the SFA appears to be relatively straight for the entire length, however, with hip and knee flexion, the curvature values become disparate (bottom > top > middle), and the variability of the bottom third curvature is greater than the top and middle thirds. This can be explained by the fact that the adductor canal provides more muscular and membranous constraint proximal to the adductor hiatus (22). In addition, the vastoadductor membrane creates an increasingly constrained space progressing distally along the adductor canal (34). Therefore, increase in vessel curvature is greatest in the bottom third, adjacent to the greatest joint flexion (at the knee) and where there is the least constraint, and least in the middle third, not close to any joint flexion and where the adductor canal is highly constrained.
While the superficial femoral arteries remain visually smooth and relatively straight in younger subjects with hip and knee flexion, older subjects exhibit substantial curvature and buckling with flexion (Figure 6). This may indicate that younger subjects retain tension in the SFA with hip and knee flexion, while older subjects do not. This is consistent with documented variation in arterial tension with age. While body growth persistently stretches arteries through adolescence, once maximum body height is reached, the chronic tension that arteries experience should decrease in the absence of further stretching, and with the degradation of elastin in arteries with age (7, 8), older adults have longer and less elastic arteries than young adults.
Figure 6.
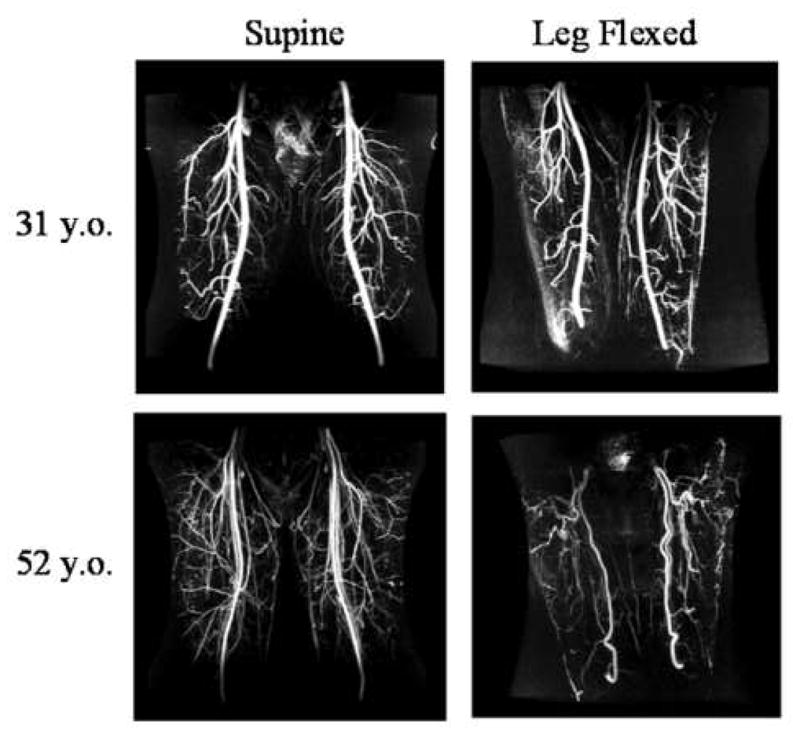
Maximum intensity projections of magnetic resonance angiograms of a young adult (top row) and older adult (bottom row) in the supine position (left column) and in the leg-flexed position (right column). Note that while the superficial femoral arteries of the young subject remained straight with leg flexion, the older adult exhibited redundancy and vessel kinking.
Comparing the SFA deformations presented in this study with those of a younger population (age: 27 ± 5 years) reported in Cheng et al. (25), some notable differences in biomechanical behavior were found. Note that there was significantly less flexion in the older population as compared to the younger population at the hip (older: 39 ± 6 °, younger: 120 ± 9°, P < 0.001) and knee (older: 86 ± 6°, younger: 134 ± 3°, P < 0.001), and that the data for the younger subjects were averaged along the entire length of the SFA rather than resolved into thirds. The variation in length change of the young population (−13 ± 11 %) was greater than that of all three sections of the older SFAs (P < 0.001). Also, there was greater variability in SFA twist in the young as compared to the older adults (young: 2.8 ± 1.7 °/cm, older: 0.7 ± 0.5 °/cm, P < 0.001). Furthermore, the older subjects exhibited greater maximum change in curvature than the young subjects in the bottom third (young: 0.04 ± 0.16 cm−1, older: 0.41 ± 0.22 cm−1, P < 0.001).
Along with visual angiographic evidence in Figure 6, the above comparisons support the postulate that aging decreases stretch and elasticity in the SFA. For example, the far lower variability in arterial shortening due to leg flexion for the older adults compared to the young adults indicates that the percentage shortening of the older SFAs is more narrowly distributed in the population. This narrow distribution may indicate that the population of older subjects all shortened their SFAs to their minimum slack length, corresponding to zero tension and strain. This hypothesis is strengthened by the fact that the older subjects had significantly lower hip and knee flexion angles as compared to the young subjects, and the minimum SFA slack lengths were reached nonetheless. Similarly, the variability in overall SFA degrees of twist per cm was significantly greater in the younger as compared to the older population. A more narrow distribution of arterial twisting angles in the older population also supports less compliant arteries. The most definitive evidence, however, is that the bottom third of the older SFAs increase their maximum curvature more dramatically than the bottom third of the younger SFAs, which indicates that the older SFAs shortened past their point of slack and then buckled off-axis, while the younger SFAs did not.
As mentioned in the Introduction, it may be beneficial to characterize the axial strain of a target vessel. While younger SFAs do not experience significant increases in curvature when flexing from supine to fetal position (25), the older SFAs curved significantly for the top, middle, and bottom thirds. Assuming that large increases in curvature indicated off-axis buckling in the older subjects (Figure 6), it can be deduced that the arteries were straight and in tension while in the supine position, and past the point of slack when the legs were flexed. Therefore, the percent shortening of the SFA from supine to flexed position is the approximate axial tensile strain that the SFA experiences in a straight leg. Analogously, in the younger subjects, since the arteries remain straight even with full fetal position flexion and the point of slack is never exceeded, we can logically deduce that the chronic axial tensile strain of the SFA in a straight leg is greater than or equal to the percent shortening quantified.
The evidence presented here shows that with hip and knee flexions approximately commensurate with walking, the distal and proximal portions of the SFA are subject to greater longitudinal and bending deformations than the middle of the SFA, with the distal SFA deforming the most. In addition, we hypothesize that there is decrease in baseline strain in femoral arteries with aging. Combined with the natural decrease in compliance of vessels with age, the relative fixed musculoskeletal geometry of the adult anatomy, and the shortening of the SFA path length with leg flexion, it follows that repetitive arterial deformations may vary qualitatively and quantitatively with age. Namely, with decreased vessel stretch and increased vessel stiffness, the SFAs of older people tend to shorten less due to reaching the point of slack, and buckle off-axis, while younger SFAs remain straight. With the presence of atherosclerotic disease, arteries tend to be even stiffer, have longer equilibrium lengths, and lower longitudinal strain, probably resulting in more exacerbated off-axis buckling with repetitive, lower extremity movements.
There were limitations to this study that warrant mention as well as future investigation. Due to variations in vascular anatomy, the arterial branches were not consistent between subjects, necessitating the use of averaging the deformation data into top, middle, and bottom thirds of the SFA. In addition, the subjects included in this study did not have lower extremity vascular disease. In the presence of disease, which could cause non-homogeneous vessel properties along the length of the SFA, the motions and deformations could be qualitatively and quantitatively different from those of these healthy subjects. Ultimately, deformation analysis should be performed pre- and post-treatment, to better evaluate how different treatments and implants may change the properties of the vessel, as well as provide insight into how to treat the artery back to a healthy biomechanical state.
The results and concepts of this study can be used to improve current device testing, development of future devices, as well as guide therapeutic strategies. The longitudinal, twisting, and bending deformations of the SFA can be used to refine computational and bench top durability tests for industry and FDA evaluation. Although flexibility is not the only factor in efficacy, benchtop and clinical experience with SFA stents have shown that greater flexibility, and greater uniformity of flexibility, are correlated to fracture resistance. For example, along the spectrum of open vs closed-cell designs, the more open the design, the greater the axial, twisting, and bending flexibility, resulting in lower fracture rate (24, 35, 36). In addition, evidence shows that longer stented regions correlate with higher stent fracture rates, especially in the presence of stiffness non-uniformities caused by stent overlap (36, 37). We can postulate that the low fracture rate of stent grafts may be due to their flexibility as well as the stiffness homogenizing effect of the graft material on the device. Not only can the results from this study extend the understanding of fracture mechanisms of SFA stents, they can also motivate the invention of next generation devices and therapies that better consider the biomechanical environment of the SFA.
Perhaps most importantly, the measurement of in vivo longitudinal strain provides mechanical tissue data that can be used to help evaluate the biomechanical health of a vessel, potentially enhancing the diagnostic process (8), as well as providing information to enable subject-specific devices and therapies. For example, implants and treatments can be designed to be more harmonious with the biomechanical environment by matching the strain state of an implant with that of the target vessel (e.g. implanting a stretched stent in the stretched vessel of a straight leg, or implanting a neutral stent in the non-strained vessel of a flexed leg). In addition, with vessel strains derived from these techniques and vessel stiffness derived from pulse propagation studies, vessel stresses and forces can be computed, creating more opportunities for anatomically-focused design.
Acknowledgments
The authors gratefully acknowledge funding support from the members of the RESIStent SRI/Stanford Consortium on Stent Fracture in the Superficial Femoral Artery (Phase II): Cordis/Nitinol Devices & Components, Boston Scientific, W.L. Gore, Medtronic Vascular, Abbott Vascular, and Bard/Angiomed. This work was also supported by NIH P41RR09784, the Lucas Center for Magnetic Resonance Imaging, and General Electric Medical Systems. The authors would also like to thank Nathan M. Wilson, Ph.D. for assistance with the imaging processing software.
APPENDIX A – Optimal Window Size for Averaging Curvature
In order to compute an average curvature value, an arc length over which to average needs to be determined first. An off-axis deflection metric was devised to estimate vessel curvature and served as a cost function to find the optimal window size of arc length. The metric was defined as the maximum ratio of off-axis distance of the vessel centerline path from the straight line , over the arc length of the vessel centerline path (Figure 7).
Figure 7.
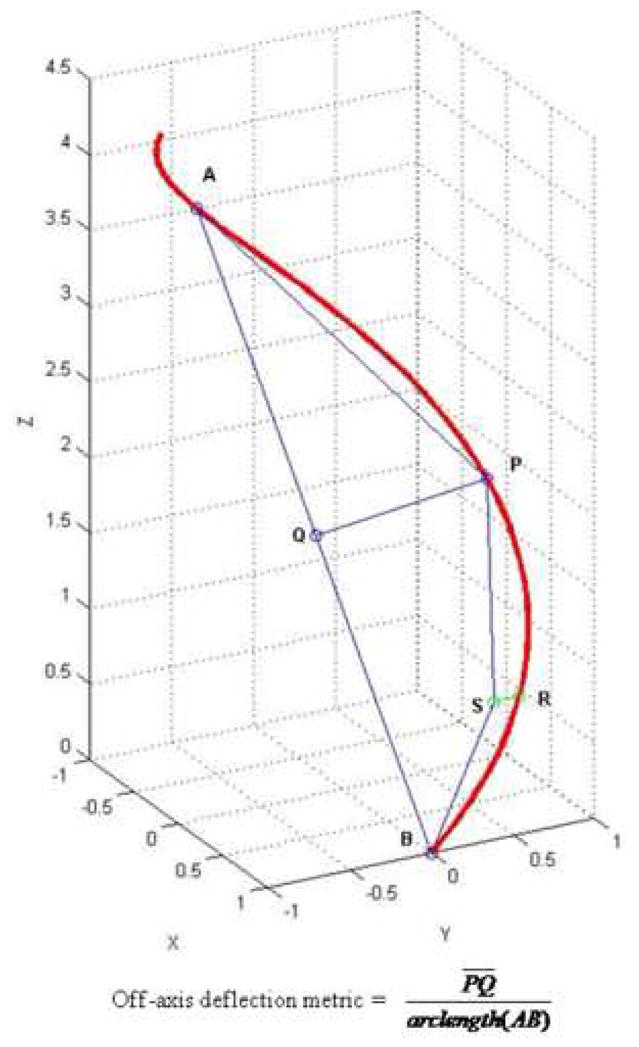
The window size was determined by a recursive algorithm such that the off-axis deflection metric was maximized along the centerline path of interest. In a formulated form, if we let f be the off-axis deflection metric cost function, we need to find the optimal moving window sizeα that maximizes f(s, s+α), where s represents any point along the path. The Matlab (Mathworks, Inc.) optimization toolbox was used to solve this formulation. This calculation provides the optimal arc length window to effectively include regions vessel bending and buckling. After finding the optimal arc length window α, average curvature was calculated along the entire path as follows:
where N is the number of discrete data points of curvature included in [ ].
Footnotes
Some of this work was presented at the 2008 SIR conference in Washington D.C.
Publisher's Disclaimer: This is a PDF file of an unedited manuscript that has been accepted for publication. As a service to our customers we are providing this early version of the manuscript. The manuscript will undergo copyediting, typesetting, and review of the resulting proof before it is published in its final citable form. Please note that during the production process errors may be discovered which could affect the content, and all legal disclaimers that apply to the journal pertain.
References
- 1.Cheng CP, Herfkens RJ, Taylor CA. Abdominal Aortic Hemodynamic Conditions in Healthy Subjects Aged 50–70 at Rest and During Lower Limb Exercise: In Vivo Quantification Using MRI. Atherosclerosis. 2003;168:323–331. doi: 10.1016/s0021-9150(03)00099-6. [DOI] [PubMed] [Google Scholar]
- 2.Berne RM, Levy MN. Cardiovascular Physiology. 7. St. Louis: Mosby-Year Book, Inc; 1997. [Google Scholar]
- 3.Zierler RE, Strandness DE. Hemodynamics for the Vascular Surgeon. In: Moore WS, editor. Vascular Surgery: A Comprehensive Review. 4. Philadelphia: W.B. Saunders Company; 1993. p. 186. [Google Scholar]
- 4.Imura T, Yamamoto K, Kanamori K, Mikami T, Yasvda H. Non-Invasive Ultrasonic Measurement of the Elastic Properties of the Human Abdominal Aorta. Cardiovascular Research. 1986;20:208. doi: 10.1093/cvr/20.3.208. [DOI] [PubMed] [Google Scholar]
- 5.Lazarus M, Dang T, Gardin JM, Allfie A, Henry WL. Evaluation of Age, Gender, Heart Rate and Blood Pressure Changes and Exercise Conditioning on Doppler Measured Aortic Blood Flow Acceleration and Velocity During Upright Treadmill Testing. The American Journal of Cardiology. 1988;62(7):439–443. doi: 10.1016/0002-9149(88)90974-5. [DOI] [PubMed] [Google Scholar]
- 6.Yu H, Peng HW, JL, Wen C, Tseng W. Quantification of the pulse wave velocity of the descending aorta using axial velocity profiles from phase-contrast magnetic resonance imaging. Magnetic Resonance in Medicine. 2006;56(4):876–883. doi: 10.1002/mrm.21034. [DOI] [PubMed] [Google Scholar]
- 7.Avolio AP, Chen SG, Wang RP, Zhang CL, Li MF, O’Rourke MF. Effects of aging on changing arterial compliance and left ventricular load in a northern Chinese urban community. Circulation. 1983;68(1):50–58. doi: 10.1161/01.cir.68.1.50. [DOI] [PubMed] [Google Scholar]
- 8.Greenwald SE. Ageing of the conduit arteries. Journal of Pathology. 2007;211:157–172. doi: 10.1002/path.2101. [DOI] [PubMed] [Google Scholar]
- 9.Zarins C, Glagov S. Pathophysiology of Human Atherosclerosis. In: Wilson SE, Veith FJ, Hobson RW II, et al., editors. Vascular Surgery. New York: McGraw-Hill Book Company; 1986. pp. 23–41. [Google Scholar]
- 10.Wang DPD, Tsao P. Mechanotransduction of endothelial oxidative stress induced by cyclic strain. Endothelium. 2001;8(4):283–291. doi: 10.3109/10623320109090806. [DOI] [PubMed] [Google Scholar]
- 11.Lyon RT, Runyon-Hass A, Davis HR, Glagov S, Zarins CK. Protection from Atherosclerotic Lesion Formation by Reduction of Artery Wall Motion. J Vasc Surg. 1987;5(1):59–67. [PubMed] [Google Scholar]
- 12.Jackson Z, Dajnowiec D, Gotlieb A, Langille B. Partial off-loading of longitudinal tension induces arterial tortuosity. Arteriosclerosis, Thrombosis, and Vascular Biology. 2005;25(5):957–962. doi: 10.1161/01.ATV.0000161277.46464.11. [DOI] [PubMed] [Google Scholar]
- 13.Benetos A, Waeber B, Izzo J, et al. Influence of age, risk factors, and cardiovascular and renal disease on arterial stiffness: clinical applications. American Journal of Hypertension. 2002;15(2):1101–1108. doi: 10.1016/s0895-7061(02)03029-7. [DOI] [PubMed] [Google Scholar]
- 14.Capek P, McLean GK, Berkowitz HD. Femoropopliteal angioplasty: factors influencing long-term success. Circulation. 1991;83(Suppl 1):I70–I80. [PubMed] [Google Scholar]
- 15.Henry M, Amor M, Ethevenot G, et al. Palmaz stent placement in iliac and femoropopliteal arteries: primary and secondary patency in 310 patients with 2–4 year follow-up. Radiology. 1995;197(1):167–174. doi: 10.1148/radiology.197.1.7568818. [DOI] [PubMed] [Google Scholar]
- 16.Gray BH, Sullivan TM, Childs M, Young JR, Olin JW. High incidence of restenosis/reocclusion of stents in the percuntaneous treatment of long-segment superficial femoral artery disease after suboptimal angioplasty. Journal of Vascular Surgery. 1997;25(1):74–83. [PubMed] [Google Scholar]
- 17.Joner M, Finn A, Farb A, et al. Pathology of drug-eluting stents in humans: delayed healing and late thrombotic risk. Journal of the American College of Cardiology. 2006;48(1):193–202. doi: 10.1016/j.jacc.2006.03.042. [DOI] [PubMed] [Google Scholar]
- 18.Caro CG, Fitz-Gerald JM, Schroter RC. Atheroma and Arterial Wall Shear: Observation, Correlation and Proposal of a Shear Dependent Mass Transfer Mechanism for Atherogenesis. Proceedings of the Royal Society of London Series B: Biological Sciences. 1971;177(46):109–159. doi: 10.1098/rspb.1971.0019. [DOI] [PubMed] [Google Scholar]
- 19.Friedman MH, Hutchins GM, Bargeron CB. Correlation Between Intimal Thickness and Fluid Shear in Human Arteries. Atherosclerosis. 1981;39:425. doi: 10.1016/0021-9150(81)90027-7. [DOI] [PubMed] [Google Scholar]
- 20.Ku D, Giddens D, Zarins C, Glagov S. Pulsatile Flow and Atherosclerosis in the Human Carotid Bifurcation: Positive Correlation Between Plaque Location and Low Oscillating Shear Stress. Arteriosclerosis. 1985;5(3):293–302. doi: 10.1161/01.atv.5.3.293. [DOI] [PubMed] [Google Scholar]
- 21.Zarins CK, Giddens DP, Bharadvaj BK, Sottiurai VS, Mabon RF, Glagov S. Carotid Bifurcation Atherosclerosis: Quantitative Correlation of Plaque Localization with Flow Velocity Profiles and Wall Shear Stress. Circulation Research. 1983;53(4):502–514. doi: 10.1161/01.res.53.4.502. [DOI] [PubMed] [Google Scholar]
- 22.Wensing P, Scholten F, Buijs P, Hartkamp M, Mali W, Hillen B. Arterial tortuosity in the femoropopliteal region during knee flexion: a magnetic resonance angiographic study. Journal of Anatomy. 1995;187(1):133–139. [PMC free article] [PubMed] [Google Scholar]
- 23.Duda SH, Pusich B, Richter G, et al. Sirolimus-eluting stents for the treatment of obstructive superficial femoral artery disease: six month results. Circulation. 2002;106(12):1505–1509. doi: 10.1161/01.cir.0000029746.10018.36. [DOI] [PubMed] [Google Scholar]
- 24.Allie DE, Hebert CJ, Walker CM. Nitinol Stent Fractures in the SFA. Endovascular Today. 2004 July/August;:22–34. [Google Scholar]
- 25.Cheng CP, Wilson NM, Hallett RL, Herfkens RJ, Taylor CA. In Vivo MR Angiographic Quantification of Axial and Twisting Deformations of the Superficial Femoral Artery Resulting from Maximum Hip and Knee Flexion. Journal Vascular and Interventional Radiology. 2006;17(6):979–987. doi: 10.1097/01.RVI.0000220367.62137.e8. [DOI] [PubMed] [Google Scholar]
- 26.Smouse HB, Nikanorov A, LaFlash D. Changes in major peripheral arteries during joint movement before and after stent placement in the cadaver model. Paper presented at: Transcatheter Cardiovascular Therapeutics; Washington, D.C. 2004. [Google Scholar]
- 27.Schulze-Bauer C, Morth C, Holzapfel G. Passive biaxial mechanical response of aged human iliac arteries. Journal of Biomechanical Engineering. 2003;125(3):395–406. doi: 10.1115/1.1574331. [DOI] [PubMed] [Google Scholar]
- 28.Daly J, Roenigk K, Butler K, et al. Response of sagittal plan gait kinematics to weight-supported treadmill training and functional neuromuscular stimulation following stroke. Journal of Rehabilitation Research and Development. 2004;41(6A):807–820. doi: 10.1682/jrrd.2003.08.0120. [DOI] [PubMed] [Google Scholar]
- 29.Draney MT, Alley MT, Tang BT, Wilson NM, Herfkens RJ, Taylor CA. Importance of 3D Nonlinear Gradient Corrections for Quantitative Analysis of 3D MR Angiographic Data. Paper presented at: International Society for Magnetic Resonance in Medicine Conference; Honolulu, Hawaii, USA. 2002. [Google Scholar]
- 30.Wilson NM, Wang KC, Dutton RW, Taylor CA. A Software Framework for Creating Patient Specific Geometric Models from Medical Imaging Data for Simulation Based Medical Planning of Vascular Surgery. Lecture Notes in Computer Science. 2001;2208:449–456. [Google Scholar]
- 31.Wang KC. Ph.D. Dissertation. Stanford: Electrical Engineering, Stanford University; 2001. Level Set Methods for Computational Prototyping with Application to Hemodynamic Modeling. [Google Scholar]
- 32.Choi G, Cheng CP, Wilson NM, Taylor CA. Methods for Quantifying Three-Dimensional Deformation of Arteries Due to Pulsatile and Nonpulsatile Forces: Implications for the Design of Stents and Stent Grafts. Annals of Biomedical Engineering. 2009;37(1):14–33. doi: 10.1007/s10439-008-9590-0. [DOI] [PubMed] [Google Scholar]
- 33.Holm S. A simple sequentially rejective multiple test procedure. Scandinavian Journal of Statistics. 1979;6:65–70. [Google Scholar]
- 34.Tubbs RS, Loukas M, Shoja MM, Apaydin N, Oakes WJ, Salter EG. Anatomy and potential clinical significance of the vastoadductor membrane. Surgical and Radiologic Anatomy. 2007;29(7):569–573. doi: 10.1007/s00276-007-0230-4. [DOI] [PubMed] [Google Scholar]
- 35.Nikanorov A, Smouse HB, Osman K, Bialas M, Shrivastava S, Schwartz LB. Fracture of self-expanding nitinol stents stressed in vitro under simulated intravascular conditions. Journal of Vascular Surgery. 2008;48(2):435–440. doi: 10.1016/j.jvs.2008.02.029. [DOI] [PubMed] [Google Scholar]
- 36.Scheinert D, Scheinert S, Sax J, et al. Prevalence and clinical impact of stent fractures after femoropopliteal stenting. Journal of the American College of Cardiology. 2005;45(2):312–315. doi: 10.1016/j.jacc.2004.11.026. [DOI] [PubMed] [Google Scholar]
- 37.Iida O, Nanto S, Uematsu M, et al. Effect of exercise on frequency of stent fracture in the superficial femoral artery. American Journal of Cardiology. 2006;98(2):272–274. doi: 10.1016/j.amjcard.2006.01.091. [DOI] [PubMed] [Google Scholar]


