

Abstract
Studies of older adults with depressive disorders indicate greater cognitive deficits and brain alterations than would be expected for their age. There is some evidence that these findings are present after a single episode of depression, but this work has been cross-sectional in nature. We investigated both cross-sectional and longitudinal associations between a history of elevated depressive symptoms (HDS), frontal lobe volumes, and cognitive performance within the context of normal age-related changes over time in the Baltimore Longitudinal Study of Aging. After controlling for age, HDS was associated with smaller total frontal gray matter volumes and with smaller regional volumes in the cingulate gyrus and orbitofrontal cortex. Men, but not women, with HDS showed deficits in auditory attention span at older ages. Results confirm previous reports that even a single episode of depression is associated with adverse outcomes in older adults but suggest that HDS does not affect longitudinal trajectories of cognitive and brain volume change.
Keywords: late-life depression, magnetic resonance imaging, aging, longitudinal studies, sex differences
Numerous cross-sectional and longitudinal studies have demonstrated age-related cognitive deficits and changes in brain structure and function (Park & Minear, 2004; Raz, 2004). Older adults with major depression, minor depression, or elevated scores on depression scales appear to have greater cognitive deficits and brain changes than would be expected for their age (Alexopoulos et al., 2000; Gualtieri & Johnson, 2008; Harvey, Reichenberg, & Bowie, 2006; Herrmann, Goodwin, & Ebmeier, 2007; Lockwood, Alexopoulos, & van Gorp, 2002). Some studies have shown that the associations of depressive syndromes with cognitive deficits and brain alterations increase at older ages and are greater in men than in women (Beekman, Kriegsman, Deeg, & van Tilburg, 1995; Fuhrer, Dufouil, & Dartigues, 2003; Lavretsky et al., 2004; Piccinelli & Wilkinson, 2000).
In the Baltimore Longitudinal Study of Aging (BLSA) cohort, we have found cross-sectional age differences and longitudinal declines in memory, executive functioning, language, and visuospatial abilities (Dotson, Resnick, & Zonderman, 2008; Driscoll et al., 2006; Lamar, Resnick, & Zonderman, 2003; Resnick, Lamar, & Driscoll, 2007). Previous findings from the neuroimaging substudy of the BLSA indicate that normal aging is associated with gray matter volume reduction in orbital and inferior frontal, cingulate, insular, inferior parietal, and mesial temporal regions, widespread white matter changes, and functional changes including decreased cerebral blood flow to frontal and temporal regions (Beason-Held, Kraut, & Resnick, 2008a, 2008b; Resnick, Pham, Kraut, Zonderman, & Davatzikos, 2003). Moreover, we found that older adults with more chronic subthreshold depressive symptoms, without a history of major depression, show greater cognitive and brain volume changes than would be expected for their age, including cross-sectional reductions in attention and executive functions, volume reduction in the cingulate gyrus and orbitofrontal cortex, and longitudinal decline in memory, general cognitive status, and left frontal white matter volume (Dotson, Davatzikos, Kraut, & Resnick, in press; Dotson et al., 2008). The associations of depressive symptoms with cognition and brain structure increased with advancing age. Additionally, BLSA studies showed a relationship between depressive symptoms and increased dementia risk in men but not women (Dal Forno et al., 2005).
These findings were consistent with investigations by other researchers. For example, baseline depressive symptoms have been found to predict longitudinal decline in global cognitive functioning and memory (Chodosh, Kado, Seeman, & Karlamangla, 2007; Panza et al., 2009; Sachs-Ericsson, Joiner, Plant, & Blazer, 2005; Wilson, Mendes De Leon, Bennett, Bienias, & Evans, 2004), and younger adults with major depression have been found to show longitudinal decline in gray matter volume in regions including the dorsomedial prefrontal and the anterior cingulate cortices (Frodl et al., 2008). Similar to results in the BLSA, a four-year longitudinal study found that older adults with major depression did not show greater declines in hippocampal volume over time compared to controls (Greenberg, Payne, MacFall, Steffens, & Krishnan, 2008). Moreover, previous studies have shown greater associations of depression with cognitive deficits, dementia risk, and brain changes in men compared to women (Dal Forno et al., 2005; Fuhrer et al., 2003; Lavretsky et al., 2004; Videbech et al., 2002).
Our previous work focused primarily on the correlates of chronic depressive symptoms; however, other researchers have shown that even a single episode of depression in late life is associated with cognitive deficits and structural abnormalities in the brain (Frodl, Meisenzahl, Zetzsche, Bottlender et al., 2002; Frodl, Meisenzahl, Zetzsche, Born et al., 2002; MacQueen et al., 2003; Yuan et al., 2007). This is an important finding because it suggests that the risk of cognitive deficits and resulting functional decline is not only greater in older adults with persistent depressive symptoms, but also in those who have experienced only one episode of depression. Whether individuals with a history of a single episode of depression experience greater cognitive and brain changes over time is unclear because previous studies comparing individuals with and without a history of depression have been cross-sectional in nature. Longitudinal studies of late-life depression have focused on individuals who were depressed at baseline, rather than including individuals with any history of depression. Moreover, previous work has been limited to few cognitive tests and brain regions.
Consequently, the purpose of the current study was to evaluate whether older adults with a history of elevated depressive symptoms (HDS), defined as a score of 16 or greater on the Center for Epidemiologic Studies Depression Scale (CES-D) (Yesavage et al., 1983), show greater cross-sectional and longitudinal changes in cognition and brain structure than those without HDS. Data were from the BLSA, but unlike our previous studies, we used a binary categorization of individuals with or without HDS rather than using a continuous measure of depressive symptom severity. This allowed us to examine whether having a single episode of elevated symptoms is associated with negative outcomes regardless of the severity of symptoms or whether the symptoms are chronic in nature. Based on our previous work and the work of others that has supported the role of the frontal lobes in the etiology of depression (Alexopoulos, 2002; Drevets, 2000; Mayberg, 2003; Tekin & Cummings, 2002), we focused our analyses on frontal regions of the brain and on attention, immediate memory, and executive functions, cognitive abilities that are associated with frontal regions. We also examined whether age or sex modified the relationship of HDS with cognition and brain volumes. We expected to find greater cross-sectional differences and longitudinal decline in cognitive abilities and brain volumes in individuals with HDS compared to those without HDS. Furthermore, based on previous findings, we predicted that greater associations would be observed in men compared to women, and with advancing age.
Methods
Participants
Data were obtained from the BLSA, a longitudinal study of community-dwelling, generally healthy older adults who volunteer for medical, psychological, and cognitive testing every one to two years (Shock et al., 1984). Exclusionary criteria at study enrollment included a history of central nervous system disease (dementia, stroke, Parkinson's disease, epilepsy, and other neurological conditions), severe cardiac disease (including myocardial infarction, coronary bypass surgery, or angioplasty), and metastatic cancer. We excluded all data for participants diagnosed with dementia or cerebrovascular disease (e.g., subarachnoid or intracerebral hemorrhage, occlusion or stenosis of the cerebral arteries) at baseline or any follow-up evaluations. Diagnoses of dementia were made at consensus diagnostic conferences based on Diagnostic and Statistical Manual of Mental Disorders, Third Edition, Revised criteria for dementia and the National Institute of Neurological and Communication Disorders-Alzheimer's Disease and Related Disorders Association criteria for Azheimer's disease (McKhann et al., 1984). A more detailed description of this process is provided elsewhere (Kawas, Gray, Brookmeyer, Fozard, & Zonderman, 2000). In addition, we excluded data for individuals not reviewed by case conference at the time of the current study but exhibiting five or more errors on the Blessed Information Memory and Concentration Scale (BIMCS) (Blessed & Wilson, 1982) at any administration. We excluded participants with a self-reported history of major psychiatric disorder other than major depression (e.g., schizophrenia, bipolar disorder). The National Institute on Aging Intramural Research Program Institutional Review Board approved this study and all subjects gave written informed consent.
Neuroimaging sample
The neuroimaging substudy of the BLSA (Resnick et al., 2000) includes a subset of BLSA volunteers, aged 55 to 85 at baseline, who underwent annual MRI scans and cognitive evaluations. The current study included data from 110 participants with two or more MRI scans and two or more depressive symptoms assessments (mean age = 69.44, SD = 7.61). The follow-up interval ranged from 0.95 to 9.35 years (mean = 6.94, SD = 2.27). Demographic characteristics for the neuroimaging sample are presented in Table 1.
Table 1.
Sample Characteristics
| Neuroimaging Sample | Total Cognitive Sample | |
|---|---|---|
| n | 110 | 890 |
| Baseline age (years)** | 69.44 (7.61) | 65.57(10.32) |
| Education (years) | 16.18 (2.73) | 16.38 (2.59) |
| Sex (N (%), Males/Females) | 65 (56%)/52 (44%) | 472 (53%)/418 (47%) |
| Handedness (N (%), Right/Non-Right)** | 113 (97%)/4 (3%) | 804 (93%)/60 (7%) |
| PMA Vocabulary score** | 42.42 (8.09) | 40.50 (8.76) |
| Race (N (%), White/Nonwhite)* | 102 (87%)/15 (13%) | 753 (85%)/137 (15%) |
| Follow-up interval (years)** | 6.94 (2.27) | 6.07 (2.31) |
| No. of repeats** | 7.34 (2.29) | 4.34 (2.05) |
| No. with self-reported depression history | 11 | 142 |
Note: The sample size varied for each cognitive test. n = 614 for the California Verbal Learning Test, 452 for the Trail Making Test, 641 for Digit Span, and 452 for Letter Fluency. Participants in the neuroimaging sample were older, had higher PMA Vocabulary scores, were followed for a longer interval, and had more repeat visits. The neuroimaging sample had a higher proportion of right-handed and White participants.
indicates significance at p <.05
indicates significance at p <.01
Cognitive sample
Cognitive data were obtained from 890 BLSA participants who had two or more cognitive and depressive symptoms assessments. Visits were excluded if the Primary Mental Abilities Vocabulary score or any demographic variable that served as a covariate was missing. Participants were aged 50 years or older at baseline (mean = 65.57, SD = 10.32) and had on average 16.38 years of education (SD = 2.59). The follow-up interval ranged from 1.01 to 10.56 years (mean = 6.07, SD = 2.31). Cognitive tests in the BLSA are administered on a time- and age-based schedule, and participant characteristics vary for each test. Participant characteristics for the entire cognitive sample are presented in Table 1.
As would be expected based on the selection criteria and frequency of visits for the neuroimaging substudy, compared to the cognitive sample, participants in the neuroimaging sample were older, were followed for a longer interval, and had more repeat visits (all p's < 001). Participants in the neuroimaging sample also had higher PMA Vocabulary scores (p <.01).
Depressive Symptomatology
Depressive symptoms were measured with the CES-D. This 20-item inventory, which assesses the frequency and severity of depressive symptoms experienced in the past week, is widely used in epidemiological and longitudinal studies and has been validated in older community-dwelling adults (Beekman et al., 1997; Haringsma, Engels, Beekman, & Spinhoven, 2004). The CES-D was administered at each visit. Participants were considered to have a history of elevated depressive symptoms (HDS) if their CES-D was ≥16 at any visit. This cutoff of 16 is a well-accepted, standard cutoff for identification of clinically significant depressive symptoms (Radloff, 1977). One hundred and eight-five (20.79%) of the participants in the cognitive sample and 31 (28.18%) of the neuroimaging participants had at least one elevated CES-D score. Information about the CES-D in this sample is provided in Table 2. Due to the greater number of repeat visits in the neuroimaging sample, the number of available CES-D scores was greater in this sample compared to the cognitive sample (p <.001).
Table 2.
Characteristics of the CES-D in the Study Sample.
| Neuroimaging Sample | Cognitive Sample | |
|---|---|---|
| No. of CES-D measurements** | 6.59 (2.13) | 3.94 (1.83) |
| Average CES-D | 5.79 (6.39) | 5.86 (6.13) |
| Range of CES-D scores | 0-35 | 0-42 |
| Frequency of CES-D scores ≥16** | ||
| 0 | 79 (71.82%) | 705 (79.21%) |
| 1 | 17 (15.45%) | 137 (15.39%) |
| 2 | 8 (7.27%) | 37 (4.16%) |
| 3 | 1 (.91%) | 5 (.56%) |
| 4 | 1 (.91%) | 3 (.34%) |
| 5 | 3 (2.73%) | 1 (.11%) |
| 6 | 1 (.91%) | 2 (.22%) |
Note. CES-D = Center for Epidemiologic Studies Depression Scale.
indicates significance at p <.01
Neuropsychological Assessment
Analysis of neuropsychological test data focused on frontal functions. The maximum number of digits forward (Max-F) and backward (Max-B) from the digit span subtest of the Wechsler Adult Intelligence Scale–Revised (WAIS-R) (Wechsler, 1981) served as measures of attention, immediate memory, and working memory. The Trail Making Test (Reitan, 1992) parts A (TMT-A) and B (TMT-B) assessed attention and cognitive control. The TMT score was time to completion in seconds, thus, higher scores indicate poorer performance. Letter fluency (FAS) (Benton, 1968) served as a measure of executive retrieval. The California Verbal Learning Test (CVLT) (Delis, Kramer, Kaplan, & Ober, 1987) assessed acquisition (i.e., total free recall summed across trials 1 through 5 of list A: CVLT-A) and long-term retrieval (i.e., long-delay free recall: LDFR) of verbal information. Data for TMT and FAS include participants age 60 and older, while digit span and CVLT data include participants age 50 and older.
Image Acquisition
MRI acquisition procedures for the BLSA neuroimaging study are detailed elsewhere (Resnick et al., 2000). MRI scanning was performed on a GE Signa 1.5 Tesla scanner (Milwaukee, WI). A high-resolution volumetric spoiled gradient refocused (SPGR) series was used (axial acquisition; repetition time = 35; echo time = 5; flip angle = 45°; field of view = 24; matrix = 256 × 256; number of excitations = 1; voxel dimensions of 0.94 × 0.94 × 1.5 mm slice thickness).
Image Analysis
Image processing was based on a semi-automated approach with demonstrated validity and high reliability (Goldszal et al., 1998; Resnick et al., 2003). First, images were reformatted parallel to the intercommissural plane. Using a semi-automated procedure, an experienced technician removed extracranial tissue, the cerebellum, and brainstem structures inferior to the mammillary bodies. Images were segmented into white matter, gray matter, and cerebrospinal fluid (CSF). Regional volumetric measurements of specific regions of interest were subsequently obtained via an automated computer-based template warping method (Shen & Davatzikos, 2002). This technique uses a digital atlas labeled for brain lobes and individual structures, including cingulate gyrus and orbitofrontal cortex. Atlas definitions are transferred to each MRI scan via an image warping algorithm performing pattern matching of anatomically corresponding brain regions. The volumes of gray matter, white matter, and CSF of each labeled brain region were obtained by summing the number of voxels falling within each region. Intracranial volume (ICV) was determined using the template warping algorithm modified for head image registration. First, the ICV in the template is manually and carefully delineated by an expert. Then, the template with its ICV mask is warped to the space of each individual head. Finally, the warped ICV mask of template is used to directly extract the ICV of the individual.
Statistical Analyses
Data were analyzed using linear mixed models in SAS 9.1 (SAS Institute, Cary, NC), which estimate the unique effects of predictors, including both fixed and random effects, adjusting for all other terms in the analysis. Mixed-effects models are the preferred method of examining data comprising repeated outcome measurements obtained at non-uniform intervals, because they account for correlations among repeated measurements on the same participant and are unaffected by unequal numbers of assessments among individuals (Gueorguieva & Krystal, 2004). The models used an unstructured correlation matrix, which allowed every element in the matrix to be freely estimated from the data
Primary analyses
Cognitive test scores and regional brain volumes (frontal gray matter, frontal white matter, cingulate gyrus, and orbitofrontal cortex) were dependent variables in the primary analyses. All models included HDS, baseline age, time interval, and interval2 as independent variables. Time interval represents years since baseline testing for each administration of the dependent measure and indexes longitudinal age change, while baseline age indexes cross-sectional age differences. Interval2 was entered to model potential nonlinear changes over time in cognitive function and brain volumes. All two-way interactions, as well as three-way interactions of interest, were initially entered into the models. All independent variables and their interactions were included as fixed effects. Interval and intercept were included as random effects in order to account for the between- and within-subject variability in interval (i.e., time since baseline) and between-subject variability in the baseline value of the dependent variable in each analysis. A backward elimination procedure was employed in which all lower order terms remained in the model while nonsignificant interaction terms (p > 0.05, two-tailed) were eliminated from the model in stages until a final solution was reached. Analysis of brain volume measures were adjusted for total intracranial volume and sex; cognitive models were adjusted for sex, self-reported race, education, and scores on the Primary Mental Abilities vocabulary test (PMA) (DeFries et al., 1974). A self-reported history of major depression, antidepressant use and the presence of diabetes, hypertension, and heart disease were initially entered as covariates but were subsequently removed from the models because they were nonsignificant predictors in all analyses. HDS (0 = negative history, 1= positive history), sex (0 = women, 1 = men), and race (0 = white, 1 = nonwhite) were treated as categorical variables, and all other variables were treated as continuous variables.
To examine possible laterality effects, significant HDS associations with brain volumes were followed by analysis of left and right regional volumes. Left and right cingulate gyrus volumes were not analyzed separately because preliminary examination of test-retest correlations indicated reduced stability for lateralized measures of this structure.
Secondary analyses
Although frontal regional volumes were of primary interest in this study, we performed secondary analyses to examine associations between HDS and total gray matter, total white matter, and ventricular volumes. Mixed models were used and included identical predictor variables and covariates as the primary analyses.
Results
Age, Brain Volumes, and Cognition
As expected, we observed both cross-sectional and longitudinal age differences in brain volumes and cognitive performance. Analysis of brain volume data revealed cross-sectional age effects, reflecting smaller volumes at older ages, for frontal white matter and the cingulate gyrus (Table 3). Significant interval effects, reflecting longitudinal decline, were observed for all regions, and an interval2 effect for frontal gray matter and the orbitofrontal cortex revealed accelerating longitudinal decline during the follow-up period.
Table 3.
Regression Coefficients (B), standard error (SE), and degrees of freedom (df) in the Final Models for Mixed Effects Regression Analyses of Regional Brain Volumes
| Frontal Gray Matter | Frontal White Matter | Cingulate Gyrus | Orbitofrontal Gyrus | |||||
|---|---|---|---|---|---|---|---|---|
| B | SE (df) | B | SE (df) | B | SE (df) | B | SE (df) | |
| Baseline Age | −72.118 | 123.860 (04) | −870.530** | 179.150 (105) | −68.268* | 32.107 (104) | 7.816 | 26.381 (104) |
| Interval | −702.03** | 174.380 (695) | −1898.580** | 93.436 (696) | −225.650** | 17.164 (696) | −205.220** | 37.685 (694) |
| Interval2 | −42.366* | 20.325 (695) | -- | -- | -- | -- | 14.371** | 4.323 (694) |
| HDS | 48388** | 17730 (104) | 4860.270 | 2930.370 (105) | 16395** | 4535.740 (104) | 9481.750* | 3776.590 (104) |
| Baseline Age × HDS | −697.450** | 251.640 (104) | -- | -- | −237.530** | 64.430 (104) | −134.090* | 53.560 (104) |
Note: HDS: History of Center for Epidemiologic Studies Depression Scale score of ≥16. Intracranial volume and sex were entered as covariates in all analyses. Intracranial volume was significant in all models (all ps <.0001). Sex effects (smaller volumes in men) were significant for frontal white matter (p <.05) and cingulate gyrus (p <.05) volumes. Follow-up analyses showed that frontal gray matter and orbitofrontal gyrus effects were lateralized to the left hemisphere (p <.05).
indicates variables that were dropped from the model by backward elimination.
indicates significance at p <.05.
indicates significance at p <.01.
Cross-sectional age differences were observed for all of the cognitive measures FAS (Table 4). Because higher scores on TMT-A and TMT-B indicate a longer completion time and thus poorer performance, the regression coefficients for baseline age for these effects are in the opposite direction of other tests. All cognitive measures except for Max-F showed declines over time, and decline accelerated during the follow-up period for CVLT-A, LDFR, and TMT-A. CVLT-A, TMT-A, TMT-B, and Max-B showed significant baseline age × interval effects in which younger age at baseline was associated with stable or slightly improved performance over time while older baseline age was associated with longitudinal cognitive decline. This effect suggests that younger individuals experienced a practice effect, but practice effects were overwhelmed by cognitive deterioration in older individuals.
Table 4.
Regression Coefficients (df) in the Final Models for Mixed Effects Regression Analyses of Cognitive Test Scores
| CVLT-A | LDFR | TMT-A | TMT-B | Max Forward | Max Backwards | Letter Fluency | ||||||||
|---|---|---|---|---|---|---|---|---|---|---|---|---|---|---|
| B | SE (df) | B | SE (df) | B | SE (df) | B | SE (df) | B | SE (df) | B | SE (df) | B | SE (df) | |
| Baseline Age | −0.382** | 0.032 (601) | −0.110** | 0.010 (601) | 0.762** | 0.094 (438) | 1.595** | 0.202 (439) | −0.018** | 0.006 (623) | −0.011* | 0.005 (626) | −0.044* | 0.022 (439) |
| HDS | −0.439 | 0.821 (601) | −0.068 | 0.263 (601) | 0.872 | 1.163 (438) | 4.618 | 3.576 (439) | −1.048 | 0.728 (623) | 0.029 | 0.095 (626) | 0.164 | 0.404 (439) |
| Interval | 1.239* | 0.483 (1650) | 0.389** | 0.128 (1650) | −2.931** | 0.827 (1624) | −7.282** | 2.449 (1590) | −0.008 | 0.007 (1707) | −0.017* | 0.007 (1705) | −0.036* | .018 (1635) |
| Interval2 | −0.051** | 0.019 (1650) | −0.016** | 0.006 (1650) | 0.079** | 0.027 (1624) | -- | -- | -- | -- | -- | -- | -- | -- |
| Baseline Age × Interval | −0.019** | 0.007 (1650) | −0.005** | 0.002 (1650) | 0.037** | 0.011 (1428) | 0.125** | 0.035 (1590) | -- | -- | -- | -- | -- | -- |
| Sex × Baseline Age | -- | -- | -- | -- | −0.252* | 0.121 (438) | -- | -- | −0.006 | 0.008 (623) | −0.017* | 0.007 (626) | -- | -- |
| Baseline Age × HDS | -- | -- | -- | -- | -- | -- | -- | -- | 0.018 | 0.012 (623) | -- | -- | -- | -- |
| Sex × HDS | -- | -- | -- | -- | -- | -- | -- | -- | 2.403* | 1.212 (623) | -- | -- | -- | -- |
| Sex × Baseline Age × HDS | -- | -- | -- | -- | -- | -- | -- | -- | −0.036* | 0.018 (623) | -- | -- | -- | -- |
Note: HDS: History of Center for Epidemiologic Studies Depression Scale score of ≥16; CVLT-A: California Verbal Learning Test Total Correct List A; LDFR: Long Delay Free Recall; TMT: Trail Making Test; Max Forward: maximum digits forward; Max Backwards: maximum digits backward. Primary Mental Abilities Vocabulary (PMA) scores, sex, education, and race were entered as covariates in all analyses. PMA Vocabulary scores were significant in all models (all ps <.0001). Sex effects (worse performance in women) were significant for TMT-A and Max-B (ps <.01). Education was inversely correlated with scores on TMT-B (p <.05). Race (lower scores in non-whites) effects were significant for all measures (all ps <.05). The regression coefficient for baseline age in the TMT-A and TMT-B analyses were in the opposite direction of all other tests because higher scores on these measures indicate poorer performance.
indicates variables that were dropped from the model by backward elimination.
indicates significance at p <.05.
indicates significance at p <.01.
Brain Volumes and a History of Elevated Depressive Symptoms
HDS was significantly associated with smaller volumes in frontal gray matter [F(1, 104) = 7.68, p = .007], the cingulate gyrus [F(1, 104) = 13.59, p = .0004], and the orbitofrontal cortex [F(1, 104) = 6.26, p = .014], at older, but not younger, baseline ages (Table 3 and Figure 1). Follow-up analyses revealed that the frontal gray matter effect was significant in both the left and right hemispheres [F(1, 104) ≥ 5.05, p < .05], while the orbitofrontal effect was significant in the left, but not the right, hemisphere F(1, 104) = 7.12, p = .009]. HDS was not associated with longitudinal volume reductions, and sex did not affect the relationships between HDS and brain volumes.
Figure 1.
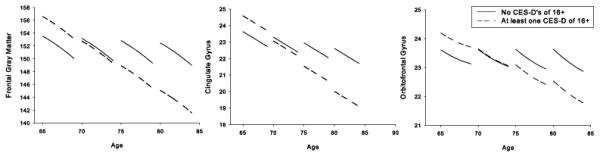
Relationship between a history of elevated depressive symptoms (HDS) and brain volumes for those regions that showed significant HDS effects. Values represent estimated scores computed from parameter estimates of the individual mixed-effects regression equations including all main effects and significant interactions. Estimated scores were calculated as the intercept plus the sum of each predictor variable multiplied by its regression coefficient. Z-scores are based on the sample mean and standard deviation and are used only for visual display. Mean regional volumes of individuals with no history of Center for Epidemiologic Studies Depression Scale (CES-D) scores of 16 or greater are represented by solid bars. Mean regional volumes of individuals with at least one CES-D score of 16 or greater are represented by striped bars.
Secondary analyses
HDS was also associated with global brain volume changes. Results of secondary analyses indicated a significant association between HDS and total gray matter volumes [F(1, 104) = 17.41, p < .001] at older ages. HDS was not associated with total white matter or ventricular volumes.
Cognition and a History of Elevated Depressive Symptoms
Associations between HDS and cognition were limited to Max-F (Table 4 and Figure 2). An HDS × sex × baseline age effect [F(1, 623) = 4.05, p = .045] was observed for this measure, reflecting a tendency for men, but not women, to show performance decrements at older ages as a function of HDS. Longitudinal associations with HDS were not observed for any of the cognitive measures.
Figure 2.
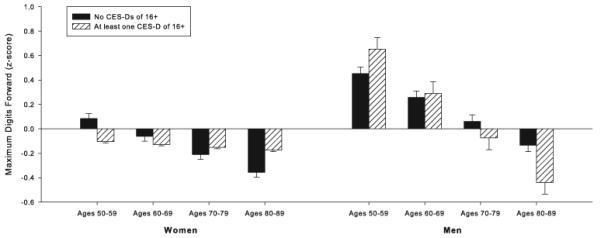
Relationship between a history of elevated depressive symptoms (HDS), sex, and maximum digit span forward, the sole cognitive measure that was associated with HDS. Values represent estimated scores computed from parameter estimates of the individual mixed-effects regression equation including all main effects and significant interactions. Estimated scores were calculated as the intercept plus the sum of each predictor variable multiplied by its regression coefficient. Z-scores are based on the sample mean and standard deviation and are used only for visual display. Mean scores of individuals with no history of Center for Epidemiologic Studies Depression Scale (CES-D) scores of 16 or greater are represented by solid bars. Mean scores of individuals with at least one CES-D score of 16 or greater are represented by striped bars.
Discussion
The aim of this longitudinal study was to examine regional brain volumes and cognitive performance in dementia-free older adults with and without a history of significant depressive symptoms. Given the prominence of the frontal lobes in theories of the pathophysiology of depression, we focused on frontal regions of the brain and on cognitive functions that are mediated by the frontal lobes. As expected, age was associated with volume reduction in frontal brain regions, attention and executive deficits, and longitudinal cognitive and brain volume decline. Consistent with our hypotheses, many of these associations were exacerbated by HDS.
HDS and Regional Brain Volumes
Individuals with HDS had smaller frontal volumes, including total gray matter, cingulate gyrus, and orbitofrontal cortex volumes, compared to those without HDS. Follow-up analyses revealed that the effect was lateralized to the left hemisphere for orbitofrontal volumes. These results are consistent with previous studies which documented structural abnormalities in the frontal lobes of older adults with major (Ballmaier et al., 2004; Drevets et al., 1997; Lai, Payne, Byrum, Steffens, & Krishnan, 2000) or minor (Kumar, Jin, Bilker, Udupa, & Gottlieb, 1998; Kumar et al., 1997; Taki et al., 2005) depression. Indeed, frontal structures are prominent in the prevailing theories of the etiology of depressive disorders (Alexopoulos, 2002; Drevets, 2000; Mayberg, 2003; Tekin & Cummings, 2002). Converging evidence from structural and functional MRI (Ballmaier et al., 2004; Drevets et al., 1997; Lai et al., 2000; Yuan et al., 2008), positron emission tomography (Alexopoulos, 2002; Bremner, Vythilingam, Vermetten, Vaccarino, & Charney, 2004; de Asis et al., 2001; Mayberg, 2003), electrophysiology (Pizzagalli, Peccoralo, Davidson, & Cohen, 2006; Tucker, Luu, Frishkoff, Quiring, & Poulsen, 2003), and neuropathology (Ongur, Drevets, & Price, 1998; Rajkowska et al., 1999) studies implicate the frontal lobes in mood disorders. In many of these studies, findings have been lateralized to the left hemisphere (Bench et al., 1992; Botteron, Raichle, Drevets, Heath, & Todd, 2002; Dolan et al., 1992; Drevets et al., 1997), consistent with some of the present results. Our results add to this literature by demonstrating associations between HDS and frontal volumes within the context of longitudinal age-related volume decline over a period of up to 9 years.
Secondary analyses revealed that individuals with HDS had smaller total gray matter volumes compared to those without HDS. Depression-related differences in global measures of brain atrophy have been reported in some previous studies in older adults (Alexopoulos, Young, & Shindledecker, 1992; Beats, Sahakian, & Levy, 1996; Pantel et al., 1997), but not in others (Bremner et al., 2002; Kumar et al., 1998). In the current study, the number of assessments (780 total scans) increased our ability to detect differences in global brain volumes. Moreover, after 8-year follow-up, our sample included participants up to the age of 93. As discussed below, depressive symptoms may have greater associations with structural abnormalities in the brain with advancing age.
HDS and Cognition
Compared to those without HDS, men with HDS had a smaller auditory attention capacity reflected in a lower maximum span on digit span forward. This effect was not observed in women. Previous studies have shown sex differences in the associations of depressive syndromes with cognitive decline, dementia, and brain structure and function (Dal Forno et al., 2005; Fuhrer et al., 2003; Lavretsky et al., 2004; Videbech et al., 2002). Generally, sex differences reflect greater associations in depressed men than in women (Beekman et al., 1995; Piccinelli & Wilkinson, 2000). In our study, HDS was differentially associated with cognitive functioning, but not brain volumes, in men compared to women. The lack of correspondence between frontal volumes and auditory attention results may be attributed to our examination of total frontal lobe volume, rather than analysis of regions of the frontal lobe such as the dorsolateral prefrontal cortex, which have been linked to digit span performance (Gerton et al., 2004). There is evidence that the clinical presentation of depression differs in men and women (Beekman et al., 1995; Ernst & Angst, 1992) and that different symptom dimensions of depression (e.g., somatic vs. mood symptoms) have distinct relationships with cognitive and brain changes (Baune, Suslow, Arolt, & Berger, 2007; Bench, Friston, Brown, Frackowiak, & Dolan, 1993; Dunn et al., 2002; Milak et al., 2005). This suggests that sex differences in the cognitive and neuroanatomical correlates of depression may be linked to varying severity of particular symptom dimensions in men and women. Such examination is beyond the scope of the current paper but is of interest for future studies.
In the current study, HDS was not associated with measures of frontal functions other than auditory attention span. This finding is in contrast to previous work of ours and of others (Alexopoulos, 2002; Baune, Suslow, Engelien, Arolt, & Berger, 2006; Butters et al., 2004; Dotson et al., 2008; Lesser et al., 1996; Ravdin, Katzen, Agrawal, & Relkin, 2003) that has demonstrated depression- and depressive symptom-related deficits on a variety of tasks that place demands on executive processes. For example, both major and minor depression in older adults has been associated with impaired performance on executive tests including TMT-B (Baune et al., 2006; Butters et al., 2004). Moreover, depressive symptoms in older adults have been associated with poorer performance on letter fluency (Ravdin et al., 2003). We have also previously found that higher concurrent depressive symptoms are associated with poor performance on TMT-B and letter fluency (Dotson et al., 2008). Furthermore, chronic depressive symptoms were associated with deficits on TMT-A and TMT-B and with longitudinal decline on CVLT-A, LDFR, and digits forward. Power analyses revealed sufficient power to detect even a small effect size in our cross-sectional and longitudinal analyses of both cognitive and volume data, thus, the absence of effects for more cognitive measures is not attributable to sample size. Rather, the disparate results in the present study may be due to differences in the measurement of depressive symptoms. In contrast to the current categorization of participants into two groups (with or without HDS), our previous study used continuous measures of depressive symptom severity, which may have been more sensitive in detecting associations between cognitive performance and depressive symptoms. Moreover, unlike previous studies, the current study did not consider depressive symptoms at the time of cognitive performance or the chronicity of symptoms. Perhaps executive functions are affected by depressive symptoms only if the symptoms are chronic or are present at the time of cognitive assessment. Since underlying neuropathology appears to mediate the cognitive deficits observed in depressed individuals, the finding that poor digit span performance was associated with HDS suggests that the cortical network that underlies performance on this task may be more vulnerable to single episodes of elevated depressive symptoms than are other regions of the brain. Previous research suggests that this network may include regions within the dorsolateral prefrontal cortex, inferior parietal lobule, and insula (Gerton et al., 2004).
Age by HDS Interactions
Associations of HDS with frontal volumes and auditory attention capacity increased as a function of age, confirming previous findings of an additive or interactive effect of age and depression on cognitive and brain changes (de Asis et al., 2001; Dotson et al., 2008; Konarski et al., 2007; Lockwood et al., 2002). These observations are not surprising considering the overlap between the cognitive and neuroanatomical correlates in normal aging and in depression. Aging and depression are independently associated with deficits in executive functions, memory, and processing speed (Castaneda, Tuulio-Henriksson, Marttunen, Suvisaari, & Lonnqvist, 2008; Park & Minear, 2004), structural and functional changes in a network of brain regions that includes frontal, temporal, and striatal regions (Drevets, 2000; Mayberg, 2003; Raz, 2004), and neurotransmitter changes (Goldman-Rakic & Brown, 1981; Nutt et al., 2006).
Although depression-related cognitive and brain changes have been reported in both young and older adults, differences are most consistently seen in older adults. Thus, it would appear that depressive symptoms have more of an adverse impact in older adults, possibly because they are already vulnerable to age-related cognitive and neurobiological disturbances. Additionally, this pattern of results may be partially attributed to the inclusion of individuals with late-onset depression in studies of geriatric depression. Within elderly samples, late-onset depression has been linked to greater cognitive deficits and alterations in the brain compared to early-onset depression (Rapp et al., 2005; Salloway et al., 1996). Thus, the underlying pathophysiology and the sequelae of depression may differ as a function of the age at which the symptoms are experienced as well as the age of onset of symptoms.
Study limitations include the lack of availability of detailed information regarding psychiatric history, including verified information regarding past and current diagnoses of mood disorders and age of onset of depressive symptoms, which would have provided the opportunity for us to address this issue. Detailed psychiatric history would also clarify whether the episodes of elevated depressive symptoms corresponded with a confirmed diagnosis of major depressive episode rather than more transient symptoms. An additional limitation of the study is the lack of representativeness of the BLSA sample, which comprises primarily well-educated, White participants. However, this limitation also confers an advantage, because the homogenous nature of the sample minimizes the effect of demographic factors on our results. These limitations are outweighed by the strengths of this study, including the relatively large sample sizes and follow-up periods, which allowed a unique opportunity to examine a well-characterized group of older adults over time. Additionally, in contrast to many studies of late-life depression, we were able to prospectively diagnose individuals with dementia and exclude them from our analyses, increasing our confidence that our results are attributable to HDS rather than incipient dementia. Moreover, the longitudinal nature of the study allowed us to not only exclude individuals with cerebrovascular disease at baseline but also those who developed cerebrovascular conditions during the study interval. As a result, we were able to minimize the possibility that cerebrovascular disease mediated our results.
Taken together, our findings confirm previous reports that even a single episode of depression or elevated depressive symptoms is associated with adverse outcomes in older adults. Moreover, results extend previous findings by suggesting that a history of elevated depressive symptoms is associated with primarily cross-sectional differences rather than longitudinal changes over time. Differences in brain volumes as a function of HDS do not appear to differ for men and women, while only men with HDS showed deficits in attention compared to those without HDS. Finally, this study confirms previous reports that age and depressive symptoms may have an additive effect on cognitive abilities and brain integrity. These results have implications for the management and treatment of depressive disorders and cognitive decline in older adults. Given the interrelationships between depressive disorders, brain changes, and cognitive impairment in older adults, results suggest that intervention for depressive symptoms is important even in individuals whose symptoms are not recurrent. Because depression is a treatable risk factor for cognitive decline, management of depressive symptoms may delay the onset of cognitive impairment in older adults.
Our future work will further explore age and sex differences in the correlates of depression by examining the relationships between clinical dimensions of depression and changes in cognitive functioning, brain structure, and blood flow over time in older men and women. We will also investigate the temporal relationship between depressive symptoms, cognitive deficits, and neurobiological changes to clarify whether depressive symptoms are etiological contributors to or sequelae of cognitive and brain changes, or if some common underlying pathophysiology predisposes older adults to depression, cognitive changes, and brain changes.
Acknowledgment
This research was supported in part by the Intramural Research Program of the NIH, National Institute on Aging.
Footnotes
The authors have no potential conflicts of interest to be disclosed.
References
- Alexopoulos GS. Frontostriatal and limbic dysfunction in late-life depression. Am J Geriatr Psychiatry. 2002;10(6):687–695. [PubMed] [Google Scholar]
- Alexopoulos GS, Meyers BS, Young RC, Kalayam B, Kakuma T, Gabrielle M, et al. Executive dysfunction and long-term outcomes of geriatric depression. Arch Gen Psychiatry. 2000;57(3):285–290. doi: 10.1001/archpsyc.57.3.285. [DOI] [PubMed] [Google Scholar]
- Alexopoulos GS, Young RC, Shindledecker RD. Brain computed tomography findings in geriatric depression and primary degenerative dementia. Biol Psychiatry. 1992;31(6):591–599. doi: 10.1016/0006-3223(92)90245-u. [DOI] [PubMed] [Google Scholar]
- Ballmaier M, Toga AW, Blanton RE, Sowell ER, Lavretsky H, Peterson J, et al. Anterior cingulate, gyrus rectus, and orbitofrontal abnormalities in elderly depressed patients: an MRI-based parcellation of the prefrontal cortex. Am J Psychiatry. 2004;161(1):99–108. doi: 10.1176/appi.ajp.161.1.99. [DOI] [PubMed] [Google Scholar]
- Baune BT, Suslow T, Arolt V, Berger K. The relationship between psychological dimensions of depressive symptoms and cognitive functioning in the elderly - the MEMO-Study. J Psychiatr Res. 2007;41(34):247–254. doi: 10.1016/j.jpsychires.2006.06.004. [DOI] [PubMed] [Google Scholar]
- Baune BT, Suslow T, Engelien A, Arolt V, Berger K. The association between depressive mood and cognitive performance in an elderly general population - the MEMO Study. Dement Geriatr Cogn Disord. 2006;22(2):142–149. doi: 10.1159/000093745. [DOI] [PubMed] [Google Scholar]
- Beason-Held LL, Kraut MA, Resnick SM. I. Longitudinal changes in aging brain function. Neurobiol Aging. 2008a;29(4):483–496. doi: 10.1016/j.neurobiolaging.2006.10.031. [DOI] [PMC free article] [PubMed] [Google Scholar]
- Beason-Held LL, Kraut MA, Resnick SM. II. Temporal patterns of longitudinal change in aging brain function. Neurobiol Aging. 2008b;29(4):497–513. doi: 10.1016/j.neurobiolaging.2006.11.011. [DOI] [PMC free article] [PubMed] [Google Scholar]
- Beats BC, Sahakian BJ, Levy R. Cognitive performance in tests sensitive to frontal lobe dysfunction in the elderly depressed. Psychol Med. 1996;26(3):591–603. doi: 10.1017/s0033291700035662. [DOI] [PubMed] [Google Scholar]
- Beekman AT, Deeg DJ, Van Limbeek J, Braam AW, De Vries MZ, Van Tilburg W. Criterion validity of the Center for Epidemiologic Studies Depression scale (CES-D): results from a community-based sample of older subjects in The Netherlands. Psychol Med. 1997;27(1):231–235. doi: 10.1017/s0033291796003510. [DOI] [PubMed] [Google Scholar]
- Beekman AT, Kriegsman DM, Deeg DJ, van Tilburg W. The association of physical health and depressive symptoms in the older population: age and sex differences. Soc Psychiatry Psychiatr Epidemiol. 1995;30(1):32–38. doi: 10.1007/BF00784432. [DOI] [PubMed] [Google Scholar]
- Bench CJ, Friston KJ, Brown RG, Frackowiak RS, Dolan RJ. Regional cerebral blood flow in depression measured by positron emission tomography: the relationship with clinical dimensions. Psychol Med. 1993;23(3):579–590. doi: 10.1017/s0033291700025368. [DOI] [PubMed] [Google Scholar]
- Bench CJ, Friston KJ, Brown RG, Scott LC, Frackowiak RS, Dolan RJ. The anatomy of melancholia--focal abnormalities of cerebral blood flow in major depression. Psychol Med. 1992;22(3):607–615. doi: 10.1017/s003329170003806x. [DOI] [PubMed] [Google Scholar]
- Benton AL. Differential behavioral effects in frontal lobe disease. Neuropsychologia. 1968;6(1):53–60. [Google Scholar]
- Blessed G, Wilson ID. The contemporary natural history of mental disorder in old age. Br J Psychiatry. 1982;141:59–67. doi: 10.1192/bjp.141.1.59. [DOI] [PubMed] [Google Scholar]
- Botteron KN, Raichle ME, Drevets WC, Heath AC, Todd RD. Volumetric reduction in left subgenual prefrontal cortex in early onset depression. Biol Psychiatry. 2002;51(4):342–344. doi: 10.1016/s0006-3223(01)01280-x. [DOI] [PubMed] [Google Scholar]
- Bremner JD, Vythilingam M, Vermetten E, Nazeer A, Adil J, Khan S, et al. Reduced volume of orbitofrontal cortex in major depression. Biol Psychiatry. 2002;51(4):273–279. doi: 10.1016/s0006-3223(01)01336-1. [DOI] [PubMed] [Google Scholar]
- Bremner JD, Vythilingam M, Vermetten E, Vaccarino V, Charney DS. Deficits in hippocampal and anterior cingulate functioning during verbal declarative memory encoding in midlife major depression. Am J Psychiatry. 2004;161(4):637–645. doi: 10.1176/appi.ajp.161.4.637. [DOI] [PubMed] [Google Scholar]
- Butters MA, Whyte EM, Nebes RD, Begley AE, Dew MA, Mulsant BH, et al. The nature and determinants of neuropsychological functioning in late-life depression. Arch Gen Psychiatry. 2004;61(6):587–595. doi: 10.1001/archpsyc.61.6.587. [DOI] [PubMed] [Google Scholar]
- Castaneda AE, Tuulio-Henriksson A, Marttunen M, Suvisaari J, Lonnqvist J. A review on cognitive impairments in depressive and anxiety disorders with a focus on young adults. J Affect Disord. 2008;106(12):1–27. doi: 10.1016/j.jad.2007.06.006. [DOI] [PubMed] [Google Scholar]
- Chodosh J, Kado DM, Seeman TE, Karlamangla AS. Depressive symptoms as a predictor of cognitive decline: MacArthur Studies of Successful Aging. Am J Geriatr Psychiatry. 2007;15(5):406–415. doi: 10.1097/01.JGP.0b013e31802c0c63. [DOI] [PubMed] [Google Scholar]
- Dal Forno G, Palermo MT, Donohue JE, Karagiozis H, Zonderman AB, Kawas CH. Depressive symptoms, sex, and risk for Alzheimer's disease. Ann Neurol. 2005;57(3):381–387. doi: 10.1002/ana.20405. [DOI] [PubMed] [Google Scholar]
- de Asis JM, Stern E, Alexopoulos GS, Pan H, Van Gorp W, Blumberg H, et al. Hippocampal and anterior cingulate activation deficits in patients with geriatric depression. Am J Psychiatry. 2001;158(8):1321–1323. doi: 10.1176/appi.ajp.158.8.1321. [DOI] [PubMed] [Google Scholar]
- DeFries JC, Vandenberg SG, McClearn GE, Kuse AR, Wilson JR, Ashton GC, et al. Near identity of cognitive structure in two ethnic groups. Science. 1974;183(122):338–339. doi: 10.1126/science.183.4122.338. [DOI] [PubMed] [Google Scholar]
- Delis D, Kramer J, Kaplan E, Ober B. California Verbal Learning Test: Adult version. The Psychological Corporation; San Antonio, TX: 1987. [Google Scholar]
- Dolan RJ, Bench CJ, Brown RG, Scott LC, Friston KJ, Frackowiak RS. Regional cerebral blood flow abnormalities in depressed patients with cognitive impairment. J Neurol Neurosurg Psychiatry. 1992;55(9):768–773. doi: 10.1136/jnnp.55.9.768. [DOI] [PMC free article] [PubMed] [Google Scholar]
- Dotson VM, Davatzikos C, Kraut MA, Resnick SM. Depressive Symptoms and Brain Volumes in Older Adults: A Longitudinal MRI Study. Journal of Psychiatry and Neuroscience. in press. [PMC free article] [PubMed] [Google Scholar]
- Dotson VM, Resnick SM, Zonderman AB. Differential association of concurrent, baseline, and average depressive symptoms with cognitive decline in older adults. Am J Geriatr Psychiatry. 2008;16(4):318–330. doi: 10.1097/JGP.0b013e3181662a9c. [DOI] [PMC free article] [PubMed] [Google Scholar]
- Drevets WC. Neuroimaging studies of mood disorders. Biol Psychiatry. 2000;48(8):813–829. doi: 10.1016/s0006-3223(00)01020-9. [DOI] [PubMed] [Google Scholar]
- Drevets WC, Price JL, Simpson JR, Jr., Todd RD, Reich T, Vannier M, et al. Subgenual prefrontal cortex abnormalities in mood disorders. Nature. 1997;386(6627):824–827. doi: 10.1038/386824a0. [DOI] [PubMed] [Google Scholar]
- Driscoll I, Resnick SM, Troncoso JC, An Y, O'Brien R, Zonderman AB. Impact of Alzheimer's pathology on cognitive trajectories in nondemented elderly. Ann Neurol. 2006;60(6):688–695. doi: 10.1002/ana.21031. [DOI] [PubMed] [Google Scholar]
- Dunn RT, Kimbrell TA, Ketter TA, Frye MA, Willis MW, Luckenbaugh DA, et al. Principal components of the Beck Depression Inventory and regional cerebral metabolism in unipolar and bipolar depression. Biol Psychiatry. 2002;51(5):387–399. doi: 10.1016/s0006-3223(01)01244-6. [DOI] [PubMed] [Google Scholar]
- Ernst C, Angst J. The Zurich Study. XII. Sex differences in depression. Evidence from longitudinal epidemiological data. Eur Arch Psychiatry Clin Neurosci. 1992;241(4):222–230. doi: 10.1007/BF02190257. [DOI] [PubMed] [Google Scholar]
- Frodl T, Koutsouleris N, Bottlender R, Born C, Jager M, Scupin I, et al. Depression-related variation in brain morphology over 3 years: effects of stress? Arch Gen Psychiatry. 2008;65(10):1156–1165. doi: 10.1001/archpsyc.65.10.1156. [DOI] [PubMed] [Google Scholar]
- Frodl T, Meisenzahl E, Zetzsche T, Bottlender R, Born C, Groll C, et al. Enlargement of the amygdala in patients with a first episode of major depression. Biol Psychiatry. 2002;51(9):708–714. doi: 10.1016/s0006-3223(01)01359-2. [DOI] [PubMed] [Google Scholar]
- Frodl T, Meisenzahl EM, Zetzsche T, Born C, Groll C, Jager M, et al. Hippocampal changes in patients with a first episode of major depression. Am J Psychiatry. 2002;159(7):1112–1118. doi: 10.1176/appi.ajp.159.7.1112. [DOI] [PubMed] [Google Scholar]
- Fuhrer R, Dufouil C, Dartigues JF. Exploring sex differences in the relationship between depressive symptoms and dementia incidence: prospective results from the PAQUID Study. J Am Geriatr Soc. 2003;51(8):1055–1063. doi: 10.1046/j.1532-5415.2003.51352.x. [DOI] [PubMed] [Google Scholar]
- Gerton BK, Brown TT, Meyer-Lindenberg A, Kohn P, Holt JL, Olsen RK, et al. Shared and distinct neurophysiological components of the digits forward and backward tasks as revealed by functional neuroimaging. Neuropsychologia. 2004;42(13):1781–1787. doi: 10.1016/j.neuropsychologia.2004.04.023. [DOI] [PubMed] [Google Scholar]
- Goldman-Rakic PS, Brown RM. Regional changes of monoamines in cerebral cortex and subcortical structures of aging rhesus monkeys. Neuroscience. 1981;6(2):177–187. doi: 10.1016/0306-4522(81)90053-1. [DOI] [PubMed] [Google Scholar]
- Goldszal AF, Davatzikos C, Pham DL, Yan MX, Bryan RN, Resnick SM. An image-processing system for qualitative and quantitative volumetric analysis of brain images. J Comput Assist Tomogr. 1998;22(5):827–837. doi: 10.1097/00004728-199809000-00030. [DOI] [PubMed] [Google Scholar]
- Greenberg DL, Payne ME, MacFall JR, Steffens DC, Krishnan RR. Hippocampal volumes and depression subtypes. Psychiatry Res. 2008;163(2):126–132. doi: 10.1016/j.pscychresns.2007.12.009. [DOI] [PMC free article] [PubMed] [Google Scholar]
- Gualtieri CT, Johnson LG. Age-related cognitive decline in patients with mood disorders. Prog Neuropsychopharmacol Biol Psychiatry. 2008;32(4):962–967. doi: 10.1016/j.pnpbp.2007.12.030. [DOI] [PubMed] [Google Scholar]
- Gueorguieva R, Krystal JH. Move over ANOVA: progress in analyzing repeated-measures data and its reflection in papers published in the Archives of General Psychiatry. Arch Gen Psychiatry. 2004;61(3):310–317. doi: 10.1001/archpsyc.61.3.310. [DOI] [PubMed] [Google Scholar]
- Haringsma R, Engels GI, Beekman AT, Spinhoven P. The criterion validity of the Center for Epidemiological Studies Depression Scale (CES-D) in a sample of self-referred elders with depressive symptomatology. Int J Geriatr Psychiatry. 2004;19(6):558–563. doi: 10.1002/gps.1130. [DOI] [PubMed] [Google Scholar]
- Harvey PD, Reichenberg A, Bowie CR. Cognition and aging in psychopathology: focus on schizophrenia and depression. Annu Rev Clin Psychol. 2006;2:389–409. doi: 10.1146/annurev.clinpsy.2.022305.095206. [DOI] [PubMed] [Google Scholar]
- Herrmann LL, Goodwin GM, Ebmeier KP. The cognitive neuropsychology of depression in the elderly. Psychol Med. 2007;37(12):1693–1702. doi: 10.1017/S0033291707001134. [DOI] [PubMed] [Google Scholar]
- Kawas C, Gray S, Brookmeyer R, Fozard J, Zonderman A. Age-specific incidence rates of Alzheimer's disease: the Baltimore Longitudinal Study of Aging. Neurology. 2000;54(11):2072–2077. doi: 10.1212/wnl.54.11.2072. [DOI] [PubMed] [Google Scholar]
- Konarski JZ, Kennedy SH, McIntyre RS, Rafi-Tari S, Soczynska JK, Mayberg HS. Relationship between regional brain metabolism, illness severity and age in depressed subjects. Psychiatry Res. 2007;155(3):203–210. doi: 10.1016/j.pscychresns.2007.02.001. [DOI] [PubMed] [Google Scholar]
- Kumar A, Jin Z, Bilker W, Udupa J, Gottlieb G. Late-onset minor and major depression: early evidence for common neuroanatomical substrates detected by using MRI. Proc Natl Acad Sci U S A. 1998;95(13):7654–7658. doi: 10.1073/pnas.95.13.7654. [DOI] [PMC free article] [PubMed] [Google Scholar]
- Kumar A, Schweizer E, Jin Z, Miller D, Bilker W, Swan LL, et al. Neuroanatomical substrates of late-life minor depression. A quantitative magnetic resonance imaging study. Arch Neurol. 1997;54(5):613–617. doi: 10.1001/archneur.1997.00550170085018. [DOI] [PubMed] [Google Scholar]
- Lai T, Payne ME, Byrum CE, Steffens DC, Krishnan KR. Reduction of orbital frontal cortex volume in geriatric depression. Biol Psychiatry. 2000;48(10):971–975. doi: 10.1016/s0006-3223(00)01042-8. [DOI] [PubMed] [Google Scholar]
- Lamar M, Resnick SM, Zonderman AB. Longitudinal changes in verbal memory in older adults: distinguishing the effects of age from repeat testing. Neurology. 2003;60(1):82–86. doi: 10.1212/wnl.60.1.82. [DOI] [PubMed] [Google Scholar]
- Lavretsky H, Kurbanyan K, Ballmaier M, Mintz J, Toga A, Kumar A. Sex differences in brain structure in geriatric depression. Am J Geriatr Psychiatry. 2004;12(6):653–657. doi: 10.1176/appi.ajgp.12.6.653. [DOI] [PubMed] [Google Scholar]
- Lesser IM, Boone KB, Mehringer CM, Wohl MA, Miller BL, Berman NG. Cognition and white matter hyperintensities in older depressed patients. Am J Psychiatry. 1996;153(10):1280–1287. doi: 10.1176/ajp.153.10.1280. [DOI] [PubMed] [Google Scholar]
- Lockwood KA, Alexopoulos GS, van Gorp WG. Executive dysfunction in geriatric depression. Am J Psychiatry. 2002;159(7):1119–1126. doi: 10.1176/appi.ajp.159.7.1119. [DOI] [PubMed] [Google Scholar]
- MacQueen GM, Campbell S, McEwen BS, Macdonald K, Amano S, Joffe RT, et al. Course of illness, hippocampal function, and hippocampal volume in major depression. Proc Natl Acad Sci U S A. 2003;100(3):1387–1392. doi: 10.1073/pnas.0337481100. [DOI] [PMC free article] [PubMed] [Google Scholar]
- Mayberg HS. Positron emission tomography imaging in depression: a neural systems perspective. Neuroimaging Clin N Am. 2003;13(4):805–815. doi: 10.1016/s1052-5149(03)00104-7. [DOI] [PubMed] [Google Scholar]
- McKhann G, Drachman D, Folstein M, Katzman R, Price D, Stadlan EM. Clinical diagnosis of Alzheimer's disease: report of the NINCDS-ADRDA Work Group under the auspices of Department of Health and Human Services Task Force on Alzheimer's Disease. Neurology. 1984;34(7):939–944. doi: 10.1212/wnl.34.7.939. [DOI] [PubMed] [Google Scholar]
- Milak MS, Parsey RV, Keilp J, Oquendo MA, Malone KM, Mann JJ. Neuroanatomic correlates of psychopathologic components of major depressive disorder. Arch Gen Psychiatry. 2005;62(4):397–408. doi: 10.1001/archpsyc.62.4.397. [DOI] [PubMed] [Google Scholar]
- Nutt DJ, Baldwin DS, Clayton AH, Elgie R, Lecrubier Y, Montejo AL, et al. Consensus statement and research needs: the role of dopamine and norepinephrine in depression and antidepressant treatment. J Clin Psychiatry. 2006;67(Suppl 6):46–49. [PubMed] [Google Scholar]
- Ongur D, Drevets WC, Price JL. Glial reduction in the subgenual prefrontal cortex in mood disorders. Proc Natl Acad Sci U S A. 1998;95(22):13290–13295. doi: 10.1073/pnas.95.22.13290. [DOI] [PMC free article] [PubMed] [Google Scholar]
- Pantel J, Schroder J, Essig M, Popp D, Dech H, Knopp MV, et al. Quantitative magnetic resonance imaging in geriatric depression and primary degenerative dementia. J Affect Disord. 1997;42(1):69–83. doi: 10.1016/s0165-0327(96)00105-x. [DOI] [PubMed] [Google Scholar]
- Panza F, D'Introno A, Colacicco AM, Capurso C, Del Parigi A, Caselli RJ, et al. Temporal Relationship between Depressive Symptoms and Cognitive Impairment: The Italian Longitudinal Study on Aging. J Alzheimers Dis. 2009 doi: 10.3233/JAD-2009-1111. [DOI] [PubMed] [Google Scholar]
- Park D, Minear M. Cognitive aging: New directions for old theories. In: Dixon R, Backman L, Nilsson L, editors. New Frontiers in Cognitive Aging. Oxford University Press; New York: 2004. [Google Scholar]
- Piccinelli M, Wilkinson G. Gender differences in depression. Critical review. Br J Psychiatry. 2000;177:486–492. doi: 10.1192/bjp.177.6.486. [DOI] [PubMed] [Google Scholar]
- Pizzagalli DA, Peccoralo LA, Davidson RJ, Cohen JD. Resting anterior cingulate activity and abnormal responses to errors in subjects with elevated depressive symptoms: a 128-channel EEG study. Hum Brain Mapp. 2006;27(3):185–201. doi: 10.1002/hbm.20172. [DOI] [PMC free article] [PubMed] [Google Scholar]
- Radloff LS. The CES-D Scale: A self-report depression scale for research in the general population. Applied Psychological Measurement. 1977;1(3):385–401. [Google Scholar]
- Rajkowska G, Miguel-Hidalgo JJ, Wei J, Dilley G, Pittman SD, Meltzer HY, et al. Morphometric evidence for neuronal and glial prefrontal cell pathology in major depression. Biol Psychiatry. 1999;45(9):1085–1098. doi: 10.1016/s0006-3223(99)00041-4. [DOI] [PubMed] [Google Scholar]
- Rapp MA, Dahlman K, Sano M, Grossman HT, Haroutunian V, Gorman JM. Neuropsychological differences between late-onset and recurrent geriatric major depression. Am J Psychiatry. 2005;162(4):691–698. doi: 10.1176/appi.ajp.162.4.691. [DOI] [PubMed] [Google Scholar]
- Ravdin LD, Katzen HL, Agrawal P, Relkin NR. Letter and semantic fluency in older adults: effects of mild depressive symptoms and age-stratified normative data. Clin Neuropsychol. 2003;17(2):195–202. doi: 10.1076/clin.17.2.195.16500. [DOI] [PubMed] [Google Scholar]
- Raz N. The aging brain observed in vivo: Differential changes and their modifiers. In: Cabeza R, Nyberg L, Park D, editors. Cognitive Neuroscience of Aging: Linking Cognitive and Cerebral Aging. Oxford University Press; New York: 2004. [Google Scholar]
- Reitan R. Trail Making Test: Manual for Administration and Scoring. Reitan Neuropsychological Laboratory; Tucson, AZ: 1992. [Google Scholar]
- Resnick SM, Goldszal AF, Davatzikos C, Golski S, Kraut MA, Metter EJ, et al. One-year age changes in MRI brain volumes in older adults. Cereb Cortex. 2000;10(5):464–472. doi: 10.1093/cercor/10.5.464. [DOI] [PubMed] [Google Scholar]
- Resnick SM, Lamar M, Driscoll I. Vulnerability of the orbitofrontal cortex to age-associated structural and functional brain changes. Ann N Y Acad Sci. 2007;1121:562–575. doi: 10.1196/annals.1401.027. [DOI] [PubMed] [Google Scholar]
- Resnick SM, Pham DL, Kraut MA, Zonderman AB, Davatzikos C. Longitudinal magnetic resonance imaging studies of older adults: a shrinking brain. J Neurosci. 2003;23(8):3295–3301. doi: 10.1523/JNEUROSCI.23-08-03295.2003. [DOI] [PMC free article] [PubMed] [Google Scholar]
- Sachs-Ericsson N, Joiner T, Plant EA, Blazer DG. The influence of depression on cognitive decline in community-dwelling elderly persons. Am J Geriatr Psychiatry. 2005;13(5):402–408. doi: 10.1176/appi.ajgp.13.5.402. [DOI] [PubMed] [Google Scholar]
- Salloway S, Malloy P, Kohn R, Gillard E, Duffy J, Rogg J, et al. MRI and neuropsychological differences in early- and late-life-onset geriatric depression. Neurology. 1996;46(6):1567–1574. doi: 10.1212/wnl.46.6.1567. [DOI] [PubMed] [Google Scholar]
- Shen D, Davatzikos C. HAMMER: hierarchical attribute matching mechanism for elastic registration. IEEE Trans Med Imaging. 2002;21(11):1421–1439. doi: 10.1109/TMI.2002.803111. [DOI] [PubMed] [Google Scholar]
- Shock NW, Greulich RC, Andres R, Arenberg D, Costa PTJ, Lakatta EG, et al. Normal human aging : the Baltimore longitudinal study of aging. U.S. Government Printing Office; Washington, DC: 1984. [Google Scholar]
- Taki Y, Kinomura S, Awata S, Inoue K, Sato K, Ito H, et al. Male elderly subthreshold depression patients have smaller volume of medial part of prefrontal cortex and precentral gyrus compared with age-matched normal subjects: a voxel-based morphometry. J Affect Disord. 2005;88(3):313–320. doi: 10.1016/j.jad.2005.08.003. [DOI] [PubMed] [Google Scholar]
- Tekin S, Cummings JL. Frontal-subcortical neuronal circuits and clinical neuropsychiatry: an update. J Psychosom Res. 2002;53(2):647–654. doi: 10.1016/s0022-3999(02)00428-2. [DOI] [PubMed] [Google Scholar]
- Tucker DM, Luu P, Frishkoff G, Quiring J, Poulsen C. Frontolimbic response to negative feedback in clinical depression. J Abnorm Psychol. 2003;112(4):667–678. doi: 10.1037/0021-843X.112.4.667. [DOI] [PubMed] [Google Scholar]
- Videbech P, Ravnkilde B, Pedersen TH, Hartvig H, Egander A, Clemmensen K, et al. The Danish PET/depression project: clinical symptoms and cerebral blood flow. A regions-of-interest analysis. Acta Psychiatr Scand. 2002;106(1):35–44. doi: 10.1034/j.1600-0447.2002.02245.x. [DOI] [PubMed] [Google Scholar]
- Wechsler D. Wechsler Adult Intelligence Scale—Revised. The Psychological Corporation; New York: 1981. [Google Scholar]
- Wilson RS, Mendes De Leon CF, Bennett DA, Bienias JL, Evans DA. Depressive symptoms and cognitive decline in a community population of older persons. J Neurol Neurosurg Psychiatry. 2004;75(1):126–129. [PMC free article] [PubMed] [Google Scholar]
- Yesavage JA, Brink TL, Rose TL, Lum O, Huang V, Adey M, et al. Development and validation of a Geriatric Depression Screening Scale: A preliminary report. Journal of Psychiatric Research. 1983;17(1):37–49. doi: 10.1016/0022-3956(82)90033-4. [DOI] [PubMed] [Google Scholar]
- Yuan Y, Zhang Z, Bai F, Yu H, Shi Y, Qian Y, et al. Abnormal neural activity in the patients with remitted geriatric depression: A resting-state functional magnetic resonance imaging study. J Affect Disord. 2008;111(23):145–152. doi: 10.1016/j.jad.2008.02.016. [DOI] [PubMed] [Google Scholar]
- Yuan Y, Zhang Z, Bai F, Yu H, Shi Y, Qian Y, et al. White matter integrity of the whole brain is disrupted in first-episode remitted geriatric depression. Neuroreport. 2007;18(17):1845–1849. doi: 10.1097/WNR.0b013e3282f1939f. [DOI] [PubMed] [Google Scholar]