

Abstract
Label-free nanosensors can detect disease markers to provide point-of-care diagnosis that is low-cost, rapid, specific and sensitive.1-13 However, detecting these biomarkers in physiological fluid samples is difficult because of problems like biofouling and nonspecific binding, and the resulting need to use purified buffers greatly reduces the clinical relevance of these sensors. Here, we overcome this limitation by using distinct components within the sensor to perform purification and detection. A microfluidic purification chip captures multiple biomarkers simultaneously from blood samples and releases them, after washing, into purified buffer for sensing by a silicon nanoribbon detector. This two-stage approach isolates the detector from the complex environment of whole blood, and reduces its minimum required sensitivity by effectively pre-concentrating the biomarkers. We show specific and quantitative detection of two model cancer antigens from a 10 uL sample of whole blood in less than 20 minutes. This study marks the first use of label-free nanosensors with physiologic solutions, positioning this technology for rapid translation to clinical settings.
Biomarkers have emerged as potentially important diagnostic tools for cancer and many other diseases. Continuing discoveries of such biomarkers and their aggregation into molecular signatures suggests that multiple biomarkers will be necessary to precisely define disease states. Thus, parallel detection of biomarker arrays is essential for translation from benchtop discovery to clinical validation. Such a technique would enable rapid, point-of-care (POC) applications requiring immediate diagnosis from a physiological sample. Critically, such a system must also be capable of detecting very low levels of aberrant genes and proteins, as many biomarkers are present at minute concentrations during early disease phases3-6. Given these requirements, the use of conventional diagnostic assays5,6,14 has been limiting. An approach that is based on rapid, label-free sensing technologies would be ideally suited for clinical applications6-13.
Since their introduction in 2001 (Ref. 7), label-free nanosensors have demonstrated great potential to serve as POC detectors capable of ultrasensitive, real-time, multiplexed detection of multiple biomolecular species6,8-13. Despite their appeal, electronic nanosensors continue to be a challenge to implement because fundamental limitations render them incapable of sensing molecules in complex, physiologic solutions6,8-13. Biofouling and nonspecific binding readily degrade the minute active surface areas of such devices (< 0.1 μm2)15 and label-free sensing requires purified, precisely controlled buffers in order to enable measurements to be performed. In the case of nanowire field-effect transistor (FET) sensing, low salt (<∼1 mM) buffers are required to prevent screening of the charge-based electronic signal12,16.
To overcome these limitations we have developed a novel in-line microfabricated device that operates upstream of the nanosensors to purify biomarkers of interest. This microfluidic purification chip (MPC) captures cancer biomarkers from physiologic solutions and, after washing, releases the antigens17 into a pure buffer suitable for sensing. The chip design increases nanosensor specificity to that of conventional sandwich assay techniques because it requires two antibodies to bind biomarkers in order for a positive signal to be produced18.
Figure 1 schematically illustrates the operation of the MPC chip. The avidin-functionalized chip19 (Fig. 1a) is treated with antibodies to any number of specific biomarkers conjugated to biotinylated, photocleavable crosslinkers containing a specific 19-mer DNA sequence (Fig. 2a)20. The MPC geometry was chosen to optimize biomarker binding (Supplementary Fig. S1)14 and chips were fabricated from 4-inch silicon wafers in a one-step photolithographic process (Supplementary Fig. S2). Completed chips (Fig. 2b) were loaded into a custom-machined flow chamber (inset, Fig. 2b and Supplementary Fig. S3), which enabled fluid handling and maintained a constant 5 μL volume in the system.
Figure 1. Schematic of MPC operation.
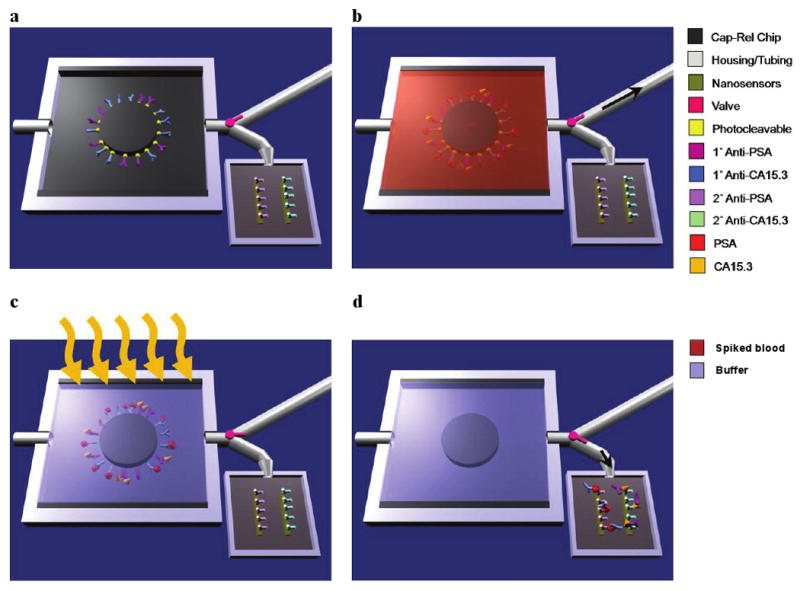
a, Primary antibodies to multiple biomarkers, here prostate specific antigen (PSA) and carbohydrate antigen-15.3 (CA15.3), are bound with a photocleavable crosslinker to the MPC. The chip is placed in a plastic housing and a valve (pink) directs fluid flow exiting the chip to either a waste receptacle or the nanosensor chip. b, Whole blood is injected into the chip with the valve set to the waste compartment (black arrow shows the direction of fluid flow) and, if present in the sample, biomarkers bind their cognate antibodies. c, Washing steps follow blood flow and the chip volume (5 μL) is filled with sensing buffer prior to UV irradiation (orange arrows). During UV exposure, the photolabile crosslinker cleaves, releasing the antibody-antigen complexes into solution. d, The valve is set to the nanosensor reservoir (black arrow shows the direction of fluid flow) and the 5 μL volume is transferred, enabling label-free sensing to be performed to determine the presence of specific biomarkers.
Figure 2. MPC operation.
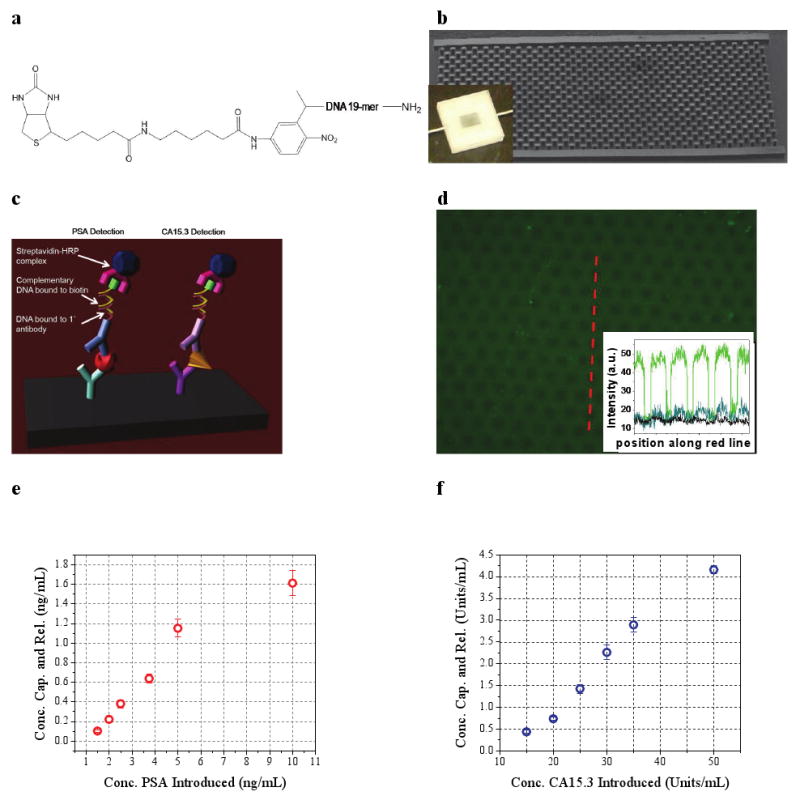
a, Molecular structure of the photocleavable crosslinker. Primary antibody conjugation was performed with the amino group (right) and binding to chip-bound avidin occurred through the biotin group (left). b, Scanning electron micrograph of a representative w = 4 mm × l = 7 mm × h = 100 μm MPC capture-release chip. The inset is an optical image of MPC operation during washing. c, Schematic representation of PSA and CA15.3 detection using a modified ELISA technique. d, Fluorescence optical micrograph of an anti-OVA functionalized MPC following OVA-FITC-spiked whole blood flow and washing. The inset plots the pixel intensity (gray value, determined by ImageJ) versus position for the red cutline (green dataplot) and similar cutlines from images of post-UV irradiation and transfer (blue) and of an anti-PSA functionalized MPC following OVA-FITC-spiked blood flow and washing. The same exposure times were used for all images. e, Scatter plot showing the concentration of PSA and f, CA15.3 released from the MPC versus the concentration of PSA and CA15.3 introduced in whole blood, respectively. Each datapoint represents the average of three separate MPC runs and error bars represent one standard deviation.
An example operation is illustrated in Fig. 1b-d. First, a blood sample flows through the chip (Fig. 1b) and the chip-bound antibodies bind specific soluble biomarkers, essentially purifying these molecules from whole blood. After this capture step, wash and sensing buffers are perfused through the device. Next, flow is halted and the sensing buffer-filled MPC chip is irradiated with UV light (Fig. 1c), resulting in cleavage of the photolabile group20-23 and release of the bound biomarker-antibody-DNA complexes. The UV photocleavage process was shown not to affect the immunoactivity of the biomarkers (Supplementary Fig. S4). The DNA component was critical for preliminary assay validation experiments (Fig. 2c). As shown in Fig. 1d, after a second valve switching step transfers MPC contents to the nanosensor chip, the complexes bind the secondary antibodies on the nanowire surfaces. The purification/sensing operation thus requires two specific antibody binding events for detection, a significant improvement in selectivity over previous label-free nanosensing schemes6-13.
To demonstrate the effectiveness of the capture-release approach, we utilized a readily available fluorescently labeled antigen-antibody pair, fluorescently labeled chicken ovalbumin (OVA-FITC), and its antibody anti-OVA IgG. OVA-FITC was added to heparinized murine blood and flowed through an anti-OVA functionalized chip. After washing and flushing with sensing buffer, fluorescence imaging demonstrated specific OVA-FITC binding to chip-bound antibodies (Fig. 2d). A control chip, to which anti-prostate specific antigen (PSA) was bound, showed a negligible fluorescent signal (inset, Fig. 2d). After UV irradiation and subsequent flushing of the sensing reservoir with fresh buffer, the fluorescence signal from the anti-OVA chip was greatly diminished (inset, Fig. 2d).
To demonstrate the generality of MPC technique we used two model cancer antigens, PSA and carbohydrate antigen 15.3 (CA15.3), standard clinical markers for prostate24-25 and breast cancer26-27, respectively. Successful capture and release of PSA and CA15.3 was verified with a modified enzyme-linked immunoassay (ELISA) technique (Fig. 2c)18, in which the first detection step consisted of the hybridization of a complementary, biotinylated 19-mer to the crosslinker DNA sequence. Six increasing concentrations of PSA and CA15.3 were added to heparinized rat blood and samples were flowed through MPCs functionalized with both anti-PSA and anti-CA15.3. The introduced concentrations spanned clinically relevant ranges24-27. The data in Fig. 2e-f demonstrate a monotonic relationship between the concentration of biomarker introduced in whole blood and that released into pure sensing buffer. The absolute yields of these experiments are in agreement with modeling studies (Supplementary Fig. S1c). Biomarker capture by MPCs can be significantly increased by adjusting either the operation conditions such as the flow rate into the device (modeled in Supplementary Fig. S1d) or the device dimensions.
A critical feature of this integrated approach is that the MPC-purified biomarker complex concentrations are well above those required for label-free, electronic detection. Although previous studies using nanowire sensors have demonstrated PSA detection as low as 0.9 pg/mL (Refs. 6,10), this exquisite sensitivity is not a critical factor for MPC-nanosensor operation. We thus chose to use “nanoribbons,” devices with nanoscale thicknesses and microscale lateral dimensions28, which are less sensitive but have significant fabrication and cost advantages. These devices, fabricated using conventional lithographic techniques, have been demonstrated to detect streptavidin in the 0.0318–53 ng/mL range28, a sensitivity range ideally suited for MPC-purified cancer antigen detection. We fabricated 25 nm-thin devices according to a similar process (Supplementary Fig. S5)28, but incorporated Ohmic contacts to devices. Device images are given in Fig. 3a. Electrical characterization verified that this approach produced high-quality devices, with on/off ratios of >106 (Fig. 3b) and small hystereses between forward and reverse IDS(VG) sweeps (Fig. 3c). Surface functionalization did not compromise device electrical characteristics (Supplementary Fig. S7) and solution gating (VG, SOLN) demonstrated that VG = -5 V was an optimal operating point for sensing studies (Fig. 3d).
Figure 3. Nanosensor electrical characteristics.
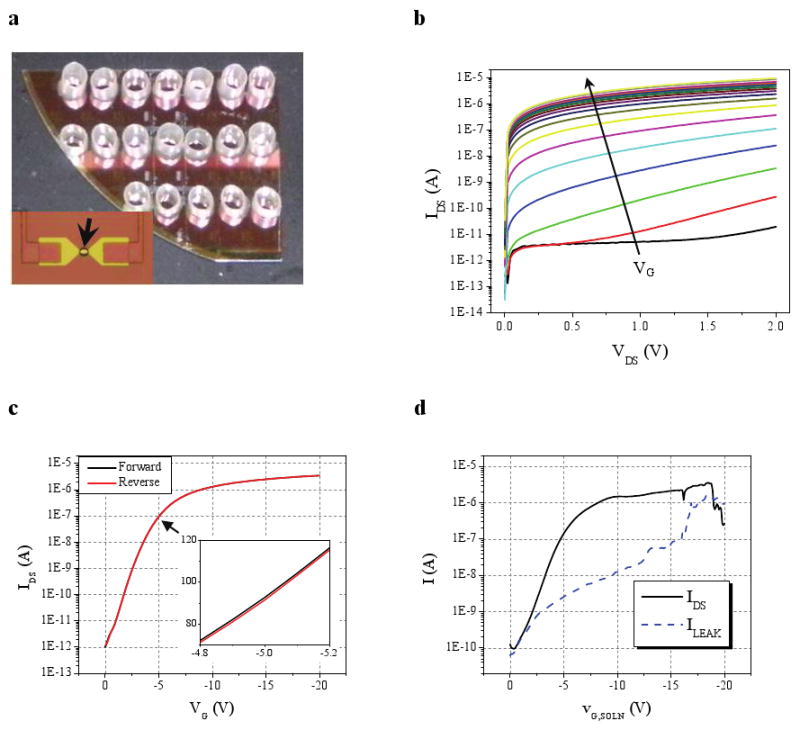
a, Optical image of devices outfitted with sensing reservoirs. The inset shows an optical micrograph of a completed device. Only the central region of the device (black arrow) is exposed to the solution. Metal leads contact the device source and drain and fan out to larger contacts (not shown). The 25 nm thick silicon device appears yellow. b, IDS(VDS) plot for VG varied from 0 to -20V (black arrow shows direction of increasing negative VG) for a representative device illustrating p-type accumulation mode behavior. c, IDS(VG) plot (VDS = 1V) for the device used in b. The inset highlights IDS (nA) around the operating point (VG = -5V). d, Plot demonstrating the effect of varying solution gate voltage (VG, SOLN) on device current (IDS; black solid) and device-to-solution leakage current (ILEAK; blue dashed) for VDS = 1V.
As shown in Fig. 2 and detailed in the Supplementary Information, devices are functionalized either with anti-PSA or anti-CA15.3. Antibodies were immobilized to the sensor using NHS/EDC chemistry. To verify that the signal from binding proteins would not be screened by the buffer solution, direct measurements of the amount of the signal that would be unscreened were done by varying buffer salt concentration16. This study indicated that approximately 50% of the signal was not screened by the buffer solution (see Supplementary Information).
Next, we applied these devices to sensing the biomarkers from the MPC-purified whole blood samples. The normalized responses of these same devices to MPC-purified, antigen-spiked blood samples containing both 2.5 ng/mL PSA and 30 U/mL CA15.3 (as well as negative controls) are shown in Fig. 4a and 4b, respectively. After the injection transient noise subsides11, device current levels were increased by antigen binding due to the negative charge conferred to the antigens by the basic sensing buffer. Similar signals were obtained with a PSA/CA15.3 spiked sensing buffer positive control, and no device response was observed with an unspiked, MPC-purified blood negative control. To reduce potential transient electrical signals upon injection, buffer salt concentrations of the functionalized devices and the MPC-purifies samples are kept the same. The positive signal is observed to increase linearly in time, following well-known ligand-receptor kinetics,29 in which initial rates at low relative analyte concentrations are directly proportional to the species concentration30. In fact, the asymptotic saturation value of the device response is weakly dependent on the concentration for reversible reactions with a low dissociation constant29 which is the case for the antigen-antibody interactions. Thus, we focus on the initial kinetic reaction rates instead of endpoint detection30.
Figure 4. Label-free sensing.

All sensing measurements were performed at VDS = 1V and VG = -5V and all sample introductions occurred at time = 0. Normalizations were performed by dividing device currents by the pre-addition (time < 0) current level average. a, Response of an anti-PSA functionalized sensor to a MPC-purified blood sample initially containing 2.5 ng/mL PSA (and also 30 U/mL CA15.3), or a control sample containing neither. b, Response of an anti-CA15.3 functionalized sensor to a MPC-purified blood sample blood sample initially containing 30 U/mL CA15.3 (and also 2.5 ng/mL PSA), or a control sample containing neither. c, Normalized response of two anti-PSA and d, two anti-CA15.3 functionalized devices to MPC-purified blood containing both PSA and CA 15.3, with concentrations labeled. A least squares fit is represented by a solid black line, over the selected region (line endpoints). The ratio of the the normalized slopes calibrates the ratio of concentrations.
Using these rates, a quantification of analyte concentrations (against a known) can be made, as shown in Fig. 4c and 4d. Whole blood samples spiked with 2 ng/mL PSA and 15 U/mL CA15.3 were MPC purified and sensed with anti-PSA and anti-CA15.3 functionalized devices. Using the slope of the normalized device temporal response, we find slope ratios of both the PSA and CA15.3 responses agree quite well with the initial spiked whole biomarker concentrations. For PSA, the slope ratio is 1.38, compared with a concentration ratio of 1.25; for CA15.3, the slope ratio is 1.94, versus a concentration ratio of 2.0. It should be noted that this quantification occurs in the presence of another species, demonstrating selectivity as well (See Supplementary Information for further repeatability data).
The integration of a microfluidic purification step with label-free nanosensor detection represents a paradigm shift in label-free electronic sensing of biomolecules. The technique described here enables biomarker detection from whole blood or any other physiologic fluid without the challenges associated with tailoring sensor operation for the medium of interest or engineering nanosensors that can withstand complex fluid media. Additionally, the need for ultrasensitivity in electronic detection may not be essential with such an integrated platform because of its ability to pre-concentrate molecules of choice prior to sensing. The attractiveness of the method lies in its simplicity, speed, and ability to simultaneously capture multiple biomarkers, enabling multiplexed, highly sensitive downstream detection with label-free sensors. The proof of principle demonstration of the non-integrated individual components here should be easily to integrate into a compact, self-contained system. Furthermore, the low cost of MPC purification renders this system capable of stand-alone use or use in tandem with more expensive sensing methodologies, such as rare circulating tumor cell detectors14 for more complex diagnoses. The portability and versatility of this method represents the crucial next step for label-free sensors and should position these and similar nascent sensing technologies for rapid molecular signature determinations.
Supplementary Material
Acknowledgments
The authors would like to thank Joe Straight for many helpful discussions, Michael Look and James Bertram for blood samples, Michael Power for device processing assistance, Mark Saltzman for departmental support, and David Stern and Kathleen Milnamow for critical reading of the manuscript. The work was supported in part by the NIH through grant R01EB008260 (M.A.R and T.M.F), CIfAR, and ARO (W911NF-08-1-0365) This work was performed in part at the Cornell Nanoscale Science and Technology Facility, a member of the National Nanotechnology Infrastructure Network that is supported by the NSF and at the Yale Center for Microelectronic Materials and Structures. This paper is dedicated in memory of Alan R. Stern.
Footnotes
Author Contributions: E.S. designed the MPC and performed all MPC experiments. E.S. and B.R.I. designed the MPC fabrication and performed MPC processing. E.S., A.V., and M.A.R. designed the nanosensor fabrication process and E.S., A.V., and B.R.I. performed nanosensor processing. D.J.M. assisted with MPC and nanosensor experimental design, and data analysis. E.S., A.V., N.K.R., and J.M.C. performed the sensing measurements. E.S., J.M.C., and J.P. prepared and analyzed the protein samples. E.S., M.A.R., and T.M.F. wrote the manuscript and edited it with contributions from all authors.
Additional information: Supplementary Information accompanies this paper at www.nature.com/naturenanotechnology.
Contributor Information
Mark A. Reed, Email: mark.reed@yale.edu.
Tarek M. Fahmy, Email: tarek.fahmy@yale.edu.
References
- 1.Sander C. Genomic medicine and the future of health care. Science. 2000;287:1977. doi: 10.1126/science.287.5460.1977. [DOI] [PubMed] [Google Scholar]
- 2.Jemal A, et al. Cancer statistics, 2008. CA Cancer J Clin. 2008;58:71. doi: 10.3322/CA.2007.0010. [DOI] [PubMed] [Google Scholar]
- 3.Etzioni R, et al. The case for early detection. Nat Rev Cancer. 2003;3:243. doi: 10.1038/nrc1041. [DOI] [PubMed] [Google Scholar]
- 4.Liang S, Chan DW. Enzymes and related proteins as cancer biomarkers: A proteomic approach. Clin Chim Acta. 2007;381:93. doi: 10.1016/j.cca.2007.02.017. [DOI] [PMC free article] [PubMed] [Google Scholar]
- 5.Fan R, et al. Integrated barcode chips for rapid, multiplexed analysis of proteins in microliter quantities of blood. Nat Biotechnol. 2008;26:1373. doi: 10.1038/nbt.1507. [DOI] [PMC free article] [PubMed] [Google Scholar]
- 6.Zheng G, Patolsky F, Cui Y, Wang WU, Lieber CM. Multiplexed electrical detection of cancer markers with nanowire sensor arrays. Nat Biotechnol. 2005;23:1294. doi: 10.1038/nbt1138. [DOI] [PubMed] [Google Scholar]
- 7.Cui Y, Wei Q, Park H, Lieber CM. Nanowire nanosensors for highly sensitive and selective detection of biological and chemical species. Science. 2001;293:1289. doi: 10.1126/science.1062711. [DOI] [PubMed] [Google Scholar]
- 8.Jain KK. Nanotechnology in clinical laboratory diagnostics. Clin Chim Acta. 2005;358:37. doi: 10.1016/j.cccn.2005.03.014. [DOI] [PubMed] [Google Scholar]
- 9.Burg Thomas P, et al. Weighing of biomolecules, single cells and single nanoparticles in fluid. Nature. 2007;446:1066. doi: 10.1038/nature05741. [DOI] [PubMed] [Google Scholar]
- 10.Kim Ansoon, et al. Ultrasensitive, label-free, and real-time immunodetection using silicon field-effect transistors. Appl Phys Lett. 2007;91:103901. [Google Scholar]
- 11.Stern E, et al. Label-free immunodetection with CMOS-compatible semiconducting nanowires. Nature. 2007;445:519. doi: 10.1038/nature05498. [DOI] [PubMed] [Google Scholar]
- 12.Stern E, Vacic A, Reed MA. Semiconducting nanowire field-effect transistor biomolecular sensors. IEEE Trans Elec Dev. 2008;55:3119. [Google Scholar]
- 13.Bunimovich YL, et al. Quantitative real-time measurements of DNA hybridization with alkylated nonoxidized silicon nanowires in electrolyte solution. J Am Chem Soc. 2006;128:16323. doi: 10.1021/ja065923u. [DOI] [PMC free article] [PubMed] [Google Scholar]
- 14.Nagrath S, et al. Isolation of rare circulating tumor cells in cancer patients by microchip technology. Nature. 2007;450:1235. doi: 10.1038/nature06385. [DOI] [PMC free article] [PubMed] [Google Scholar]
- 15.Gupta AK, et al. Anomalous resonance in a nanomechanical biosensor. Proc Nat Acad Sci. 2006;103:13362. doi: 10.1073/pnas.0602022103. [DOI] [PMC free article] [PubMed] [Google Scholar]
- 16.Stern E, et al. Importance of the Debye screening length on nanowire field effect transistor sensors. Nano Lett. 2007;7:3405. doi: 10.1021/nl071792z. [DOI] [PMC free article] [PubMed] [Google Scholar]
- 17.Zhou H, Ranish JA, Watts JD, Aebersold R. Quantitative proteome analysis by solid-phase isotope tagging and mass spectrometry. Nat Biotechnol. 2002;20:512. doi: 10.1038/nbt0502-512. [DOI] [PubMed] [Google Scholar]
- 18.Templin MF, Stoll D, Bachmann J, Joos TO. Protein microarrays and multiplexed sandwich immunoassays: what beats the beads? Comb Chem High Through Screen. 2004;7:223. doi: 10.2174/1386207043328814. [DOI] [PubMed] [Google Scholar]
- 19.Hermanson GT. Bioconjugate Techniques. Elsevier Science & Technology; New York: 1996. [Google Scholar]
- 20.Bai X, Kim S, Li Z, Turro NJ, Ju J. Design and synthesis of a photocleavable biotinylated nucleotide for DNA analysis by mass spectrometry. Nucl Acid Res. 2004;32:535. doi: 10.1093/nar/gkh198. [DOI] [PMC free article] [PubMed] [Google Scholar]
- 21.Handwerger RG, Diamond SL. Biotinylated photocleavable polyethylenimine: Capture and triggered release of nucleic acids from solid supports. Bioconj Chem. 2007;18:717. doi: 10.1021/bc060280t. [DOI] [PMC free article] [PubMed] [Google Scholar]
- 22.Senter PD, et al. Novel photocleavable protein crosslinking reagents and their use in the preparation of antibody-toxin conjugates. Photochemistry and Photobiology. 1985;42:231. [Google Scholar]
- 23.Olejnik J, et al. Photocleavable biotin derivatives - a versatile approach for the isolation of biomolecules. Proc Nat Acad Sci. 1995;92:7590. doi: 10.1073/pnas.92.16.7590. [DOI] [PMC free article] [PubMed] [Google Scholar]
- 24.Vickers AJ, Savage C, O'Brien MF, Lilja H. Systematic review of pretreatment prostate-specific antigen velocity and doubling time as predictors for prostate cancer. J Clin Oncol. 2009;27:398. doi: 10.1200/JCO.2008.18.1685. [DOI] [PMC free article] [PubMed] [Google Scholar]
- 25.Shariat SF, Scardino PT, Lilja H. Screening for prostate cancer: an update. Can J Urol. 2008;15:4363. [PMC free article] [PubMed] [Google Scholar]
- 26.Rubach M, Szymendera JJ, Kaminska J, Kowalska M. Serum CA 15.3, CEA and ESR patterns in breast cancer. Int J Biol Markers. 1997;12:168. doi: 10.1177/172460089701200406. [DOI] [PubMed] [Google Scholar]
- 27.Uehara M, et al. Long-term prognostic study of carcinoembryonic antigen (CEA) and carbohydrate antigen 15-3 (CA 15-3) in breast cancer. Int J Clin Oncol. 2008;13:445. doi: 10.1007/s10147-008-0773-3. [DOI] [PubMed] [Google Scholar]
- 28.Elfstrom N, Karlstrom AE, Linnros J. Silicon nanoribbons for electrical detection of biomolecules. Nano Lett. 2008;8:945. doi: 10.1021/nl080094r. [DOI] [PubMed] [Google Scholar]
- 29.Cantor CR, Schimmel PR. Biophysical Chemistry: Part III: The Behavior of Biological Macromolecules. Freeman; 1980. [Google Scholar]
- 30.Homola J. Anal Bioanal Chem. 2003;377:528. doi: 10.1007/s00216-003-2101-0. [DOI] [PubMed] [Google Scholar]
Associated Data
This section collects any data citations, data availability statements, or supplementary materials included in this article.