

Abstract
Recent studies using diffusion tensor imaging (DTI) have advanced our knowledge of the organization of white matter subserving language function. It remains unclear, however, how DTI may be used to predict accurately a key feature of language organization: its asymmetric representation in one cerebral hemisphere. In this study of epilepsy patients with unambiguous lateralization on Wada testing (19 left and 4 right lateralized subjects; no bilateral subjects), the predictive value of DTI for classifying the dominant hemisphere for language was assessed relative to the existing standard - the intra-carotid Amytal (Wada) procedure. Our specific hypothesis is that language laterality in both unilateral left- and right-hemisphere language dominant subjects may be predicted by hemispheric asymmetry in the relative density of three white matter pathways terminating in the temporal lobe implicated in different aspects of language function: the arcuate (AF), uncinate (UF), and inferior longitudinal fasciculi (ILF). Laterality indices computed from asymmetry of high anisotropy AF pathways, but not the other pathways, classified the majority (19 of 23) of patients using the Wada results as the standard. A logistic regression model incorporating information from DTI of the AF, fMRI activity in Broca’s area, and handedness was able to classify 22 of 23 (95.6%) patients correctly according to their Wada score. We conclude that evaluation of highly anisotropic components of the AF alone has significant predictive power for determining language laterality, and that this markedly asymmetric distribution in the dominant hemisphere may reflect enhanced connectivity between frontal and temporal sites to support fluent language processes. Given the small sample reported in this preliminary study, future research should assess this method on a larger group of patients, including subjects with bihemispheric dominance.
Keywords: Diffusion Tensor Imaging, Language, Laterality, Wada (sodium Amytal) Test, Arcuate Fasciculus, Uncinate Fasciculus, Inferior Longitudinal Fasciculus, Inferior Occipitofrontal Fasciculus, Handedness, Functional Magnetic Resonance Imaging, Broca’s Area
Introduction
Diffusion tensor imaging (DTI) has been used successfully to map the structure and asymmetry of white matter fiber tracts implicated in human language function (Catani et al., 2005; Hagmann et al., 2006; Powell et al., 2006; Glasser and Rilling, 2008). However, the utility of DTI for predicting hemispheric laterality, a prominent feature of the language organization in the human brain, remains largely unknown. Nine of ten right-handed epileptics evaluated for surgical treatment have language function represented in the left hemisphere (Isaacs et al., 2006), and a similar proportion of healthy humans are estimated to be left-lateralized (Khedr et al., 2002). While it’s clear that language is represented unilaterally in the majority of humans, the structural basis underlying functional lateralization requires further investigation in order to develop methods that may accurately determine laterality within individual subjects. It is the purpose of the present study to investigate in epilepsy patients the relationship between hemispheric subcortical white matter organization and laterality.
The accepted standard for determining language laterality relies on a hemispheric-specific transient lesion induced by injection of sodium Amytal into either the left or right carotid artery, commonly called the Wada procedure (Wada and Rasmussen, 2007). After injection, the dominant hemisphere is identified based on the patient’s responses to a battery of neuropsychological tests of expressive and receptive language function (Breier et al., 1999). The Wada test is invasive, costly, generally considered an unpleasant experience by patients, and carries some associated risk (Kemp et al., 2008; Loddenkemper et al., 2008). Yet it remains the only definitive method for identifying the dominant language hemisphere in patients being evaluated for focal cerebral resections to treat epilepsy or remove brain tumors. Non-invasive functional assessments of laterality exist in the form of functional magnetic resonance imaging (fMRI) during language tasks, which correlates well with results of the Wada (Binder et al., 1996; Binder, 1997; Benke et al., 2006; Chlebus et al., 2007), magnetoencephalography (MEG), which has also been shown to correlate with Wada outcome (Hirata et al., 2004; Papanicolaou et al., 2004), and transcranial Doppler sonography (Deppe et al., 2004). However, none of the measures provide perfect correlation with the Wada test, and moreover, they require the cooperation of a non-sedated, co-operative patient able to perform the tasks. Patients with claustrophobia or cognitive limitations cannot be assessed using these functional imaging methodologies.
Prior studies have attempted to relate structural differences in cortical regions between the hemispheres to language lateralization, and have provided mixed results. Two early investigations suggested that planum temporale area asymmetry correlated with results of Wada testing (Foundas et al., 1994), and that area asymmetry of pars triangularis (the anterior portion of Broca’s area) also predicted Wada outcome (Foundas et al., 1996). However, another group concluded that leftward structural asymmetry of the planum temporal and Heschl’s gyrus did not correlate with language lateralization, but that grey matter concentration in the posterior part of inferior frontal gyrus (pars opercularis, the posterior portion of Broca’s area) did predict language function in a group of left and right Wada patients (Dorsaint-Pierre et al., 2006). Hemispheric differences in cytoarchitectonics have also been reported. In a study of ten postmortem brains, the volume of Brodmann’s Area (BA) 44 was reported to be greater in the left compared to right hemisphere (Amunts et al., 1999), although it is unclear how this finding related to individual subject language laterality.
There is a strong relationship between handedness and hemispheric dominance for language (Lishman and McMeekan, 1977; Khedr et al., 2002; Isaacs et al., 2006). While nine of ten right handers are left hemisphere dominant, a larger proportion of left handers and ambidextrous individuals are right hemisphere dominant. Handedness and dermatoglyphic asymmetry – namely the hair-whorl direction - have been proposed to share a common genetic mechanism (Ortiz de Zarate and Ortiz de Zarate, 1991; Klar, 2003) that may affect cerebral language dominance (Weber et al., 2006). However, results from a more recent study suggest there is no association between hair-whorl direction and language laterality (Jansen et al., 2007). Thus, since handedness alone cannot predict language laterality, and there appears to be no other reliable external marker to determine lateralization, non-invasive brain imaging would appear to be the only alternative to the invasive Wada procedure for determining language laterality based on structure alone. Diffusion tensor imaging (DTI) is a technique for mapping the degree of water diffusion in biological tissues (Basser et al., 1994; Conturo et al., 1999; Mori et al., 2002). DTI tractography (Conturo et al., 1999; Mori et al., 2002) allows white matter fiber tracts to be computed and reconstructed from the principal direction of water diffusivity at each imaging voxel. DTI tractography allows one to infer how subcortical white matter is topographically organized to connect multiple cortical sites. Investigators have begun to use DTI tractography to examine how subcortical fiber systems are organized with respect to language function and other variables like gender and handedness.
Results from one recent DTI tractography study supports the idea that between-hemisphere language network architecture varies by both sex and handedness (Hagmann et al., 2006), with women reported to have stronger interhemispheric ‘connections’. Yet it is not clear how this difference may be related to language laterality. While early studies put forth the idea that females are less lateralized (Harris, 1980; McGlone, 1980), two recent metanalyses failed to find support for gender differences in language lateralization of brain structure or function (Sommer et al., 2008; Wallentin, 2009). Furthermore, three large-sample investigations of language laterality in epilepsy patients using the Wada procedure also failed to find sex differences in the incidence of atypical dominance for speech (Kurthen et al., 1992; Strauss et al., 1992; Helmstaedter et al., 1997a; Helmstaedter et al., 1997b). This discrepancy between older lesion-based studies and newer reports with imaging data may be reconciled by the greater recovery potential of language function, in females, after a dominant hemispheric insult (Miller et al., 2005). As for handedness, a study of 10 healthy right-handed subjects found left-ward asymmetry in fronto-temporal mean fractional anisotropy and tract volumes that correlated with language lateralization determined by functional imaging (Powell et al., 2006). Another study of relative fiber density of the AF in both left and right handers has reported leftward asymmetry irrespective of handedness or functional lateralization measured with fMRI (Vernooij et al., 2007). Extreme leftward lateralization of the AF has also been reported in more than half of a set of normal subjects studied (Catani et al., 2007), with 17.5% of subjects showing symmetric AF structure, and those with more symmetric distribution reported to perform better on verbal fluency tasks.
Two recent studies suggest that some tractography parameters, such as frontal-temporal tract volume or overall pathway number, correlate with Wada outcome (Matsumoto et al., 2008) and fMRI activity (Rodrigo et al., 2008). Additionally, an investigation of brain development using serial tractography measures shows not only asymmetry in anisotropic values of voxels during the development of the AF early in life (Dubois et al., 2008), but also a progressive increase in these values along the course of development likely commensurate with the acquisition of more sophisticated language abilities. We have also recently shown that a close spatial relationship exists between essential language sites localized by cortical stimulation mapping and the terminations of the arcuate fasciculus (Ellmore et al., 2009). Given these results, the aim of this study was to assess asymmetry in white matter anisotropy separately and in relationship to other variables (e.g., handedness, sex, functional brain activity, etc.), and determine its predictive power for classifying the dominant language hemisphere in individual subjects. To this end, we focused on the temporal lobe, where three white matter fiber tracts implicated in language function are documented to have terminations. The classic arcuate fasciculus (AF) connects Broca’s area in the frontal lobe with Wernicke’s area in the temporal lobe. A recent DTI study has identified another component that runs parallel and lateral to the classic AF and consists of two segments, one connecting Broca’s area with the inferior parietal lobe and the other connecting inferior parietal lobe to Wernicke’s area (Catani et al., 2005). The AF is the most prominent white matter fiber system implicated in language function because it appears to mediate the ability to understand words and sentences, verbalize thoughts, repeat spoken language and organize the semantic content of verbal memory by connecting cortical regions in the frontal, temporal, and parietal lobes (Catani et al., 2007; Dronkers et al., 2007; Catani and Mesulam, 2008; Rauschecker et al., 2008). The inferior longitudinal fasciculus (ILF) connects posterior occipitotemporal regions to anterior temporal regions and has been implicated in transmitting information about object, face and possibly even written words (Bauer and Trobe, 1984; Mandonnet et al., 2007; Catani and Mesulam, 2008; Epelbaum et al., 2008). The uncinate fasciculus (UF) connects anterior temporal lobe with the medial and lateral orbitofrontal cortex and may be responsible for transmitting information relating to memory, semantic language content, and confrontation naming (Lu et al., 2002; Rodrigo et al., 2007; Govindan et al., 2008).
The main purpose of this study was to identify with DTI tractography the AF, ILF, and UF in patients who underwent Wada testing in order to quantify the relationship between the fractional anisotropy of each tract and hemispheric dominance for language in epilepsy. To achieve this, we measured the hemispheric asymmetry of each of the three tracts by first computing a relative fiber density laterality index at progressively higher fractional anisotropy thresholds, and then comparing laterality indices at each level of anisotropy to Wada outcome. Once it was determined which of the three tracts correlated best with language laterality, the secondary objectives were to 1) determine the location of this tract’s terminations in standard space, and 2) to assess with logistic regression the predictive power of this tract alone and in conjunction with other variables - functional activation, handedness, sex, and hemispheric location of epileptic seizure focus - for lateralizing the language dominant hemisphere.
Methods
Patients
A total of 23 epilepsy patients underwent Wada testing, and then a separate imaging session. Patient characteristics are detailed in Table 1. The majority of the patients (17) had temporal lobe epilepsy. However, at our institution the Wada test is also administered to patients with non-lesional structural MRI whose seizure focus is localized later by way of intracranial electrode recordings. Therefore, our sample also included 4 patients who had a seizure onset zone localized to orbitofrontal cortex (2), the parieto-temporal area (1), peri-rolandic (2) and left hemisphere (1). Each patient provided written informed consent in accordance with the University of Texas Committee for the Protection of Human Subjects. Handedness was assessed using the Edinburgh Inventory (Oldfield, 1971).
Table 1. Patient Characteristics.
Each patient’s dominant hemisphere for language determined from Wada testing is listed, as well as their age at time of imaging, sex, handedness determined by the Edinburgh inventory, and the hemisphere in which their seizure focus was located.
| Patient | Wada Result | Age | Sex | Handedness | Seizure Focus |
|---|---|---|---|---|---|
| 1 | L | 18 | F | R | L |
| 2 | L | 24 | F | R | R |
| 3 | L | 60 | F | R | R |
| 4 | R | 45 | F | R | L |
| 5 | L | 30 | F | R | R |
| 6 | L | 28 | F | R | R |
| 7 | L | 36 | M | R | R |
| 8 | R | 35 | M | L | L |
| 9 | L | 34 | F | R | L |
| 10 | L | 23 | M | R | R |
| 11 | L | 30 | M | R | R |
| 12 | L | 20 | M | L | R |
| 13 | R | 43 | M | L | R |
| 14 | L | 26 | M | R | L |
| 15 | L | 55 | M | R | L |
| 16 | L | 30 | F | R | R |
| 17 | L | 20 | F | R | R |
| 18 | L | 35 | F | R | R |
| 19 | L | 34 | F | R | R |
| 20 | L | 47 | F | L | R |
| 21 | L | 47 | M | R | R |
| 22 | R | 40 | M | L | L |
| 23 | L | 37 | F | R | L |
Wada Testing
Wada testing was carried out using a standardized protocol for lateralizing language and memory function used at our institution. The details of this procedure, and results from a large sample of epilepsy patients have been published previously (Breier et al., 1999; Papanicolaou et al., 2004). In the present study, Wada outcome scores revealed that 19 patients were left-hemisphere dominant for language, 4 were right-hemisphere dominant, and none had bilateral representation of language function.
fMRI Language Tasks
A battery of covert language production tasks in visual and auditory domains was presented in a block design paradigm to assess hemispheric functional language lateralization during fMRI. These tasks are similar in concept to other studies of language (Salmelin et al., 1994; Hamberger et al., 2005; Ellis et al., 2006; Specht et al., 2008), but were developed in the investigators’ lab specifically for this and future studies of language in patients and healthy volunteers. Participants completed two runs each (136 volumes per run, 8 blocks of 20 secs TASK and 14 secs CONTROL) of the following production tasks: 1) common naming of line drawings (Snodgrass and Vanderwart, 1980) of everyday objects (i.e., see picture of pineapple, say “pineapple” to yourself), 2) proper naming of famous faces (i.e., see picture of Marilyn Monroe, say “Marilyn Monroe” to yourself), 3) action naming of pictures depicting actions (i.e., see picture of a baby crawling, say the verb “crawling” to yourself), 4) wordstem verb completion (i.e., see the stem “clea”, complete to make a verb and say to yourself “clean” or “clear”), and 5) auditory naming ( i.e., hear the auditory description “A crease in the skin from aging” and say “wrinkle” to yourself). During scanning, each visual or auditory stimulus was presented at the onset of a functional image volume acquisition using Presentation software (v.11, Neurobehavioral Systems Inc, Albany, CA). Visual stimuli were viewed by way of a screen positioned above their eyes, and auditory stimuli were heard through headphones (IFIS, Invivo Corp). During the TASK condition subjects were presented with the pictures or auditory descriptions for 1500 ms. Participants were instructed to say the name of the object to themselves without vocalization and press a button with the thumb of their right hand at the same time as successful covert naming. During the CONTROL condition subjects passively viewed scrambled versions of the visual stimuli, or a central fixation cross during the wordstem completion and auditory naming tasks.
Image Acquisition
All participants were scanned using a 3 tesla whole-body MR scanner (Philips Medical Systems, Bothell WA) equipped with an eight-channel SENSE head coil. High resolution T1-weighted anatomical images were collected using a magnetization-prepared 180 degree radio-frequency pulse and rapid gradient-echo sequence optimized for gray-white matter contrast with 1 mm thick sagittal slices and an in-plane resolution of 0.938 mm. Diffusion weighted images were collected with the Philips 32-direction diffusion encoding scheme (high angular resolution) with the gradient overplus option. One B0 (non-diffusion weighted) image volume was acquired before the acquisition of one repetition of diffusion-weighted scans. Seventy axial slices were acquired with a 224 × 224 FOV (1.75 × 1.75 mm pixels), 2mm slice thickness, and a maximum b-value of 800 sec/mm2. Functional images were obtained with a gradient-recalled echo-planar imaging sequence sensitive to the blood-oxygen level dependent (BOLD) signal. Thirty-three axial slices (3mm slice thickness, 2.75 in-plane resolution) were sampled (TE 30 ms, TR 2000 ms, flip angle 90 degrees).
Image Processing
Structural image processing and spatial transformations, and functional image realignment and statistical analyses were performed with AFNI (Cox, 1996). A brain extraction algorithm was used to remove the skull and scalp from the anatomical MRI, and a 12 parameter affine transformation to the T1-weighted MNI single-subject template was computed (Collins et al., 1994) and stored. Each fMRI volume was aligned to the skull-stripped anatomical MRI using a registration algorithm with a mutual information cost function and bicubic resampling. The magnitude of each patient’s translational and angular head movements was visually inspected by examining the output realignment parameters to exclude data corrupted by gross motion artifact. The aligned 4D dataset was spatially smoothed with a 3mm Gaussian filter, and an omnibus F ratio and corresponding probability value for all naming vs. baseline task epochs was computed at each voxel timeseries by multiple regression. Individual diffusion-weighted images volumes were realigned to the subject’s skull-stripped anatomical MRI, and a single-model diffusion tensor was computed using a gradient table computed with DTI_gradient_table_creator software provided by Jonathan A.D. Farrell (Johns Hopkins University, Baltimore, Maryland USA). The resolution of the output realigned diffusion-weighted volumes (1.75×1.75×2.00mm) was preserved for the purposes of computing the set of whole-brain tractography pathways and also for selected fiber tract identification. The reliability of calculated fiber tracks was preserved by computing tractography pathways in native imaging space, not Talairach space. To compare the location of fiber pathway terminations across patients (Fig. 4), summary tract maps thresholded by pathway anisotropy (where each voxel value represents the number of pathways passing through that imaging element) were placed into standard space by applying the transform computed from spatial normalization of the skull-stripped T1 anatomical to the MNI template. After each tract summary map was placed in MNI space, the number of patients with high anisotropy AF pathways at each voxel location was calculated via binary summation.
Figure 4. The Highest Anisotropy Arcuate Fasciculus Pathways Terminate Near Middle Temporal Gyrus.

For 19 left Wada patients, an image volume mask of the highest anisotropy (strongest 10%) AF pathways were transformed to standard space, and summed to create a single volume where each voxel value equaled the number of subjects sharing pathways at that location. This volume was thresholded (dark red=at least 6 subjects had common AF pathways, yellow=all subjects had common pathways) and displayed on a reconstruction of the left (a) and right (b) hemisphere white/gray matter border of the MNI N27 single-subject brain. The high anisotropy AF pathways were located disproportionately within the dominant hemisphere connecting Broca’s area (BA 44) to the middle temporal gyrus. Sagittal (c), coronal (d), and axial (e) orthogonal views are also shown with the crosshairs located near the posterior AF terminations at x=−46, y=−43, z=−7 mm (MNI brain coordinates).
Tractography & Temporal Lobe Pathway Identification
Deterministic fiber tracking was performed with DTIQuery v1.1 using the streamline tracking algorithm (STT) with optimal parameters (Basser et al., 2000; Akers et al., 2004; Sherbondy et al., 2005), which were set to: path step size (mm) = 1.0, seed point spacing (mm) = 2.0, FA termination threshold = 0.15, angle termination threshold (deg) = 45, min pathway length (mm) = 5.0, and max pathway length (mm) = 300.0, and Euler’s Method for STT numerical integration. A two region-of-interest (Catani et al., 2002) approach referenced to two atlases (Mori et al., 2005; Catani and Thiebaut de Schotten, 2008) was used to guide delineation of ROIs. Individual white matter pathways comprising the AF, UF, and ILF were identified in each subject’s native image space. A representation of each isolated pathways for a single subject is shown in Figure 2b.
Figure 2. High Anisotropy Arcuate Fasciculus Pathway Density is Asymmetric.

(a) Laterality indices computed from the upper quartile and decile of the arcuate fasciculus (AF) pathway FA distribution are significantly different from zero (* two-tailed t-test corrected for multiple comparisons) for the dominant hemisphere as determined by Wada testing, but are not significantly different for the inferior longitudinal fasciculus (ILF) or uncinate fasciculus (UF). (b) A sample from one patient showing the arcuate (green), uncinate (blue), and inferior longitudinal (yellow) fasciculus. Each of these three tracts has at least one large group of terminations in the temporal lobe with the UF and ILF terminating in anterior temporal lobe and AF terminating more posterior.
The ILF (Fig. 2b, yellow) was found in each hemisphere by identifying the sagittal stratum on a coronal slice near the retrolenticular part of the internal capsule, placing two ROIs at opposite ends of this white matter bundle - one in the occipital lobe and one in the anterior temporal lobe – and isolating pathways passing through the two ROIs with an AND operator. In some cases, additional regions of interest needed to be placed and intersecting pathways excluded with NOT operators to exclude nearby interior fronto-occipital fasciclus pathways. The UF (Fig. 2b, blue) was found in each hemisphere by placing two ROIs – one in the anterior temporal lobe including the anterior hippocampal formation and one in the orbitofrontal cortex of the ventral frontal lobe - and isolating pathways passing through the two ROIs with an AND operator. It was noted in multiple subjects that the terminations of the ILF in the anterior temporal lobe often overlapped or terminated proximal to the temporal lobe terminations of the UF, as can be seen by the spatial overlap of blue and yellow pathways in Fig 1.
Figure 1. Laterality Index Magnitude Changes as a Function of Pathway Anisotropy.
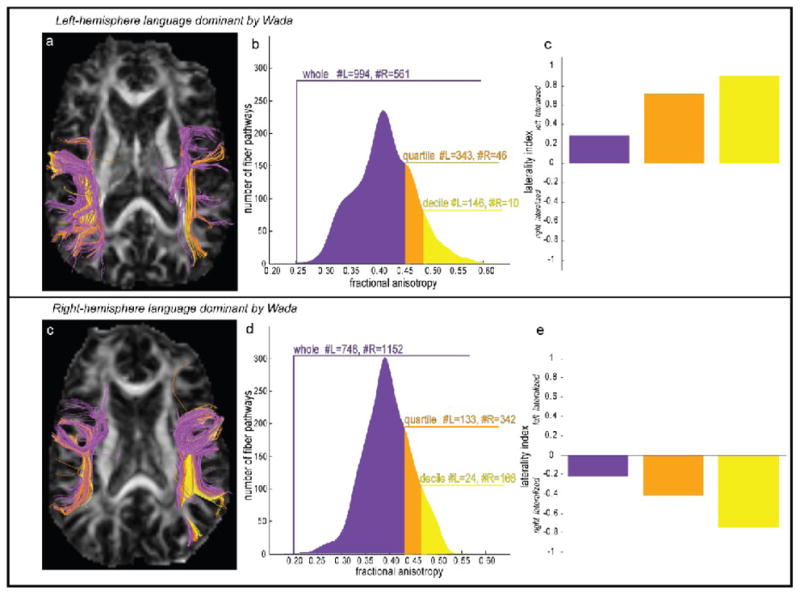
Individual tractography pathways are colored for a left Wada patient (a) and a right Wada patient (b) according to whether the average fractional anisotropy (FA) of intersected voxels was in the upper decile (yellow), quartile (orange), or whole (purple) portion of the entire pathway FA distribution. Separate laterality indices (c,e) were computed as the ratio (L−R/L+R) of the number of left and right hemisphere pathways in the whole, quartile, and decile of each patient’s pathway FA distribution (b,d).
The AF (Fig. 2b, green) was identified in each hemisphere by placing two ROIs – one encompassing Broca’s area (ROI 1) and one in the white matter bundle superolateral to the insula (ROI 2). Broca’s area was defined by a mask in each subject’s native imaging space created by inverse transformation of probabilistic cytoarchitectonic representation of Brodmann’s areas 44 and 45 (Amunts et al., 1999; Eickhoff et al., 2005). The mask for ROI 1 served to isolate all pathways connecting Broca’s area to all other brain areas. Placement of ROI 2 isolated only pathways from ROI 1 that connect Broca’s area with the parietal or temporal, lobe. Since tractography pathways were computed in native subject imaging space to maintain fiber tracking integrity, which may have otherwise been compromised by transformation of individual diffusion volumes to standard space, a different-sized ROI 2 was used for each subject and each hemisphere. The center of ROI 2 was placed according to standard neuroanatomical criteria (Mori et al., 2005) in order to isolate pathways belonging to the superior longitudinal fasciculus that pass primarily in an anterior-posterior direction. ROI 2 was centered posterior to ROI 1, superior to the insula, lateral to the putamen, and lateral to an adjacent bundle of pathways belonging to the superior thalamic radiation, corticospinal tract, and corticopontine tracts that unambiguously run primarily in a inferior-superior orientation. Depending on individual patient brain anatomy, the extent of ROI 2 was adjusted interactively while yoked with an AND operator to ROI 1 in order to maximize the number of pathways (and thereby minimize false negatives) connecting Broca’s area with parietal or temporal lobes.
Consideration of pathways passing through both of these ROIs included two previously documented components of the AF, a direct segment linking Broca’s Area with Wernicke’s Area, as well as a segment linking Broca’s area with Geschwind’s territory (Catani et al., 2005). Since the Wada procedure tends to affect expressive language in most patients and this study employed productive language tasks where fMRI activity in Broca’s area correlates strongest (r=0.94) with Wada outcome (Chlebus et al., 2007), we hypothesized that language dominance could be inferred based on asymmetry of temporal and parietal white matter connections with Broca’s Area. Therefore, we did not include the posterior indirect component of the AF that connects temporal and parietal regions.
Structural & Functional Laterality Index Computation
Structural and functional laterality indices were computed for each subject by way of a histogram threshold method. The motivation for employing this approach was to avoid choosing an arbitrary level of fractional anisotropy, in the case of DTI tractography, or F ratio, in the case of functional activation, and computing laterality scores relative to an optimal threshold magnitude that may vary considerably with respect to a non-normal distribution of values. Additionally, this approach fits with our hypothesis that specific pathways with high anisotropy characteristics may exist in the dominant hemisphere to mediate fluent language function. After the set of whole brain tractography pathways was reconstructed and the three temporal lobe tracts were isolated in native imaging space, structural laterality indices for each patient were computed based on the asymmetry in the numbers of pathway streamlines in the left and right hemispheres at progressively higher FA thresholds. Laterality indices were also computed based on the asymmetry in volume of the pathways but this did not change any of the results. The specifics of the structural laterality index computation were: First, a strength value was assigned to each pathway by taking the mean of the FA values in all voxels that each pathway intersected. Then, a histogram was constructed from each tract’s set of bilateral pathway strengths, and FA ranges for the upper decile (10%), quartile (25%) and whole (100%) histogram were used to determine the number of pathways in each hemisphere. An illustration of this method for computing laterality is shown for the AF in a left and a right Wada patient in Figure 1. For the left Wada patient (Fig 1a–c), the whole histogram (purple) includes 994 left hemisphere AF pathways, and 561 right hemisphere AF pathways. The laterality index computed as (#L−#R)/(#L+#R) is +0.28, which indicates a greater proportion of pathways in the left hemisphere, thereby correctly classifying the patient as left hemisphere dominant for language function according to the Wada outcome. When proportions of pathways in the upper quartile (orange) and decile (yellow) of the pathway strength range are considered (Fig 1b), the laterality index magnitude increases in the positive direction indicating that the proportion of pathways with higher fractional anisotropy values is greater. The opposite pattern is shown for a right Wada patient (Fig 1c–e), who has a higher proportion of pathways in the right hemisphere indicated by a negative laterality index, and who was classified as right hemisphere dominant for language by Wada testing. The biological significance of the structural laterality index is that non-zero values indicate a greater intra-hemispheric proportion of tract-specific white matter reflecting increased myelination or axonal coherence or a combination of both. Since we did not systematically investigate changes in parallel or perpendicular diffusivity, nor did we evaluate the sum of the eigenvalues (trace), no inference can be made about the independent contributions of myelination or axonal coherence to the structural laterality indices.
An equivalent histogram threshold approach was used to compute functional laterality indices from the language tasks performed in the fMRI scanner. To build functional activation histograms, an F-ratio volume for the task effects of interest (all five language production tasks), which explicitly excluded variance due to linear signal drift across runs or spin history effects due to subject movement, was computed using the multiple regression function in AFNI (3dDeconvolve). Significant F-ratios (thresholded at p<0.0001, Bonferroni corrected by number of voxels) were extracted from voxels within an area defined by the mask of each patient’s probabilistic Broca’s area and a homologous region in the non-dominant hemisphere. Laterality indices were computed from the number of suprathreshold voxels (#L−#R)/(#L+#R) within the whole, upper quartile, and upper decile ranges of the functional activation histogram. This approach is similar in principle to computing a lateralization index based on extent of activation at increasing statistical threshold (Jansen et al., 2006) as the decile range of each patient’s functional activation histogram includes voxels with higher statistical values than the quartile or whole histogram.
For both structural and functional laterality indices, a classification of bilateral dominance was assigned if the computed index equaled zero. Left dominance was assigned if the index was positive, and right dominance was assigned if the index was negative.
Assessment of Predictive Power
Binary logistic regression was performed in SPSS (v13) with Wada outcome (left or right) as the dependent variable, and handedness (left or right), sex (male or female), location of seizure onset (left or right hemisphere), fMRI laterality computed from the upper decile of the activity histogram (positive=left hemisphere, negative=right hemisphere, 0=bilateral), and DTI laterality computed from the upper decile of the AF pathway strength histogram (positive=left hemisphere, negative=right hemisphere, 0=bilateral) as independent predictor variables. The block entry method was used to assess predictive power by computing an odds ratio and associated probability value for how well each independent variable separately predicted Wada outcome, and how sets of multiple independent variables (e.g., handedness + fMRI laterality + DTI laterality) jointly predicted Wada outcome.
Results
Density Asymmetry of Temporal Lobe Pathways
For each patient’s AF, ILF, and UF, a laterality index was computed based on the numbers of left and right hemisphere pathways within the upper decile, upper quartile, and whole histogram of pathway anisotropy strengths. Two-tailed paired t-tests were used to test the null hypothesis that the laterality index magnitude computed from different ranges of the histogram was zero. To maintain the family-wise error rate of 1%, a correction for multiple comparisons (0.01/9=0.001) was used based on the number of sets of tracts (three) and the number of histogram levels (three). The null hypothesis was rejected for the upper quartile (L.I. = 0.4291 +/−0.0856, t(22)=5.11, p=0.00004) and upper decile (L.I. = 0.5203 +/−0.1170, t(22)=4.55, p=0.0002) of the AF pathways (Figure 2a), indicating that hemispheric asymmetry of high anisotropy AF pathways was significantly lateralized to the dominant hemisphere as determined by the Wada test. Tests of laterality magnitude based on UF and ILF pathways failed to reach significance at each of the three histogram levels.
Structural and Functional Laterality Index Comparison
Functional laterality indices were computed from asymmetry of suprathreshold activated voxels within Broca’s area during the covert fMRI language production tasks. Functional laterality indices based on activity in this region has been shown previously to covary most strongly (r=0.94) with Wada outcome (Chlebus et al., 2007). Average functional L.I. magnitude was significantly different from zero when considering the whole histogram of suprathreshold voxels, as well as the upper quartile and decile of the histogram (p<0.01, corrected for multiple comparisons). A comparison of the ability of the functional and the structural L.I.s to classify patients according to their Wada outcome was made by considering an individual L.I. as correctly classifying the dominant hemisphere if it was greater than 0 for left hemisphere Wada outcome, and less than zero for right hemisphere Wada outcome. Laterality indices from the upper decile AF pathways were used for classifying laterality based on structure since these pathways resulted in the highest average laterality magnitude (0.5203 +/−0.1170), and laterality indices from the upper decile suprathreshold fMRI activation were used for classifying laterality based on function (average laterality magnitude=0.6948 +/−0.1282). Using these criteria, laterality based on sub-cortical structure classified 19 of 23 (82.60%) patients correctly (Fig. 3a), while laterality based on functional activation classified 20 of 23 (86.95%) patients correctly (Fig. 3b). A comparison of structure and function laterality scores is depicted in Fig. 3c. Of the three patients misclassified by function, two had left Wada scores. Of the four patients misclassified by structure, one had a right Wada outcome and three had left Wada outcomes.
Figure 3. Agreement of Structural and Functional Laterality Estimates with Wada Outcome.

(a) DTI laterality indices determined by asymmetry of the highest decile AF pathways are shown, as well as (b) fMRI laterality indices determined from asymmetry in Broca’s area suprathreshold activation. Left hemisphere Wada patients are represented by circles, and right hemisphere Wada patients are represented by squares. Circles and squares are colored green if laterality indices classify the dominant hemisphere according to Wada outcome, and red if classification is opposite to Wada outcome. (c) Each patient’s DTI laterality index is plotted against their fMRI laterality index. If all patients were classified perfectly according to both structure and function, all squares (right Wada) would cluster in the lower left quadrant, and all circles (left Wada) would cluster in the upper right quadrant.
Hemispheric Asymmetry of High Anisotropy AF Pathways
The spatial asymmetry of the high anisotropy AF pathways (top 10%) was visualized by expressing the 3D coordinates of each pathway’s vertices as an image, and transforming the image to standard space using the previously computed matrix relating the T1-weighted anatomical to the MNI template. Individual images from the 19 patients who were left hemisphere dominant for language according to Wada testing were analyzed on a voxel-by-voxel basis, and a composite map was constructed with an integer value assigned at each location indicating the number of patients with at least one pathway termination. The composite map was thresholded (n>3), and clusters of pathway terminations were visualized with respect to the white/gray matter surface built from the MNI single-subject brain (Figure 4a–b). The highest anisotropy AF pathways were found to connect Broca’s area (BA 44) to the middle temporal gyrus (MTG). The cluster location of posterior pathway terminations in MTG was located at approximately x=−46, y=−43, z=−7 (MNI brain coordinates, Figure 4c–e). Images of high anisotropy AF pathways in standard space were created for the four right Wada patients. A thresholded version of the composite group map for these subjects did not reveal meaningful clusters of terminations because the small sample size (n=4) did not allow for adequate statistical power. Instead, clusters of pathway terminations were examined for each of the right Wada patients individually. Three of the four right Wada patients had a greater proportion of high anisotropy pathways in their dominant hemisphere. Patient 4 was found to have the highest anisotropy pathways terminating posteriorly at coordinate location x=+41, y=−58, z=+20 near the right angular gyrus. Patient 8 was found to have the highest anisotropy pathways terminating at coordinate x=+46, y=−44, z=+33 in right supramarginal gyrus. Patient 13 was the lone outlier of the right Wada group, showing no high anisotropy AF pathways in the dominant right hemisphere. Patient 22, the last of the right Wada subjects studied, was found to have the highest anisotropy pathways terminating at coordinate x=+44, y=−39, z=+20 near the right superior temporal gyrus.
Predictors of Wada Outcome
Binary logistic regression was used to determine which variables were significant predictors of Wada outcome. Logistic regression allowed for rejection of the null hypothesis that a particular variable classified a patient at chance levels as either left or right hemisphere dominant for language based on Wada outcome. The predictive power of five variables was independently assessed including 1) laterality based on the high anisotropy AF pathways, 2) laterality from BOLD activity in Broca’s area during the fMRI language tasks, 3) handedness assessed by the Edinburgh questionnaire, 4) hemispheric location of seizure focus, and 5) the patient’s sex. After a multiple comparison correction for the five independent tests (p=0.01/5), three variables were found to have significant independent predictive power for determining Wada outcome. These included the Broca’s area fMRI activity (p<0.001, odds ratio=12.6), handedness (p<0.001, odds ratio=12.6), and the high anisotropy AF pathways (p=0.002, odds ratio=9.8). The seizure focus location was marginally significant (p=0.022, odds ratio=5.3) but did not survive the multiple comparisons threshold of p<0.002. Patients’ sex did not have any significant predictive power (p=0.144, odds ratio=2.1). Given that laterality based on fMRI, DTI, and handedness each had significant independent predictive power for determining Wada outcome, a test of predictive power based on a model using all three variables was justified. This model correctly classified the dominant hemisphere in 22 of 23 (95.6%) patients based on Wada outcome (Table 2).
Table 2. Accuracy of Different Binary Logistic Regression Models.
Multiple binary logistic regressions were computed to test how successful different combinations of independent variables (column 1) were able to classify the dominant hemisphere for language according to Wada outcome. Overall accuracy is given (column 2), as well as performance for left (column 3) and right (column 4) Wada patients.
| Predictor(s) in Model | Overall Accuracy | L Wada Accuracy | R Wada Accuracy |
|---|---|---|---|
| DTI | 19 of 23 | 16 of 19 | 3 of 4 |
| fMRI | 20 of 23 | 17 of 19 | 3 of 4 |
| Handedness | 20 of 23 | 17 of 19 | 3 of 4 |
| DTI + fMRI | 20 of 23 | 17 of 19 | 3 of 4 |
| DTI + Handedness | 20 of 23 | 17 of 19 | 3 of 4 |
| fMRI + Handedness | 21 of 23 | 19 of 19 | 2 of 4 |
| DTI + fMRI + Handedness | 22 of 23 | 18 of 19 | 4 of 4 |
Discussion
We sought to determine whether DTI tractography could be used to predict the dominant hemisphere for language by analyzing hemispheric asymmetry in relative fiber density of three white matter tracts with terminations in the temporal lobe. We addressed this question in a group of patients whose language laterality was confirmed and found to be represented in either the left or right hemisphere using the accepted standard - the Wada procedure.
Three temporal lobe fiber tracts – AF, ILF, and UF - were identified in both hemispheres of each patient using deterministic DTI tractography. For each fiber system, structural laterality indices were computed from the relative proportion of pathway numbers in each hemisphere. The structural laterality indices were computed based on all pathways comprising a tract, and for the highest 25% and 10% of pathways determined from individual within-subject histograms of fractional anisotropy integrated over each pathway. Our principal and novel finding is that, in epilepsy patients, the language dominant hemisphere contains significantly more high anisotropy AF pathways than the non-dominant hemisphere, and that laterality indices based simply on these high anisotropy pathways classifies the dominant hemisphere in the vast majority of these patients. It is important to note the DTI laterality indices were inconclusive (Fig 3a) for at least two patients (with low laterality index magnitude, but correct sign). On the other hand, fMRI appeared to strongly lateralize all subjects (with three classified incorrectly, Fig 3b). A close evaluation of the imaging data on six patients who were misclassified by either structure or function, but who were ultimately classified correctly when handedness information was added to the logistic regression model, was performed to evaluate the possibility of misclassification due to poor data quality. Excessive subject movement (>5 mm) may have slightly degraded two fMRI datasets. Inspection of DTI datasets showed consistency of laterality index sign as a function of increasing anisotropy threshold in all but one patient. The pattern of slightly better classification by fMRI compared to DTI raises the important clinical point that when fMRI data can be collected during language tasks, they may be slightly better than DTI of the AF for determining laterality. However, when fMRI acquisition is not available in patients who are claustrophobic or otherwise not able to perform tasks in the scanner, a laterality index based on high anisotropy AF pathways is a useful measure. Furthermore, a combined laterality estimate using DTI, fMRI, and handedness is more accurate than any single measure. This raises two important questions. First, what does the existence of more high anisotropy pathways mean for how language is organized in the dominant hemisphere, and second, what is the functional role of the brain areas that the high anisotropy pathways may connect?
Previous studies have pointed out that the corpus callosum, the corticospinal tract, the geniculo-striate fiber system, and the AF contain some of the highest anisotropy pathways in the human brain (Mori et al., 2005; Behrens et al., 2006; Tandon et al., 2007). In the present study, it was found that AF pathways with mean FA greater than 0.5322 (+/−0.0272) are distributed disproportionately within the dominant hemisphere for language. The precise biological variables contributing to fractional anisotropy magnitude (Beaulieu, 2002) are not well characterized yet, but evidence suggests that myelination increases anisotropy (Wimberger et al., 1995) while demyelination reduces anisotropy (Schmierer et al., 2007). There is a documented complex relationship between the degree of myelination and the speed of nerve conduction (Waxman, 1980; Reutskiy et al., 2003), and more recent studies have found a relationship between increased FA values and reaction times during speeded choice tasks (Madden et al., 2004; Tuch et al., 2005; Gold et al., 2007). It is also possible that increased FA represents not an increase in myelination, but increased density and orientation coherence of axons (Song et al., 2003). The presence of either factor – increased myelin or increased axonal density – is compatible with the notion that a disproportionate number of high anisotropy AF pathways in the dominant language hemisphere may support and indeed be crucial for the rapid transmission of linguistic information between frontal and temporal cortical areas. Recent developmental neurobiological studies using DTI have begun to shed light on how maturation of white matter bundles are related to the development of later functional lateralization (Ashtari et al., 2007; Dubois et al., 2008), but it is still too early to say how changes in myelin and axonal coherence contribute independently to the developmental lateralization of the AF.
A group analysis was performed on the tractography results of this study’s participants to determine the loci of termination sites of the highly anisotropic component of the AF. The frontal terminations were primarily located in the posterior portion of Broca’s area, i.e. more BA44 than BA45. The temporal lobe terminations were found to cluster primarily around middle temporal gyrus (MTG). This finding is broadly consistent with prior tractography studies describing the spatial characteristics of the AF. It fits well with pathways first detailed by tractography to support traditional models of distributed language processes (Catani et al., 2005) in Broca’s and Wernicke’s areas directly. A more recent study (Glasser and Rilling, 2008) revealed two subcomponents of the AF. Both subcomponents terminate anteriorly in frontal lobe near BA44, but one terminates posteriorly near superior temporal gyrus (STG) and the second terminates posteriorly near MTG. Terminations near STG overlap with phonological activity while terminations near MTG overlap with lexical-semantic activity as localized by functional imaging studies. This suggests that the high anisotropy pathways that correlate strongly with hemispheric dominance for language may be more involved with lexical-semantic aspects of language rather than the phonological processes, although follow-up studies will be required to test this hypothesis since in our experiments we did not administer fMRI tasks designed to parse phonological from lexical-semantic processing.
An initial prediction of the present study was that white matter asymmetry predictive of Wada outcome would be mirror-reversed in the right vs. left hemisphere dominant patients, consistent with previous reports of a mirror configuration of function in atypical dominant patients (Duffau et al., 2008). While it was found that a greater number of high anisotropy AF pathways occurred in the left hemisphere in the majority of left Wada patients, and a greater number of high anisotropy AF pathways occurred in the right hemisphere of the right Wada patients, the posterior terminations were located more superiorly and posteriorly in the right relative to the left Wada patients. However, an appropriately powered statistical comparison of this posterior termination difference will be dependent on acquiring more data from patients with language represented in the right hemisphere, a subject pool that is exceedingly rare and will take more time to accumulate both imaging and Wada results.
Another finding of the present study is that a DTI laterality measure based on hemispheric asymmetry in the distribution of high anisotropy AF pathways adds significant predictive power to determining Wada outcome. This means that in the absence of any information about the patient, including even handedness, DTI data may be used to infer laterality based on a putative measure of structural connectivity. Considered separately, information about handedness and information about functional BOLD activation in Broca’s Area each adds significant predictive power to laterality judgments. But neither the AF DTI laterality score, the Broca’s area fMRI laterality score, nor handedness information alone is able to predict laterality in all of the 23 patients studied. However, a logistic regression model incorporating all three of these predictors classified 22 of 23 patients correctly. The finding that these variables considered together may be able to determine laterality is important as it shows that joint consideration of multiple non-invasive measures accurately predicts the outcome of the invasive Wada assessment of laterality.
A negative finding of the present study is that, on average, asymmetry of UF and ILF appeared unrelated to hemispheric language dominance, although LI magnitude based on high anisotropy ILF pathways trended toward being significant (Fig 2a). Little is known about how these pathways subserve language production. It was thought based on neuroimaging evidence that the ILF could be part of a network for conveying the visual aspects of semantic information. A recent intraoperative study failed to find a significant effect of direct ILF stimulation, but did find deficits related to stimulation of the inferior occipitofrontal fasciculus (Mandonnet et al., 2007). As for the UF, which has been implicated in confrontation naming, it is worth noting that a recent DTI study has found evidence that changes in left UF diffusion parameters correlates with verbal memory deficits (McDonald et al., 2008). Clearly, more research with larger sample sizes is needed before definitive statements about how the ILF and UF are involved in language processing can be made.
Limitations of the Study
From a technical perspective, use of the tensor model in the present study is limited in that it cannot accurately model crossing fibers. Fortunately for this study the focus was on tracts which are not particularly susceptible to the problem of crossing fibers (as opposed to say the corona radiata) and we excluded confounding pathways using additional regions and NOT operators. Yet it is important to note that other procedures, including spherical deconvolution (Tournier et al., 2007) and Q-ball (Tuch, 2004) may be better at dealing with these confounds, and future investigations should employ these methods to ensure accurate modeling of fiber trajectories. Distortions induced by eddy currents have been reported in SENSE DTI acquisitions (Truong et al., 2008), and several retrospective correction procedures have been proposed (Bodammer et al., 2004; Papadakis et al., 2005; Chen et al., 2006; Mistry and Hsu, 2006; Bar-Shir and Cohen, 2008). To minimize these distortions and correct for subject motion, we aligned individual diffusion weighted volumes using an affine transform with a mutual information cost function. A correction of gradient directions based on angular motion correction parameters has recently been shown to be important before tractography pathway computation (Leemans and Jones, 2009). We did not implement this correction in the analysis of each patient’s dataset, but average angular motion (degrees) across the sample was small [mean (+/− std) of the three rotational parameters was x=0.46 (0.25), y=0.91 (0.64), z=0.55 (0.34)], and application of the correction on the patient who exhibited the most angular motion (x=0.34, y=2.67, z=0.78) did not change the sign of the LI (+0.95 with correction vs. +0.75 without correction) based on high anisotropy pathways of the AF.
Another limitation of this study is that, since it is not possible to administer the Wada procedure to healthy controls, one cannot say conclusively that asymmetry in highly anisotropic AF pathways are predictive of language laterality in the normal population. It is probable that the microstructure of the hemisphere with the seizure focus will be affected by the epilepsy, and it is documented that language lateralization can be affected by epilepsy (Adcock et al., 2003; Brazdil et al., 2003). As long as epilepsy-related hemispheric asymmetry cannot be distinguished from the hemispheric asymmetry related to language, then generalization of these results to healthy subjects cannot be made. We also note that previous studies investigating laterality in healthy subjects observed a correlation between fMRI and DTI lateralization indices, at least for right-handed subjects (Powell et al., 2006; Vernooij et al., 2007). We found a weak but non-significant positive correlation (r=0.15, p=0.51) between LIs based on fMRI and LIs computed from high anisotropy AF pathways. One reason that this correlation did not reach significance may be that several of the fMRI LIs were 1.0, indicating that there was no activity in the non-dominant hemisphere at high statistical thresholds, whereas the DTI LIs tended to fall within a more variable range below ceiling. The absence of this correlation could be caused by the methodological issues addressed previously or by the LIs being driven more by left-right differences caused by patients’ epilepsy than by neural substrates of language lateralization. However, in our logistic regression analysis the predictive power of seizure onset location in determining laterality was not significant, suggesting that pathology did not play a major role in discerning the language dominant hemisphere. Another limitation of the present study is that we did not assess white matter asymmetry in any patients who were found to have bi-hemispheric language dominance. Therefore, it is not known how high anisotropy AF pathways may be distributed in bilateral language dominant subjects. It is worth noting that in a study of healthy volunteers, higher performance on verbal recall measures correlated with symmetry in the AF (Catani et al., 2007). One prediction that follows from this observation is that patients with bilateral language representation may have more symmetrical white matter fiber systems, and this prediction may be tested in future imaging correlations with Wada outcome.
Summary & Conclusion
We have identified a subcomponent of a now well-established fiber tract connecting the frontal and temporal lobes that contains high anisotropy pathways with terminations near BA44 and MTG. Anisotropy asymmetry in this tract correlates well with the accepted standard measure of hemispheric dominance. Transient lesions induced by way of intra-operative subcortical stimulation in patients (Duffau, 2008; Ellmore et al., 2009) and transcranial magnetic stimulation in healthy controls (Devlin and Watkins, 2007) may shed light on the exact functional role this fiber system plays in fluent language processes. Additionally, it is possible that these results may help to determine laterality in situations where the Wada procedure is considered invasive, costly, and risky, and where functional imaging is not possible due to poor patient co-operation or claustrophobia.
Acknowledgments
Funding
This project was supported by the Epilepsy Foundation through the generous support of the Gertrude A. Sergievsky Research Endowment (2008 Behavioral Sciences Post-Doctoral Fellowship to T.M.E.), the Vivian L. Smith Foundation for Neurological Research, and a pilot project award (P.I.–N.T.) from the Center for Clinical and Translational Sciences, which is funded by Grant Number UL1RR024148 from the National Center for Research Resources of the National Institutes of Health. Partial funding for the purchase of the Philips 3T scanner used to collect the imaging data was provided by NIH S10 RR19186.
The content is solely the responsibility of the authors and does not necessarily represent the official views of the National Center for Research Resources or the National Institutes of Health. We thank Anthony Sherbondy for expert advice, Vipulkumar S. Patel for collecting the MRI data, R.T. Funk for help with data collection, Stephen Dreyer for help with gradient table computation, Tony Ro for help with tractography, Daniel Glen for help using the AFNI diffusion imaging analysis functions, David Akers for help using DTIQuery, and Donald Tournier and Yuxiang Zhou for expert advice on imaging physics.
Footnotes
Author Contributions: T.M.E., M.S.B., J.I.B., J.D.S., G.P.K., and N.T. developed the ideas for the experiments. J.D.S. and G.P.K. referred the patients. J.I.B. conducted neuropsychological testing. T.O. programmed the fMRI language tasks. T.M.E, T.O., and M.A.D. collected the imaging data. T.M.E. and M.A.D. analyzed the imaging data. T.M.E. and N.T. wrote the manuscript.
Publisher's Disclaimer: This is a PDF file of an unedited manuscript that has been accepted for publication. As a service to our customers we are providing this early version of the manuscript. The manuscript will undergo copyediting, typesetting, and review of the resulting proof before it is published in its final citable form. Please note that during the production process errors may be discovered which could affect the content, and all legal disclaimers that apply to the journal pertain.
References
- Adcock JE, Wise RG, Oxbury JM, Oxbury SM, Matthews PM. Quantitative fMRI assessment of the differences in lateralization of language-related brain activation in patients with temporal lobe epilepsy. Neuroimage. 2003;18:423–438. doi: 10.1016/s1053-8119(02)00013-7. [DOI] [PubMed] [Google Scholar]
- Akers D, Sherbondy A, Mackenzie R, Dougherty R, Wandell B. Exploration of the Brain’s White Matter Pathways with Dynamic Queries. Proceedings of IEEE Visualization. 2004:377–384. doi: 10.1109/TVCG.2005.59. [DOI] [PubMed] [Google Scholar]
- Amunts K, Schleicher A, Burgel U, Mohlberg H, Uylings HB, Zilles K. Broca’s region revisited: cytoarchitecture and intersubject variability. J Comp Neurol. 1999;412:319–341. doi: 10.1002/(sici)1096-9861(19990920)412:2<319::aid-cne10>3.0.co;2-7. [DOI] [PubMed] [Google Scholar]
- Ashtari M, Cervellione KL, Hasan KM, Wu J, McIlree C, Kester H, Ardekani BA, Roofeh D, Szeszko PR, Kumra S. White matter development during late adolescence in healthy males: a cross-sectional diffusion tensor imaging study. Neuroimage. 2007;35:501–510. doi: 10.1016/j.neuroimage.2006.10.047. [DOI] [PubMed] [Google Scholar]
- Bar-Shir A, Cohen Y. Crossing fibers, diffractions and nonhomogeneous magnetic field: correction of artifacts by bipolar gradient pulses. Magn Reson Imaging. 2008;26:801–808. doi: 10.1016/j.mri.2008.01.051. [DOI] [PubMed] [Google Scholar]
- Basser PJ, Mattiello J, LeBihan D. MR diffusion tensor spectroscopy and imaging. Biophys J. 1994;66:259–267. doi: 10.1016/S0006-3495(94)80775-1. [DOI] [PMC free article] [PubMed] [Google Scholar]
- Basser PJ, Pajevic S, Pierpaoli C, Duda J, Aldroubi A. In vivo fiber tractography using DT-MRI data. Magn Reson Med. 2000;44:625–632. doi: 10.1002/1522-2594(200010)44:4<625::aid-mrm17>3.0.co;2-o. [DOI] [PubMed] [Google Scholar]
- Bauer RM, Trobe JD. Visual memory and perceptual impairments in prosopagnosia. J Clin Neuroophthalmol. 1984;4:39–46. doi: 10.3109/01658108409019494. [DOI] [PubMed] [Google Scholar]
- Beaulieu C. The basis of anisotropic water diffusion in the nervous system - a technical review. NMR Biomed. 2002;15:435–455. doi: 10.1002/nbm.782. [DOI] [PubMed] [Google Scholar]
- Behrens T, Woolrich M, Johansen-Berg H, Pinsk M, Richter W, Richter M, Gross C, Kastner S, Robson M, Rilling J. Relative contribution of motor and association fibers to white matter underlying motor cortex in human and macaque. Proc Intl Soc Mag Reson Med. 2006:441. [Google Scholar]
- Benke T, Koylu B, Visani P, Karner E, Brenneis C, Bartha L, Trinka E, Trieb T, Felber S, Bauer G, Chemelli A, Willmes K. Language lateralization in temporal lobe epilepsy: a comparison between fMRI and the Wada Test. Epilepsia. 2006;47:1308–1319. doi: 10.1111/j.1528-1167.2006.00549.x. [DOI] [PubMed] [Google Scholar]
- Binder J. Functional magnetic resonance imaging. Language mapping. Neurosurg Clin N Am. 1997;8:383–392. [PubMed] [Google Scholar]
- Binder JR, Swanson SJ, Hammeke TA, Morris GL, Mueller WM, Fischer M, Benbadis S, Frost JA, Rao SM, Haughton VM. Determination of language dominance using functional MRI: a comparison with the Wada test. Neurology. 1996;46:978–984. doi: 10.1212/wnl.46.4.978. [DOI] [PubMed] [Google Scholar]
- Bodammer N, Kaufmann J, Kanowski M, Tempelmann C. Eddy current correction in diffusion-weighted imaging using pairs of images acquired with opposite diffusion gradient polarity. Magn Reson Med. 2004;51:188–193. doi: 10.1002/mrm.10690. [DOI] [PubMed] [Google Scholar]
- Brazdil M, Zakopcan J, Kuba R, Fanfrdlova Z, Rektor I. Atypical hemispheric language dominance in left temporal lobe epilepsy as a result of the reorganization of language functions. Epilepsy Behav. 2003;4:414–419. doi: 10.1016/s1525-5050(03)00119-7. [DOI] [PubMed] [Google Scholar]
- Breier JI, Simos PG, Zouridakis G, Wheless JW, Willmore LJ, Constantinou JE, Maggio WW, Papanicolaou AC. Language dominance determined by magnetic source imaging: a comparison with the Wada procedure. Neurology. 1999;53:938–945. doi: 10.1212/wnl.53.5.938. [DOI] [PubMed] [Google Scholar]
- Catani M, Allin MP, Husain M, Pugliese L, Mesulam MM, Murray RM, Jones DK. Symmetries in human brain language pathways correlate with verbal recall. Proc Natl Acad Sci U S A. 2007;104:17163–17168. doi: 10.1073/pnas.0702116104. [DOI] [PMC free article] [PubMed] [Google Scholar]
- Catani M, Howard RJ, Pajevic S, Jones DK. Virtual in vivo interactive dissection of white matter fasciculi in the human brain. Neuroimage. 2002;17:77–94. doi: 10.1006/nimg.2002.1136. [DOI] [PubMed] [Google Scholar]
- Catani M, Jones DK, ffytche DH. Perisylvian language networks of the human brain. Ann Neurol. 2005;57:8–16. doi: 10.1002/ana.20319. [DOI] [PubMed] [Google Scholar]
- Catani M, Mesulam M. The arcuate fasciculus and the disconnection theme in language and aphasia: History and current state. Cortex. 2008;44:953–961. doi: 10.1016/j.cortex.2008.04.002. [DOI] [PMC free article] [PubMed] [Google Scholar]
- Catani M, Thiebaut de Schotten M. A diffusion tensor imaging tractography atlas for virtual in vivo dissections. Cortex. 2008;44:1105–1132. doi: 10.1016/j.cortex.2008.05.004. [DOI] [PubMed] [Google Scholar]
- Chen B, Guo H, Song AW. Correction for direction-dependent distortions in diffusion tensor imaging using matched magnetic field maps. Neuroimage. 2006;30:121–129. doi: 10.1016/j.neuroimage.2005.09.008. [DOI] [PubMed] [Google Scholar]
- Chlebus P, Mikl M, Brazdil M, Pazourkova M, Krupa P, Rektor I. fMRI evaluation of hemispheric language dominance using various methods of laterality index calculation. Exp Brain Res. 2007;179:365–374. doi: 10.1007/s00221-006-0794-y. [DOI] [PubMed] [Google Scholar]
- Collins DL, Neelin P, Peters TM, Evans AC. Automatic 3D intersubject registration of MR volumetric data in standardized Talairach space. J Comput Assist Tomogr. 1994;18:192–205. [PubMed] [Google Scholar]
- Conturo TE, Lori NF, Cull TS, Akbudak E, Snyder AZ, Shimony JS, McKinstry RC, Burton H, Raichle ME. Tracking neuronal fiber pathways in the living human brain. Proc Natl Acad Sci U S A. 1999;96:10422–10427. doi: 10.1073/pnas.96.18.10422. [DOI] [PMC free article] [PubMed] [Google Scholar]
- Cox RW. AFNI: software for analysis and visualization of functional magnetic resonance neuroimages. Comput Biomed Res. 1996;29:162–173. doi: 10.1006/cbmr.1996.0014. [DOI] [PubMed] [Google Scholar]
- Deppe M, Ringelstein EB, Knecht S. The investigation of functional brain lateralization by transcranial Doppler sonography. Neuroimage. 2004;21:1124–1146. doi: 10.1016/j.neuroimage.2003.10.016. [DOI] [PubMed] [Google Scholar]
- Devlin JT, Watkins KE. Stimulating language: insights from TMS. Brain. 2007;130:610–622. doi: 10.1093/brain/awl331. [DOI] [PMC free article] [PubMed] [Google Scholar]
- Dorsaint-Pierre R, Penhune VB, Watkins KE, Neelin P, Lerch JP, Bouffard M, Zatorre RJ. Asymmetries of the planum temporale and Heschl’s gyrus: relationship to language lateralization. Brain. 2006;129:1164–1176. doi: 10.1093/brain/awl055. [DOI] [PubMed] [Google Scholar]
- Dronkers NF, Plaisant O, Iba-Zizen MT, Cabanis EA. Paul Broca’s historic cases: high resolution MR imaging of the brains of Leborgne and Lelong. Brain. 2007;130:1432–1441. doi: 10.1093/brain/awm042. [DOI] [PubMed] [Google Scholar]
- Dubois J, Hertz-Pannier L, Cachia A, Mangin JF, Le Bihan D, Dehaene-Lambertz G. Structural Asymmetries in the Infant Language and Sensori-Motor Networks. Cereb Cortex. 2008 doi: 10.1093/cercor/bhn097. [DOI] [PubMed] [Google Scholar]
- Duffau H. The anatomo-functional connectivity of language revisited New insights provided by electrostimulation and tractography. Neuropsychologia. 2008;46:927–934. doi: 10.1016/j.neuropsychologia.2007.10.025. [DOI] [PubMed] [Google Scholar]
- Duffau H, Leroy M, Gatignol P. Cortico-subcortical organization of language networks in the right hemisphere: An electrostimulation study in left-handers. Neuropsychologia. 2008 doi: 10.1016/j.neuropsychologia.2008.07.017. [DOI] [PubMed] [Google Scholar]
- Eickhoff SB, Stephan KE, Mohlberg H, Grefkes C, Fink GR, Amunts K, Zilles K. A new SPM toolbox for combining probabilistic cytoarchitectonic maps and functional imaging data. Neuroimage. 2005;25:1325–1335. doi: 10.1016/j.neuroimage.2004.12.034. [DOI] [PubMed] [Google Scholar]
- Ellis AW, Burani C, Izura C, Bromiley A, Venneri A. Traces of vocabulary acquisition in the brain: Evidence from covert object naming. Neuroimage. 2006;33:958–968. doi: 10.1016/j.neuroimage.2006.07.040. [DOI] [PubMed] [Google Scholar]
- Ellmore TM, Beauchamp MS, O’Neill TJ, Dreyer S, Tandon N. Relationships between essential cortical language sites and subcortical pathways. J Neurosurg. 2009 doi: 10.3171/2009.3.JNS081427. [DOI] [PubMed] [Google Scholar]
- Epelbaum S, Pinel P, Gaillard R, Delmaire C, Perrin M, Dupont S, Dehaene S, Cohen L. Pure alexia as a disconnection syndrome: New diffusion imaging evidence for an old concept. Cortex. 2008;44:962–974. doi: 10.1016/j.cortex.2008.05.003. [DOI] [PubMed] [Google Scholar]
- Foundas AL, Leonard CM, Gilmore R, Fennell E, Heilman KM. Planum temporale asymmetry and language dominance. Neuropsychologia. 1994;32:1225–1231. doi: 10.1016/0028-3932(94)90104-x. [DOI] [PubMed] [Google Scholar]
- Foundas AL, Leonard CM, Gilmore RL, Fennell EB, Heilman KM. Pars triangularis asymmetry and language dominance. Proc Natl Acad Sci U S A. 1996;93:719–722. doi: 10.1073/pnas.93.2.719. [DOI] [PMC free article] [PubMed] [Google Scholar]
- Glasser MF, Rilling JK. DTI Tractography of the Human Brain’s Language Pathways. Cereb Cortex. 2008 doi: 10.1093/cercor/bhn011. [DOI] [PubMed] [Google Scholar]
- Gold BT, Powell DK, Xuan L, Jiang Y, Hardy PA. Speed of lexical decision correlates with diffusion anisotropy in left parietal and frontal white matter: evidence from diffusion tensor imaging. Neuropsychologia. 2007;45:2439–2446. doi: 10.1016/j.neuropsychologia.2007.04.011. [DOI] [PMC free article] [PubMed] [Google Scholar]
- Govindan RM, Makki MI, Sundaram SK, Juhasz C, Chugani HT. Diffusion tensor analysis of temporal and extra-temporal lobe tracts in temporal lobe epilepsy. Epilepsy Res. 2008;80:30–41. doi: 10.1016/j.eplepsyres.2008.03.011. [DOI] [PMC free article] [PubMed] [Google Scholar]
- Hagmann P, Cammoun L, Martuzzi R, Maeder P, Clarke S, Thiran JP, Meuli R. Hand preference and sex shape the architecture of language networks. Hum Brain Mapp. 2006;27:828–835. doi: 10.1002/hbm.20224. [DOI] [PMC free article] [PubMed] [Google Scholar]
- Hamberger MJ, Seidel WT, McKhann GM, 2nd, Perrine K, Goodman RR. Brain stimulation reveals critical auditory naming cortex. Brain. 2005;128:2742–2749. doi: 10.1093/brain/awh621. [DOI] [PubMed] [Google Scholar]
- Harris LJ. Lateralized sex differences: substrate and significance. Behav Brain Sci. 1980;3:236–237. [Google Scholar]
- Helmstaedter C, Kurthen M, Gleissner U, Linke DB, Elger CE. Natural atypical language dominance and language shifts from the right to the left hemisphere in right hemisphere pathology. Naturwissenschaften. 1997a;84:250–252. doi: 10.1007/s001140050390. [DOI] [PubMed] [Google Scholar]
- Helmstaedter C, Kurthen M, Linke DB, Elger CE. Patterns of language dominance in focal left and right hemisphere epilepsies: relation to MRI findings, EEG, sex, and age at onset of epilepsy. Brain Cogn. 1997b;33:135–150. doi: 10.1006/brcg.1997.0888. [DOI] [PubMed] [Google Scholar]
- Hirata M, Kato A, Taniguchi M, Saitoh Y, Ninomiya H, Ihara A, Kishima H, Oshino S, Baba T, Yorifuji S, Yoshimine T. Determination of language dominance with synthetic aperture magnetometry: comparison with the Wada test. Neuroimage. 2004;23:46–53. doi: 10.1016/j.neuroimage.2004.05.009. [DOI] [PubMed] [Google Scholar]
- Isaacs KL, Barr WB, Nelson PK, Devinsky O. Degree of handedness and cerebral dominance. Neurology. 2006;66:1855–1858. doi: 10.1212/01.wnl.0000219623.28769.74. [DOI] [PubMed] [Google Scholar]
- Jansen A, Lohmann H, Scharfe S, Sehlmeyer C, Deppe M, Knecht S. The association between scalp hair-whorl direction, handedness and hemispheric language dominance: is there a common genetic basis of lateralization? Neuroimage. 2007;35:853–861. doi: 10.1016/j.neuroimage.2006.12.025. [DOI] [PubMed] [Google Scholar]
- Jansen A, Menke R, Sommer J, Forster AF, Bruchmann S, Hempleman J, Weber B, Knecht S. The assessment of hemispheric lateralization in functional MRI--robustness and reproducibility. Neuroimage. 2006;33:204–217. doi: 10.1016/j.neuroimage.2006.06.019. [DOI] [PubMed] [Google Scholar]
- Kemp S, Wilkinson K, Caswell H, Reynders H, Baker G. The base rate of Wada test failure. Epilepsy Behav. 2008;13:630–633. doi: 10.1016/j.yebeh.2008.07.013. [DOI] [PubMed] [Google Scholar]
- Khedr EM, Hamed E, Said A, Basahi J. Handedness and language cerebral lateralization. Eur J Appl Physiol. 2002;87:469–473. doi: 10.1007/s00421-002-0652-y. [DOI] [PubMed] [Google Scholar]
- Klar AJ. Human handedness and scalp hair-whorl direction develop from a common genetic mechanism. Genetics. 2003;165:269–276. doi: 10.1093/genetics/165.1.269. [DOI] [PMC free article] [PubMed] [Google Scholar]
- Kurthen M, Helmstaedter C, Linke DB, Solymosi L, Elger CE, Schramm J. Interhemispheric dissociation of expressive and receptive language functions in patients with complex-partial seizures: an amobarbital study. Brain Lang. 1992;43:694–712. doi: 10.1016/0093-934x(92)90091-r. [DOI] [PubMed] [Google Scholar]
- Leemans A, Jones DK. The B-matrix must be rotated when correcting for subject motion in DTI data. Magn Reson Med. 2009;61:1336–1349. doi: 10.1002/mrm.21890. [DOI] [PubMed] [Google Scholar]
- Lishman WA, McMeekan ER. Handedness in relation to direction and degree of cerebral dominance for language. Cortex. 1977;13:30–43. doi: 10.1016/s0010-9452(77)80051-8. [DOI] [PubMed] [Google Scholar]
- Loddenkemper T, Morris HH, Moddel G. Complications during the Wada test. Epilepsy Behav. 2008;13:551–553. doi: 10.1016/j.yebeh.2008.05.014. [DOI] [PubMed] [Google Scholar]
- Lu LH, Crosson B, Nadeau SE, Heilman KM, Gonzalez-Rothi LJ, Raymer A, Gilmore RL, Bauer RM, Roper SN. Category-specific naming deficits for objects and actions: semantic attribute and grammatical role hypotheses. Neuropsychologia. 2002;40:1608–1621. doi: 10.1016/s0028-3932(02)00014-3. [DOI] [PubMed] [Google Scholar]
- Madden DJ, Whiting WL, Huettel SA, White LE, MacFall JR, Provenzale JM. Diffusion tensor imaging of adult age differences in cerebral white matter: relation to response time. Neuroimage. 2004;21:1174–1181. doi: 10.1016/j.neuroimage.2003.11.004. [DOI] [PubMed] [Google Scholar]
- Mandonnet E, Nouet A, Gatignol P, Capelle L, Duffau H. Does the left inferior longitudinal fasciculus play a role in language? A brain stimulation study. Brain. 2007;130:623–629. doi: 10.1093/brain/awl361. [DOI] [PubMed] [Google Scholar]
- Matsumoto R, Okada T, Mikuni N, Mitsueda-Ono T, Taki J, Sawamoto N, Hanakawa T, Miki Y, Hashimoto N, Fukuyama H, Takahashi R, Ikeda A. Hemispheric asymmetry of the arcuate fasciculus: A preliminary diffusion tensor tractography study in patients with unilateral language dominance defined by Wada test. J Neurol. 2008 doi: 10.1007/s00415-008-0005-9. [DOI] [PubMed] [Google Scholar]
- McDonald CR, Ahmadi ME, Hagler DJ, Tecoma ES, Iragui VJ, Gharapetian L, Dale AM, Halgren E. Diffusion tensor imaging correlates of memory and language impairments in temporal lobe epilepsy. Neurology. 2008;71:1869–1876. doi: 10.1212/01.wnl.0000327824.05348.3b. [DOI] [PMC free article] [PubMed] [Google Scholar]
- McGlone J. Sex differences in human brain asymmetry: a critical survey. Behav Brain Sci. 1980;3:215–227. [Google Scholar]
- Miller JW, Jayadev S, Dodrill CB, Ojemann GA. Gender differences in handedness and speech lateralization related to early neurologic insults. Neurology. 2005;65:1974–1975. doi: 10.1212/01.wnl.0000188900.91741.ea. [DOI] [PubMed] [Google Scholar]
- Mistry NN, Hsu EW. Retrospective distortion correction for 3D MR diffusion tensor microscopy using mutual information and Fourier deformations. Magn Reson Med. 2006;56:310–316. doi: 10.1002/mrm.20949. [DOI] [PMC free article] [PubMed] [Google Scholar]
- Mori S, Kaufmann WE, Davatzikos C, Stieltjes B, Amodei L, Fredericksen K, Pearlson GD, Melhem ER, Solaiyappan M, Raymond GV, Moser HW, van Zijl PC. Imaging cortical association tracts in the human brain using diffusion-tensor-based axonal tracking. Magn Reson Med. 2002;47:215–223. doi: 10.1002/mrm.10074. [DOI] [PubMed] [Google Scholar]
- Mori S, Wakana S, van Zijl PC, Nagae-Poetscher LM. MRI Atlas of Human White Matter. Elsevier Science; Amsterdam, The Netherlands: 2005. [Google Scholar]
- Oldfield RC. The assessment and analysis of handedness: the Edinburgh inventory. Neuropsychologia. 1971;9:97–113. doi: 10.1016/0028-3932(71)90067-4. [DOI] [PubMed] [Google Scholar]
- Ortiz de Zarate JC, Ortiz de Zarate CO. Hair whorl and handedness. Brain Cogn. 1991;16:228–230. doi: 10.1016/0278-2626(91)90008-v. [DOI] [PubMed] [Google Scholar]
- Papadakis NG, Smponias T, Berwick J, Mayhew JE. k-space correction of eddy-current-induced distortions in diffusion-weighted echo-planar imaging. Magn Reson Med. 2005;53:1103–1111. doi: 10.1002/mrm.20429. [DOI] [PubMed] [Google Scholar]
- Papanicolaou AC, Simos PG, Castillo EM, Breier JI, Sarkari S, Pataraia E, Billingsley RL, Buchanan S, Wheless J, Maggio V, Maggio WW. Magnetocephalography: a noninvasive alternative to the Wada procedure. J Neurosurg. 2004;100:867–876. doi: 10.3171/jns.2004.100.5.0867. [DOI] [PubMed] [Google Scholar]
- Powell HW, Parker GJ, Alexander DC, Symms MR, Boulby PA, Wheeler-Kingshott CA, Barker GJ, Noppeney U, Koepp MJ, Duncan JS. Hemispheric asymmetries in language-related pathways: a combined functional MRI and tractography study. Neuroimage. 2006;32:388–399. doi: 10.1016/j.neuroimage.2006.03.011. [DOI] [PubMed] [Google Scholar]
- Rauschecker AM, Deutsch GK, Ben-Shachar M, Schwartzman A, Perry LM, Dougherty RF. Reading impairment in a patient with missing arcuate fasciculus. Neuropsychologia. 2008 doi: 10.1016/j.neuropsychologia.2008.08.011. [DOI] [PMC free article] [PubMed] [Google Scholar]
- Reutskiy S, Rossoni E, Tirozzi B. Conduction in bundles of demyelinated nerve fibers: computer simulation. Biol Cybern. 2003;89:439–448. doi: 10.1007/s00422-003-0430-x. [DOI] [PubMed] [Google Scholar]
- Rodrigo S, Naggara O, Oppenheim C, Golestani N, Poupon C, Cointepas Y, Mangin JF, Le Bihan D, Meder JF. Human subinsular asymmetry studied by diffusion tensor imaging and fiber tracking. AJNR Am J Neuroradiol. 2007;28:1526–1531. doi: 10.3174/ajnr.A0584. [DOI] [PMC free article] [PubMed] [Google Scholar]
- Rodrigo S, Oppenheim C, Chassoux F, Hodel J, de Vanssay A, Baudoin-Chial S, Devaux B, Meder JF. Language lateralization in temporal lobe epilepsy using functional MRI and probabilistic tractography. Epilepsia. 2008;49:1367–1376. doi: 10.1111/j.1528-1167.2008.01607.x. [DOI] [PubMed] [Google Scholar]
- Salmelin R, Hari R, Lounasmaa OV, Sams M. Dynamics of brain activation during picture naming. Nature. 1994;368:463–465. doi: 10.1038/368463a0. [DOI] [PubMed] [Google Scholar]
- Schmierer K, Wheeler-Kingshott CA, Boulby PA, Scaravilli F, Altmann DR, Barker GJ, Tofts PS, Miller DH. Diffusion tensor imaging of post mortem multiple sclerosis brain. Neuroimage. 2007;35:467–477. doi: 10.1016/j.neuroimage.2006.12.010. [DOI] [PMC free article] [PubMed] [Google Scholar]
- Sherbondy A, Akers D, Mackenzie R, Dougherty R, Wandell B. Exploring connectivity of the brain’s white matter with dynamic queries. IEEE Trans Vis Comput Graph. 2005;11:419–430. doi: 10.1109/TVCG.2005.59. [DOI] [PubMed] [Google Scholar]
- Snodgrass JG, Vanderwart M. A standardized set of 260 pictures: norms for name agreement, image agreement, familiarity, and visual complexity. J Exp Psychol [Hum Learn] 1980;6:174–215. doi: 10.1037//0278-7393.6.2.174. [DOI] [PubMed] [Google Scholar]
- Sommer IE, Aleman A, Somers M, Boks MP, Kahn RS. Sex differences in handedness, asymmetry of the planum temporale and functional language lateralization. Brain Res. 2008;1206:76–88. doi: 10.1016/j.brainres.2008.01.003. [DOI] [PubMed] [Google Scholar]
- Song SK, Sun SW, Ju WK, Lin SJ, Cross AH, Neufeld AH. Diffusion tensor imaging detects and differentiates axon and myelin degeneration in mouse optic nerve after retinal ischemia. Neuroimage. 2003;20:1714–1722. doi: 10.1016/j.neuroimage.2003.07.005. [DOI] [PubMed] [Google Scholar]
- Specht K, Huber W, Willmes K, Shah NJ, Jancke L. Tracing the ventral stream for auditory speech processing in the temporal lobe by using a combined time series and independent component analysis. Neurosci Lett. 2008;442:180–185. doi: 10.1016/j.neulet.2008.06.084. [DOI] [PubMed] [Google Scholar]
- Strauss E, Wada J, Goldwater B. Sex differences in interhemispheric reorganization of speech. Neuropsychologia. 1992;30:353–359. doi: 10.1016/0028-3932(92)90108-x. [DOI] [PubMed] [Google Scholar]
- Tandon N, O’Neill TJ, Beauchamp MS, Ellmore TM. Rapid identification of the arcuate fasciculus using an FA thresholding technique. Epilepsia. 2007;48:161. [Google Scholar]
- Tournier JD, Calamante F, Connelly A. Robust determination of the fibre orientation distribution in diffusion MRI: non-negativity constrained super-resolved spherical deconvolution. Neuroimage. 2007;35:1459–1472. doi: 10.1016/j.neuroimage.2007.02.016. [DOI] [PubMed] [Google Scholar]
- Truong TK, Chen B, Song AW. Integrated SENSE DTI with correction of susceptibility- and eddy current-induced geometric distortions. Neuroimage. 2008;40:53–58. doi: 10.1016/j.neuroimage.2007.12.001. [DOI] [PMC free article] [PubMed] [Google Scholar]
- Tuch DS. Q-ball imaging. Magn Reson Med. 2004;52:1358–1372. doi: 10.1002/mrm.20279. [DOI] [PubMed] [Google Scholar]
- Tuch DS, Salat DH, Wisco JJ, Zaleta AK, Hevelone ND, Rosas HD. Choice reaction time performance correlates with diffusion anisotropy in white matter pathways supporting visuospatial attention. Proc Natl Acad Sci U S A. 2005;102:12212–12217. doi: 10.1073/pnas.0407259102. [DOI] [PMC free article] [PubMed] [Google Scholar]
- Vernooij MW, Smits M, Wielopolski PA, Houston GC, Krestin GP, van der Lugt A. Fiber density asymmetry of the arcuate fasciculus in relation to functional hemispheric language lateralization in both right- and left-handed healthy subjects: a combined fMRI and DTI study. Neuroimage. 2007;35:1064–1076. doi: 10.1016/j.neuroimage.2006.12.041. [DOI] [PubMed] [Google Scholar]
- Wada J, Rasmussen T. Intracarotid injection of sodium amytal for the lateralization of cerebral speech dominance. 1960. J Neurosurg. 2007;106:1117–1133. doi: 10.3171/jns.2007.106.6.1117. [DOI] [PubMed] [Google Scholar]
- Wallentin M. Putative sex differences in verbal abilities and language cortex: a critical review. Brain Lang. 2009;108:175–183. doi: 10.1016/j.bandl.2008.07.001. [DOI] [PubMed] [Google Scholar]
- Waxman SG. Determinants of conduction velocity in myelinated nerve fibers. Muscle Nerve. 1980;3:141–150. doi: 10.1002/mus.880030207. [DOI] [PubMed] [Google Scholar]
- Weber B, Hoppe C, Faber J, Axmacher N, Fliessbach K, Mormann F, Weis S, Ruhlmann J, Elger CE, Fernandez G. Association between scalp hair-whorl direction and hemispheric language dominance. Neuroimage. 2006;30:539–543. doi: 10.1016/j.neuroimage.2005.09.037. [DOI] [PubMed] [Google Scholar]
- Wimberger DM, Roberts TP, Barkovich AJ, Prayer LM, Moseley ME, Kucharczyk J. Identification of “premyelination” by diffusion-weighted MRI. J Comput Assist Tomogr. 1995;19:28–33. doi: 10.1097/00004728-199501000-00005. [DOI] [PubMed] [Google Scholar]