Abstract
Modeling functional brain interaction networks using non-invasive EEG and MEG data is more challenging than using intracranial recording data. This is because most interaction measures are not robust to the cross-talk (interference) between cortical regions, which may arise due to the limited spatial resolution of EEG/MEG inverse procedures. In this paper we describe a modified beam-forming approach to accurately measure cortical interactions from EEG/MEG data, designed to suppress cross-talk between cortical regions. We estimate interaction measures from the output of the modified beamformer and test for statistical significance using permutation tests. Since the underlying neuronal sources and their interactions are unknown in real MEG data, we demonstrate the performance of the proposed beamforming method in a novel simulation scheme, where intracranial recordings from a macaque monkey are used as neural sources to simulate realistic MEG signals. The advantage of this approach is that local field potentials are more realistic representations of true neuronal sources than simulation models and therefore are more suitable to indicate the performance of our nulling beamforming method.
Keywords: functional connectivity, cortical interaction, nulling beamformer, LCMV, MVAR, coherence, phase synchrony, Granger causality
1. Introduction
Modeling distributed dynamical interactions, or functional connectivity, between cortical regions is a key issue in understanding neural networks in the human brain. Many different methods have been proposed to model functional connectivity, including spectral coherence (Nunez et al., 1997), phase synchrony (Lachaux et al., 1999) and Granger causality (Brovelli et al., 2004). These measures have been widely used to characterize interactions from depth electrode measurements (Brovelli et al., 2004; Ding et al., 2000; Kaminski et al., 2001; Sehatpour et al., 2008). While in principle they extend to EEG and MEG measurements, their utility is limited by their sensitivity to the cross-talk effect (or linear mixing). The broad spatial sensitivity of MEG/EEG sensors (Nunez et al., 1997) introduces a considerable amount of linear mixing among the sensor measurements. Since interaction measures are limited in their ability to distinguish between true neuronal interactions and the effect of instantaneous linear mixing, applying them directly to raw MEG/EEG measurements would generate false positives.
Many inverse imaging methods have been proposed to create cortical activation maps from the linearly mixed MEG/EEG sensor measurements (Baillet et al., 2001; Lutkenhoner et al., 1996; Darvas et al., 2004). These include dipole fitting (Scherg and Von Cramon, 1985; Mosher et al., 1992), linearly constrained minimum variance (LCMV) beamforming (Spencer et al., 1992; Van Veen et al., 1997; Robinson and Vrba, 1999), and minimum norm imaging (Jeffs et al., 1987; Dale et al., 2000; Pascual-Marqui, 2002). Although the estimation of neural source signals using inverse imaging reduces the cross-talk effect present in the raw sensor measurements, most inverse methods primarily focus on creating accurate or unbiased source localization instead of fully eliminating the cross-talk effect. For example, the limited resolution of minimum-norm imaging leaves substantial cross-talk between nearby regions, as we demonstrate later in the paper.
An LCMV beamformer has higher resolution than minimum-norm imaging when the cortical sources are focal, which makes them more suitable for assessing interactions (Hadjipapas et al., 2005). However, the underlying assumption of adaptive beamformer is that the neural sources are incoherent. When signals exhibit coherent behavior, the beamformer will fail to form deep nulls at the locations of other coherent sources due to partial cancellation (Reddy et al., 1987). Therefore, the output of adaptive beamformers can suffer from signal cancellation and cross-talk effects which can confound subsequent interaction analysis.
There are several possible approaches to deal with the linear cross-talk problem. One is to define new interaction measures that are less sensitive to this effect. An example is to use the imaginary part of complex coherence which is equal to zero when signals are just linearly mixed (Nolte et al., 2004). However, this method still suffers from secondary cross-talk; additional pairs of coherent sources can both leak to the two cortical sites between which we measure interactions, causing a mislocalization of cortical interactions. An alternative approach is to use statistical testing to distinguish true interactions from crosstalk. This is often attempted using permutation tests or other non-parametric methods in which surrogate data are used to establish the distribution of the interaction measure under the case when no interactions are present. Methods based on phase randomization (Prichard and Theiler, 1994; Andrzejak et al., 2003) and permutation of trial indices (Brovelli et al., 2004) have been used for this purpose. However in practice it is very difficult, or in some cases impossible, to find a permutation scheme in which cross-talk is retained while true interactions are removed. The third approach is to use inverse methods that are less sensitive to linear cross-talk so that it has little effect on the interaction measures. We follow this approach by modifying the standard LCMV beamformer. We also use permutation tests, but rather than using them to differentiate true interactions from cross-talk as described, we use them to test for the statistical significance of interactions.
We propose the use of a nulling beamformer to address the problem of crosstalk. The nulling beamformer is a modified version of the LCMV beamformer (Spencer et al., 1992; Van Veen et al., 1997), where additional nulling constraints are added to cancel signals from specific cortical locations. Furthermore, a set of eigenvector constraints can be used to make the methods robust to misspecification of the precise locations and extents of the cortical sources of interest. We extend the results originally presented in Hui and Leahy (2006), and use the nulling beamformer in a novel simulation scheme. The nulling beamformer has also been used independently by Dalal et al. (2006), but their purpose was to achieve better source localization by avoiding cancellation of coherent sources. To demonstrate the performance of our method, we simulate MEG cortical sources using intracranially measured local field potentials (LFPs), which are believed to be more realistic representations of true neuronal sources (Sutherling et al., 1988; Lachaux et al., 2007) than simulation models. Since these signals are available before and after linear mixing, we can compute interactions in both cases and evaluate the robustness of our method to linear cross-talk. We measure the performance of the nulling beamformer in conjunction with different interaction measures and compare it with that of the standard LCMV beamformer and linear imaging methods.
We make the assumption that the approximate locations of neuronal sources of interest have been identified. This can be achieved either by using a standard beamformer or inverse imaging method, where peaks of reconstructed activation maps are potential source locations, or with reference to published neuroscience studies that have identified cortical regions of interest for a particular network. Use of eigenvector constraints, as we describe below, provides some robustness to misspecification of these locations.
2. Methods
This section is organized as follows: we first describe the nulling beamformer, then extend this methodology to sources covering extended cortical areas using eigenvector constraints. We also review several interactions measures that are used to investigate cortical networks, and discuss the non-parametric permutation approach that we use to establish statistical significance.
2.1. LCMV Beamformer
The LCMV beamforming method is a spatial filtering technique first applied in radar and sonar signal processing (Van Veen and Buckley, 1988), that has been widely used in the analysis of EEG and MEG data (Spencer et al., 1992; Van Veen et al., 1997; Robinson and Vrba, 1999; Sekihara et al., 2001; Gross et al., 2001). It is based on the assumption that the measured signal m at the EEG/MEG sensors is generated by a small number N of focal neural sources s(qi) at locations qi (i = 1 … N):
| (1) |
where the neural signal s(qi) is a scalar if the source is modeled as orientation constrained with respect to the cortical surface, or a 3×1 vector with x, y and z components if the source is modeled as orientation free. The sensitivity or lead field g(qi) is a vector in the orientation constrained case, or a 3-column matrix in the orientation free case.
An LCMV beamformer constructs a spatial filter whose output ŝ(qi) at location qi is represented as
| (2) |
The weights of the spatial filter w(qi) are selected to minimize the variance, or power at the filter output subject to passing signals from a cortical region of interest with unit gain:
| (3) |
where Cm denotes the spatial covariance matrix of the measurement data, and I is a 3×3 identity matrix in the orientation free case or simply the scalar 1 in the orientation constrained case. This optimization problem can be readily solved using Lagrange multipliers (Van Veen et al., 1997):
| (4) |
These weights allow the beamformer to adaptively reduce noise and interference, while passing the desired signal through the filter without attenuation. Therefore, the LCMV beamformer can suppress cross-talk from other sources when the sources are non-coherent. However, when signals exhibit coherent behavior, the minimum in (3) is achieved by allowing non-zero gain with respect to the interfering sources so they can partially cancel the signal from the source of interest, which in turn reduces the total output power of the beamformer (Van Veen et al., 1997; Van Veen and Buckley, 1988; Brookes et al., 2007). In that case, the output signals from the beamformer are reduced and not accurate enough for estimating the interactions. Consequently, the beamformer in its standard form is of limited use in investigating interactions where we want to observe correlations between cortical regions.
2.2. Nulling Beamformer
To suppress signal cancellation and cross-talk effects in the LCMV beamformer, we have to make sure that the filter output at each source location qi will not be affected by signals from the other locations qj (j ≠ i). This can be achieved by forcing additional nulling constraints, i.e. zero gain conditions at interfering source locations (Hui and Leahy, 2006; Dalal et al., 2006):
| (5) |
We combine these nulling constraints with the unit gain condition of the traditional LCMV beamformer in (3). By combining all the gain vectors for the N sources of interest into a matrix G = [g(q1) ··· g(qN)], the beamformer design problem can then be written as follows:
| (6) |
where fi = ei ⊗ I. The operator ⊗ represents Kronecker product,
is an indicator vector whose i-th element is one and the rest are zero, and I is defined as in (3).
Similarly to the traditional LCMV beamformer, this minimization problem can be readily solved using Lagrange multipliers (Van Veen et al., 1997):
| (7) |
The resulting weight w(qi) has a unit gain at the location of interest qi and zero gains at the other N-1 locations, thus nulling possible interference between them.
2.3. Eigenvector Constrained Nulling Beamformer
The standard adaptive beamformer assume focal sources. In reality, however, broad cortical regions represented by multiple dipole sources can be active in response to sensory, motor or cognitive tasks. When the total number of sources representing a cortical region is small, we can apply the above nulling constraints on all sources individually, to suppress the cross-talk from the entire cortical patch. But when that number is large, applying a nulling constraint on every point is impossible, because our beamformer, which has the same dimension as our MEG/EEG measurements, provides us with only limited degrees of freedom. To overcome this problem, we use eigenvector constraints, as described in Van Veen and Buckley (1988).
Consider a patch represented with k cortical sources at locations (vertices) q1 ··· qk and their lead field matrix Gp = [g(q1) ··· g(qk)]. Forcing point constraints at all locations in the patch can be enforced with the constraint:
| (8) |
where rd is the desired response vector for the whole region, for example rd = 0 for nulling constraints with the dimension of the zero matrix being 1 × k for the orientation constrained case, and 3 × 3k for the orientation free case. Instead of using constraints on every location within the region, we minimize the degrees of freedom used by allowing a least squares approximation to the desired response on the whole region:
| (9) |
To limit the number of constraints to a small number L for each region, we use a rank L approximation of Gp from its L largest singular values:
| (10) |
where ΣL is an L × L diagonal matrix containing the L largest singular values of Gp, and UL and VL are matrices containing the L corresponding singular vectors.
By substituting (10) in (9), we find that the weights minimizing the squared error should satisfy the following equation:
| (11) |
This has the same form as the constraint in (6), and therefore the solution to the eigenvector constrained nulling beamformer derives directly from the solution to the point constrained one. The only difference between the two beamformers is that instead of forcing constraints on individual locations, we now force constraints on the principal eigenvectors of cortical patches.
The advantage of this eigenvector constraint method is that it only requires a small number of constraints for an extended cortical source. Therefore, when the extents and true positions of the sources are only approximately known, we can still apply the nulling constraints by controlling a relatively larger patch around the true source.
In addition to applying extended nulling constraints on interfering patch sources, we can also impose the constraint of approximately unit gain using eigenvector constraint on an extended cortical patch of interest where rd = 1 of dimension 1 × k for orientation constrained case and rd = 1 ⊗ I, a stack of identity matrices with total dimension of 3 × 3k, for the orientation free case.
Combining the eigenvector nulling constraints and eigenvector unit constraints, we can formulate the eigenvector constrained nulling beamformer similarly to the minimization problem in (6) and obtain the weights of the spatial filter using Lagrange multipliers.
| (12) |
where the superscript indicates the patch number. For estimating the source signals at the ith patch, we have for orientation constrained case or for orientation free case, and for every j ≠ i (12) we assume that the number of eigenvector constraints is the same for all the patches, however the result generalizes directly to the case where different dimensions are used for each patch.
2.4. Interaction Methods
In this section, we briefly review some commonly used interaction measures: coherence, phase synchrony and MVAR modeling. We show that all these commonly used interactions measures are sensitive to cross-talk and can consequently produce false positives in the analysis of MEG/EEG data.
2.4.1. Coherence
Coherence is a measure of the linear relationship between two signals at a specific frequency (Carter, 1987; Carter et al., 1973; Gardner, 1992). The complex coherence (sometimes referred to as coherency) is defined as the cross-spectrum normalized by the square root of the power spectra of both signals.
| (13) |
where Sxy(f) is the cross-spectral density function between signal x(t) and y(t), and Sxx(f) and Syy(f) are their power spectral densities. In practice, the magnitude of the complex coherence |Cxy(f)| is generally used for coherence. Some studies use the square of magnitude |Cxy(f)|2, which is referred to as Magnitude Squared Coherence (MSC).
The magnitude of coherence takes values between 0 and 1, with 0 indicating that the two signals are perfectly uncorrelated at frequency f. A value of unity indicates perfect correlation, but potentially with a phase shift between the two signals, represented by the phase of the complex coherence. Linear mixing is instantaneous and can produce no phase shift, therefore in the presence of only linear cross-talk, we would expect the coherence to be entirely real. Conversely, true interactions that are distinguishable from cross-talk will result in an imaginary component in coherence. For this reason, Nolte et al. (2004) proposed using only the imaginary part of the complex coherence as a more robust measure of cortical interaction. In practice, even this measure can be affected by cross-talk because of the effects of additional sources, noise and finite sample size.
2.4.2. Phase Synchrony
Phase synchrony, also known as phase locking, measures the frequency-specific transient phase-locking between two signals with a ratio of n: m (Lachaux et al., 1999; Le Van Quyen et al., 2001):
| (14) |
The phase locking value can be computed either using the Hilbert transform or the complex Morlet wavelet transform (Lachaux et al., 1999). As shown in the appendix of Lachaux et al. (1999), phase synchrony is also sensitive to the cross-talk effect: two sources with no relationship between them can still show non-zero phase synchrony if the signal from one source leaks to the other.
2.4.3. MVAR Model Related Measures
A number of interaction measures has been developed based on MultiVariate AutoRegressive (MVAR) models, with the ability to estimate not only the strength, but also the direction of interactions (Brovelli et al., 2004; Kaminski et al., 2001; Sameshima and Baccal, 1999; Baccala and Sameshima, 2001; Kus et al., 2004). The MVAR model is a straightforward extension of the univariate autoregressive time series model to an N-dimensional multivariate time series x(t) = [x1(t), …,xN (t)]T, with xi(t) representing a signal from ith source at time t:
| (15) |
where A(1), …,A(m) are N × N coefficient matrices (Kaminski et al., 2001), m is the model order, and n(t) = [n1(t), n2(t), …,nN (t)]T is a zero mean uncorrelated noise vector. The causal relationship between the multivariate signals can be inferred based on the estimated coefficient matrices using Granger’s definition of causality (Brovelli et al., 2004; Granger, 1980, 1969): signal X has a casual effect on signal Y if the variance of the autoregressive prediction error of Y is reduced by inclusion of past measurements from X (Granger, 1969; Geweke, 1982). We can compute such causal interaction using different metrics defined based on MVAR model: while Granger causality is mostly used for measuring pairwise interactions (Brovelli et al., 2004), Directed Transfer Function (DTF) and Partial Directed Coherence (PDC) are used for multivariate signals (Kaminski et al., 2001; Sameshima and Baccal, 1999; Baccala and Sameshima, 2001; Kus et al., 2004). Examples of analysis of MEG and EEG interactions with MVAR models are given in Gow et al. (2008); Babiloni et al. (2005); Astolfi et al. (2008).
The MVAR model is linear, and captures all linear interactions among signals, including cross-talk, and can therefore produce false interactions. For example, suppose the true source signals x(t) are observed in the presence of cross-talk as x̃ (t) where the cross-talk is represented by an unknown mixing matrix U:
| (16) |
Then the MVAR model based on x̃ (t) will become:
| (17) |
| (18) |
The coefficient matrices à (k) estimated from the linearly mixed x̃ (t) are different from the original coefficient matrices A(k), and therefore all interaction measures based on the MVAR model would be affected by cross-talk and possibly produce false positive interactions. While in principle the effects of U could be removed post hoc, it is difficult to estimate the true degree of cross-talk because of the uncertainty in both the forward model and the precise location of each source of interest.
2.5. Tests for Significance for Interaction Networks
We assume that the MEG/EEG study is repeated multiple times, and the data are collected as a set of stimulus-locked event-related trials. We estimate the data covariance matrix Cm over all trials and compute the weights w(qi) for the nulling beamformer with point sources (7), or extended sources (12). Time series at each cortical region of interest for each trial are estimated as in (2).
Since we are only interested in the induced response of the experiment, we remove the evoked response by subtracting from each source its average time series. The source time series are then used to estimate any of the interaction measures described above. For example, we can estimate coherence or phase synchrony between any pair of sources, or fit an MVAR model simultaneously to all sources. Provided our modeling assumptions are correct and the sources have been localized correctly, the interaction measures should be unaffected from cross-talk effects between the identified sources.
To test for the statistical significance of interactions, we rely on permutation tests (Brovelli et al., 2004; Nichols and Holmes, 2002; Pantazis et al., 2005). We assume that the induced response signals from different trials are independent and identically distributed. Under the null hypothesis that sources have no interactions between each other, we can exchange the trial labels for each source separately. These permutation samples would be statistically equivalent to the original data under the null hypothesis, since they would share no interactions among the sources. Under the alternative hypothesis that some sources are interacting, randomizing trial indices would destroy this interaction, and therefore the computed non-zero values of interaction measures (coherence, phase synchrony, or MVAR causality) in the permutation resamples would merely appear by chance, which allows us to establish statistical significance for the original data. We use the permutation samples to create the empirical distribution of a given interaction measure, and estimate a threshold that leaves α (typically 5%) of the distribution on the right side. We then reject the null hypothesis of no interaction if the statistic of the original data falls above this threshold.
The MVAR interaction measures, DTF and PDC produce causality estimates between each pair of sources for each frequency. In this case, we have a multiple comparisons problem corresponding to one hypothesis test per frequency and source pair. To control false positives, we follow the maximum statistic approach (Nichols and Holmes, 2002; Pantazis et al., 2005): for each permutation sample we compute the maximum of interactions over all frequencies in a range of interest and over all possible pairs. We use these values to estimate the maximum distribution and define a level α threshold that controls the family-wise error rate (FWER) over all source pairs and frequencies. This threshold is applied to the original MVAR measures, identifying significant interactions among all sources in the network.
We note that this procedure can be applied only because we process the data to preclude cross-talk between estimated signals. In the presence of cross-talk this method would not adequately control false positives, as explained in more detail in the Discussion section. Similar methods have been applied from depth electrode data (Brovelli et al., 2004) where cross-talk is also not a major issue.
We also use another resampling scheme, the bootstrap, to measure the stability of our interaction measures. The variability of the estimated interaction between sources can be attributed to two factors: the trial-to-trial variability in the true interaction between the sources, and the variability introduced from the linear mixing of sources due to inaccurate inverse modeling. To measure these factors, we apply a bootstrap resampling scheme. In a simulation setting, the variability of the true interaction is estimated by bootstrapping the true source signals (resampling with replacement over trials) and recomputing the interaction measures with the MVAR model. We then measure the variability of the estimated source interactions by using the nulling beamformer model with the MVAR model, and test their stability when both models are combined.
3. Results
We investigate the ability of the nulling beamformer in detecting source interactions when used in conjunction with coherence, phase synchrony, or MVAR models. To simulate realistic sources, we use intracranial EEG recordings experimentally measured from macaque monkeys (Bressler et al., 1993). We compare the nulling beamformer against other inverse methods, and test its ability to measure true interactions when the exact locations and extents of the sources are not known.
3.1. Realistic simulation of interactions
To evaluate the performance of our method to detect cortical interactions, we need to know the ground truth of the interaction network. Since this information is unavailable in real MEG data, we resort to a simulation with known source configurations and interaction profiles. In Hui and Leahy (2006) we used time series generated from an MVAR model as cortical sources signals. Although this simulation is helpful to illustrate the effectiveness of the nulling beamformer, the time series do not resemble the oscillatory nature and noise properties of real EEG/MEG data, and therefore may not fully indicate the performance of the nulling beamformer. In this study, we used experimentally measured intracranial LFPs (Bressler et al., 1993) as time series for the simulated MEG sources. Intracranial LFP recordings should reasonably resemble the electrophysiological neuronal sources that generate the electrical field measured in extracranial EEG and the magnetic field measured in MEG (Sutherling et al., 1988; Lachaux et al., 2007).
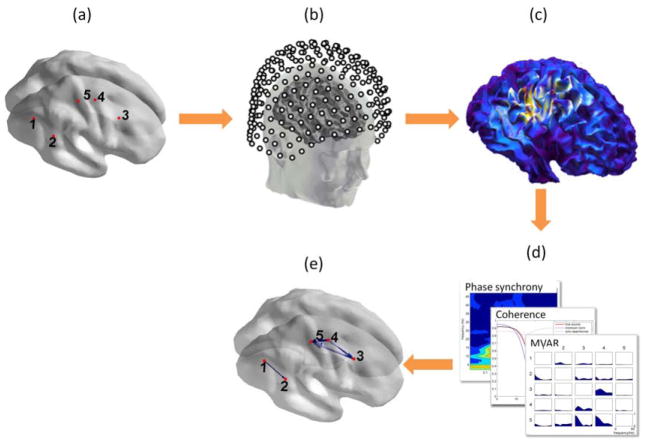
The LFP data were existing and well studied recordings that used surface-to-depth electrodes from an experiment involving a highly trained macaque monkey performing a GO-NOGO visuomotor pattern discrimination task (Brovelli et al., 2004). We selected a segment of 300 milliseconds after stimulus onset for the GO condition from each of 350 trials recorded on 5 electrodes, and assigned them to sources in a human cortical surface at locations approximately corresponding to the original placement of the electrodes on the monkey cortical surface (Figure 1). Both focal dipole sources and extended patch sources were simulated. We modeled the geometry of a CTF 275-channel axial gradiometer MEG system (VSM MedTech Ltd., CTF Systems, Coquitlam, BC, Canada) and the lead field matrix was estimated using BrainStorm (Mosher et al., 2005) based on an overlapping spheres head model (Huang et al., 1999). Gaussian white noise was generated and added to the MEG sensors to model instrumentation noise with SNR=6. The SNR was defined as the ratio of the Frobenius norm of the signal-magnetic-field spatio-temporal matrix to that of the noise matrix for each trial as in Sekihara et al. (1997). Alternatively the SNR can be defined for each sources as the ratio of the Frobenius norm of its the magnetic field signal matrix in the sensor domain to that of the total noise matrix. For the focal dipole sources, the SNRs for each of the 5 sources are 1.57, 4.11, 2.34, 3.55 and 2.63; For the extended sources, the SNRs are 1.51, 2.48, 1.09, 3.38 and 2.90.
Figure 1.
Simulating cortical interactions with realistic oscillatory sources. (a) 5 dipole sources are selected on the cortical surface based on the locations of surface-to-depth electrodes in a macaque monkey experiment. LFPs from the implanted electrodes are assigned as time series to the sources. (b) MEG data are simulated by projecting the LFP signals to the channel topography of a 275-channel gradiometer MEG system. White Gaussian noise is added to the data. (c) Different inverse methods are used to produce cortical activation maps. (d) The estimated source signals are evaluated for cortical interactions using MVAR models, coherence, phase synchrony or other measures. (e) Significant interactions are found using permutation tests while controlling for multiple comparisons.
The source time series at the 5 locations of interest were estimated using the standard LCMV beamformer, nulling beamformer, and cortically constrained linear minimum L2 norm imaging. The different interaction measures (coherence, phase synchrony and MVAR model) were then applied to each of the sets of estimated time series.
3.2. MVAR analysis with focal sources
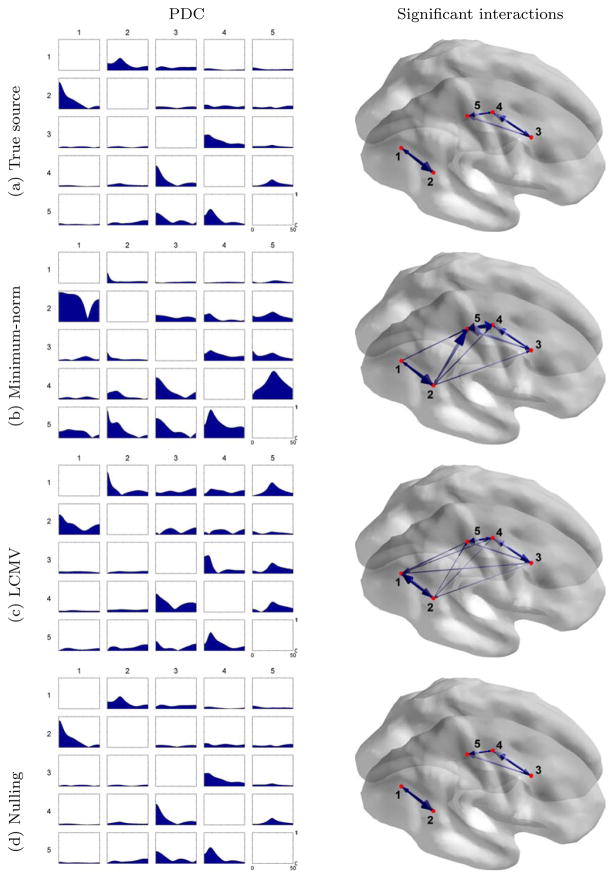
Figure 2 shows the estimated interaction network of the 5 dipole cortical sources with MVAR analysis. We used the Partial Directed Coherence (PDC) as our interaction measure, but we observed that the Directed Transfer Function (DTF) produced qualitatively similar results (see Baccala and Sameshima, 2001 for the differences between PDC and DTF). The MVAR model was fitted to the LFP time series representing the true sources, as well as the reconstructed time series with Tikhonov regularized minimum-norm (Tikhonov et al., 1977), LCMV beamformer and the nulling beamformer. For minimum-norm imaging, we chose the regularization parameter as 5% of the maximum singular value of the lead field matrix. We subtracted the ensemble mean from the true and estimated source signals to obtain the induced responses. The PDC results appear as a 5×5 matrix of subplots where the subplot at the i-th row and j-th column represents the interaction from cortical region j to region i. Because PDC between each region pair was computed as a frequency spectrum, we use the height of the shaded area to indicate the value of the computed PDC spectrum.
Figure 2.
(Left) PDC interaction measures for five dipole sources using different MEG inverse methods. Each subplot represents the PDC causal interaction between a pair of sources, where the subplot at i-th row and j-th column represents the causal interaction from source j to source i. The horizontal axis represents frequency from 0 to 50Hz, and the vertical axis represents the value of PDC in the range of [0, 1]. (Right) Significant PDC interactions found for five dipole sources with a permutation test at an α = 5% significance level corrected for multiple comparisons. The arrows represent the directions of causal interactions, with their radii indicating the maximal strengths of interactions over the [0, 50] Hz frequency band.
The permutation method described in Section 2.5 was used to threshold the interaction network at error level α = 5% with correction for multiple comparisons. For each permuted sample, we computed the maximum value of PDC over the frequency band of [0, 50] Hz for each pair of sources, then find the maximum among all pairs. We generated the empirical distribution of the maximum values from 2000 permutation samples. The PDC values above the threshold were regarded as significant interactions and shown in figure 2 (right).
The MVAR results from the nulling beamformer are in close agreement with those from the true source time series. This indicates that the absence of crosstalk prevented the inclusion of spurious interactions in the estimated network. In contrast, the MVAR results from the minimum-norm method and the LCMV beamformer are noticeably affected by linear mixing, producing both type I and II errors (false positives and true negatives). Even for source pairs where a true interaction is identified, the PDC measure is distorted as a result of linear mixing and has a different frequency profile.
3.3. MVAR analysis with extended cortical sources
As described before, the nulling beamformer successfully cancels linear mixing in the case of point sources where only one degree of freedom is needed per source. A more realistic simulation involves extended sources, where we assigned the same time series to neighboring surface elements representing a cortical patch. We assumed the activity is uniform within each patch. We used the same source locations as before, but simulated extended sources with patch sizes of approximately 8 cm2 each as shown in figure 3a. We then applied the nulling beamformer with eigenvector constraints as in (12), where we assumed the patch locations and sizes are exactly known (we will relax this assumption later).
Figure 3.
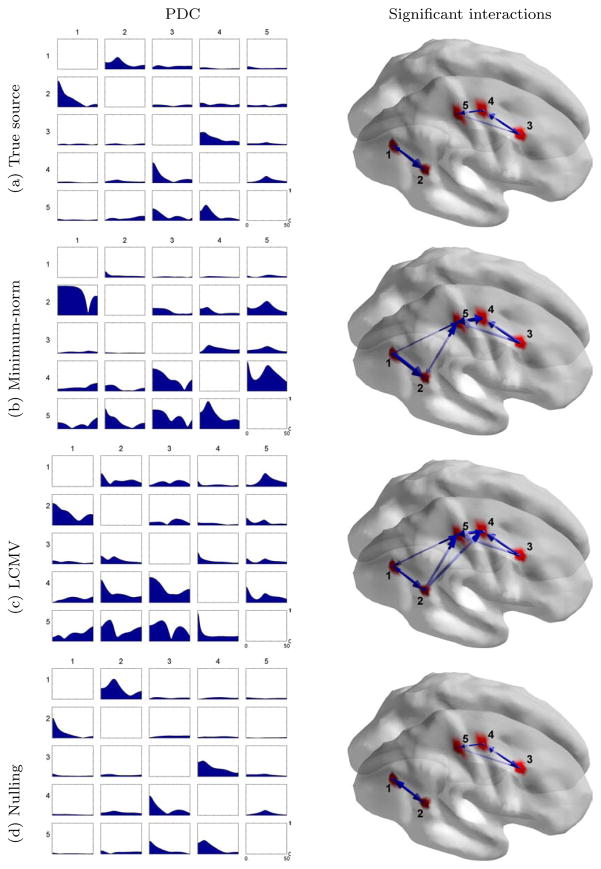
(Left) PDC interaction measures for cortical sources with extended sizes of approximately 8 cm2. (Right) Significant PDC interactions found for the five extended cortical sources with a permutation test at an α = 5% level corrected for multiple comparisons.
Since we relied on the principle eigenvectors to approximate the response for extended sources in (11), we first determined the number of eigenvector constraints L to be used for each source patch. Our criterion was to keep all eigenvectors with eigenvalues at least 10% of the maximal eigenvalue for each patch, which resulted in L = 4 for all the patches.
We applied the MVAR analysis to time series produced by the same inverse methods as before, and the results are shown in figure 3. For the minimum-norm method we computed the time series at the center of each cortical patch of interest. For LCMV, we used the same eigenvector constraints for each source patch in turn that were used in the nulling beamformer, but without the nulling constraints. The nulling beamformer with eigenvalue constraints reproduced the interactions present in the true source time series. This is not true for the minimum-norm and LCMV beamformer methods, where the linear mixing severely affected their performance.
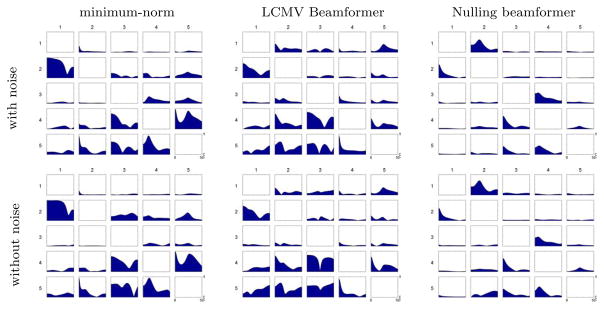
To test whether the inaccurate estimation of interactions in figure 3 is caused by cross-talk or the difference in residual noise level for each method, we applied the same inverse operators to the simulated MEG data without adding any noise. Figure 4 shows the estimated PDC with and without noise; the difference between them for each inverse operator is minimal, therefore most of the false interactions from minimum-norm and LCMV beamformer were not caused by the residual noise, but by cross-talk.
Figure 4.
(Top) PDC interactions computed using different inverse operators from simulated MEG data (with noise). (Bottom) PDC interactions computed using the same inverse operators but from simulated data without the noise. The difference between them shows the levels of false interactions caused by residual noise.
To test the reliability of the combination of nulling beamformer and MVAR analysis to detect interactions, we also performed bootstrap analysis as described in Section 2.5. Figure 5 shows the same MVAR interaction results as in figure 3 (a) and (d), but also with confidence interval lines plotted at ±2 standard errors. The nulling beamformer produces interactions with variability close to the variability of the true source interactions.
Figure 5.
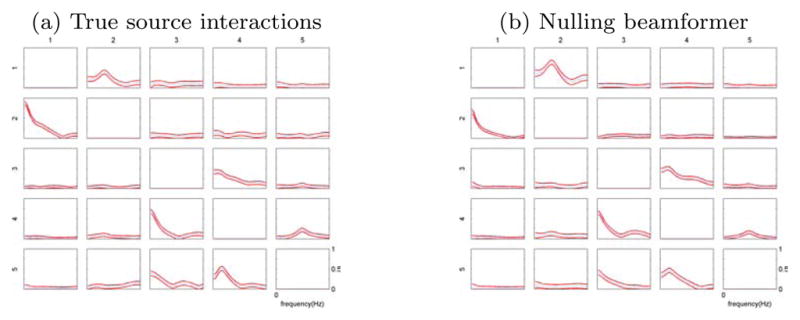
PDC interactions with confidence intervals. Interaction results are the same as in figure 3a and 3d, but overlaid with [−2σ, +2σ] confidence lines.
3.4. Nulling beamformer with other interactions measures
Even though we mainly used the nulling beamformer in conjunction with MVAR analysis, it has similar benefits when used with other interaction measures. Here we investigate the performance of the nulling beamformer with coherence and phase synchrony. We simulated the same extended sources as in Section 3.3 and estimated the source time series at the center of each region of interest using each of the inverse methods. We then computed the coherence and phase synchrony between each pair of the estimated signals.
In figure 6, we contrast the accuracy in measuring coherence using the nulling beamformer versus other inverse methods. The coherence between all pairs of extended cortical sources was estimated using all inverse methods. The nulling beamformer produces results very close to the true coherence across all frequencies. This is not the case with the LCMV beamformer and the minimum-norm method, which typically overestimate the coherence for all frequencies.
Figure 6.
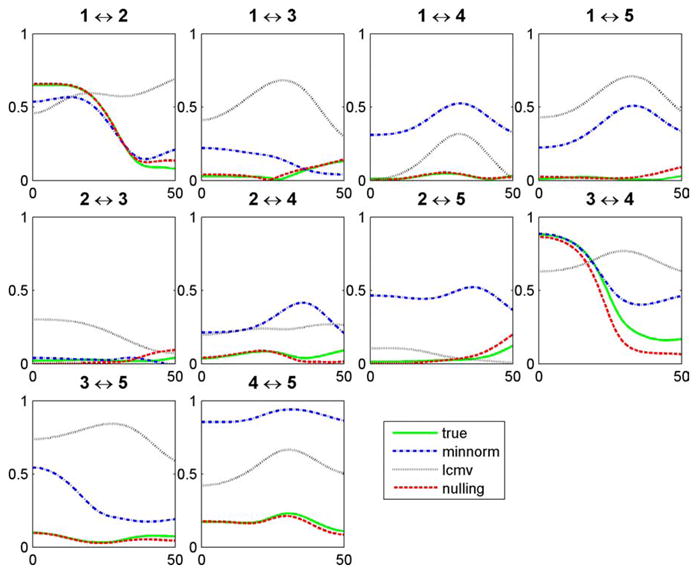
Coherence between all the possible pairs of extended cortical sources estimated using different inverse methods.
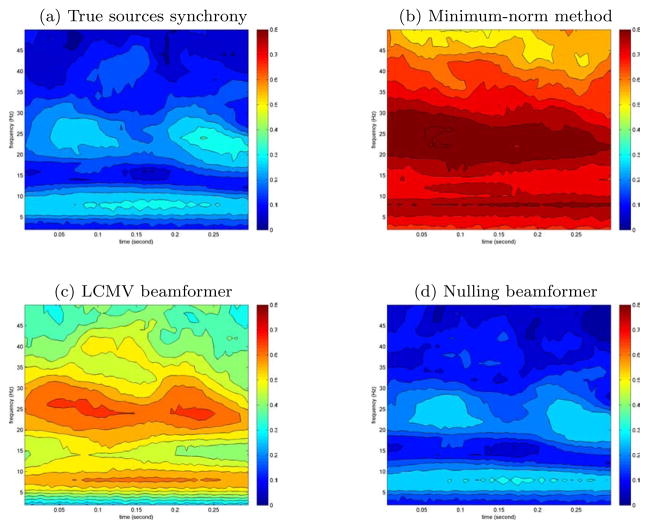
In addition to coherence, we also estimated the phase synchrony between sources 3 and 4 using the wavelet method (Lachaux et al., 1999; Le Van Quyen et al., 2001). The same extended sources were used as before, and the results from different inverse methods are shown in figure 7. The true source interaction has a phase synchrony peak at 10–15Hz and 0.1–0.3sec, which was accurately detected with the nulling beamformer. Both Minimum-norm and LCMV beamformer method overestimated the magnitude of the synchrony and identified additional false interactions.
Figure 7.
Phase synchrony between sources 3 and 4, computed using different inverse methods. The color scale shows the phase locking value between the two sources.
3.5. Robustness to inaccurate patch size
Here we relax the requirement that the nulling beamformer knows the exact locations and extents of the cortical sources. This is important, because we can only approximately specify the locations of cortical sources in practice. We used the same extended cortical source simulation data as in Section 3.3, but we now assume that the exact locations and sizes of the sources are unknown when calculating the nulling beamformer with (12). In particular, to design the nulling beamformer, we use larger patches to estimate the eigenvalue constraints. Those patches, shown in figure 8 (right), have sizes from 29 to 45 cm2 as compared to the 8 cm2 approximate sizes of the true cortical sources. We used L = 6 for the number of the eigenvector constraints for all the patches, based on the same criterion used in Section 3.3.
Figure 8.

Simulation of cortical sources in the case where we have limited knowledge of their true locations and extents. Left: true sources with approximately 8 cm2 spatial extents. Right: enlarged patches of around 29 to 45 cm2 spatial extents.
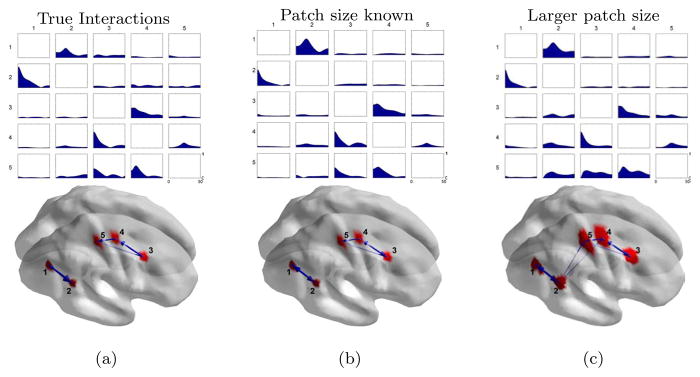
Figure 9 compares the PDC results for the true cortical sources, the nulling beamformer with known patch sizes and locations, and the nulling beamformer with larger patches that approximate the true sources. The PDC results from the larger regions are similar to those from the true interactions with the exception of small amount of false interactions from source 2 to source 5 and source 2 to source 4, which are detected as significant after permutation. Despite this false positive, the results demonstrate that the nulling beamformer has a certain degree of robustness to approximation of the cortical locations with substantially larger cortical patches.
Figure 9.
Top: PDC interaction measures computed using (a) the true LPF signal, and reconstructed time series using the nulling beamformer with (b) known patch sizes and (c) enlarged patch sizes. Bottom: significant PDC interactions at an α = 5% significance level after correcting for multiple comparisons using a permutation test.
3.6. Effect of noise
In this section we explore how noise affects the performance of the nulling beamformer, LCMV beamformer and minimum-norm in detecting cortical interactions. We consider not only white noise in the sensor domain, which models instrumentation noise, but also background brain activity. The latter was created using experimental data from the same MEG sensor configuration as our synthesized data, and it was recorded during a baseline period when the subject was resting with eyes open. We considered several levels of SNR for both sensor noise and background brain activity.
We define the PDC estimation error as the Frobenius norm of the difference between the estimated PDC and the ground truth. In figure 10 we show how the above error depends on the SNR level, and in figure 11 we show the estimated PDC coefficients for SNR=3 for all methods. The nulling beamformer has lower error than the LCMV beamformer and minimum-norm for all cases with SNR>0.75. Also, the nulling beamformer with point sources is more robust to noise than that with patch sources.
Figure 10.
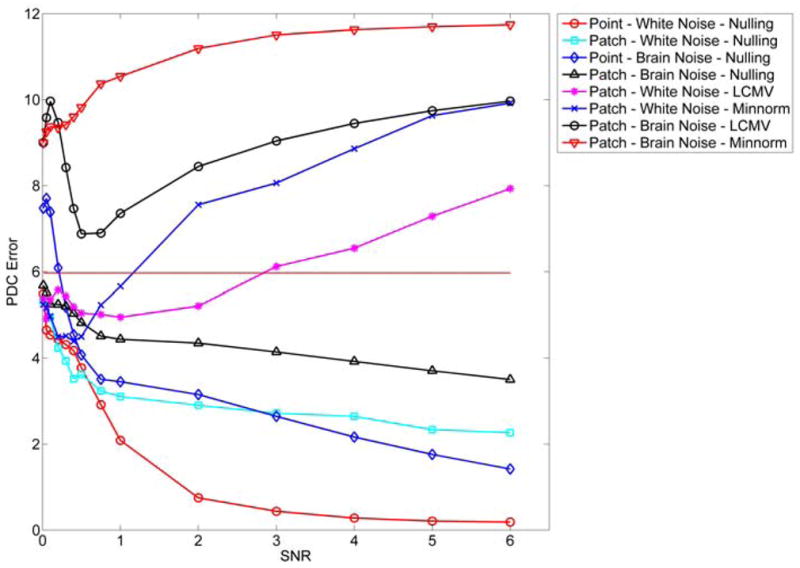
Comparison of the errors in estimated PDC interactions for different inverse methods and different noise level.
Figure 11.
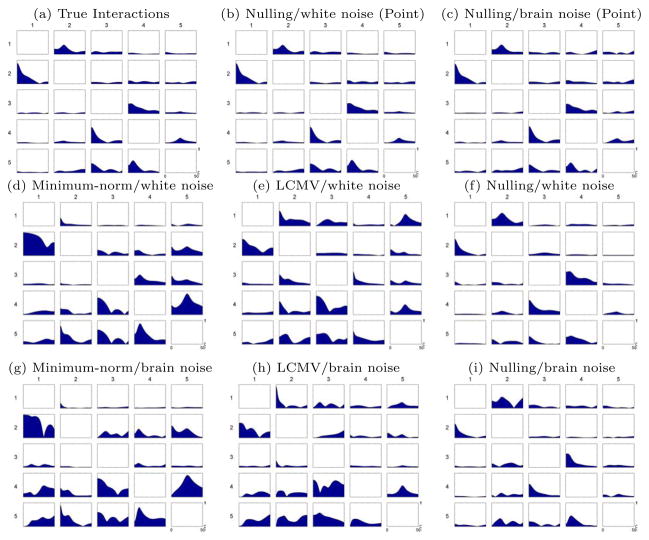
PDC interaction computed from different noise types with SNR=3: (a) the true interactions, (b) and (c) the interactions computed using nulling beamformer from dipole sources simulation with white noise and brain noise, (d), (e) and (f) from patch simulation with white noise using different inverse methods, (g), (h) and (i) from patch simulation with brain noise.
Ongoing brain activity affects the performance of all the methods more severely than channel white noise. This is expected, as ongoing brain activity lies in a similar subspace as our sources of interest, so cross-talk increases in all inverse methods. For example, in the nulling beamformer a large part of the brain noise lies in areas not explicitly canceled, therefore these signals can potentially leak to the true source locations.
Figure 10 reveals interesting behavior: PDC estimation error decreases for the nulling beamformer as SNR increases, but the opposite is true for the LCMV beamformer and minimum-norm. This potentially unexpected behavior of the LCMV beamformer and minimum-norm can be explained by considering how noise affects the estimated interactions. Without noise, both methods tend to overestimate interactions (figure 4 (top), versus figure 3a where the true interactions are shown). When noise is increased, both true and false interactions are suppressed (figure 11), and therefore approach the true interactions. At very low SNR levels, most methods produce an error close to 6, which is actually the Frobenius norm of the true interactions. Since we defined the error as the Frobenius norm of the difference between the estimated PDC and the ground truth PDC, this indicates that at very low SNR most methods estimate close to zero PDC in all frequencies. Therefore, the performance of LCMV and minimum-norm does not improve when the SNR increases. This is another indication that the cross-talk is the main sources of errors in both cases.
4. Discussion
The nulling beamformer accurately detected interactions in all cases tested, namely focal cortical sources, and patches with known or unknown exact locations and sizes. This is because it effectively suppressed interference from the nulled sources and therefore linear mixing was greatly reduced from these locations. Any interaction measure can be used in conjunction with the nulling beamformer. In contrast, when other inverse methods were used, interaction analysis was prone to significant errors because of linear mixing and/or signal cancellation.
Linear mixing can affect estimation of interactions in two ways. It may cause type I errors, in which case false interactions are detected when there is no true interaction, or type II errors, in which case we fail to detect the existing true interactions. For example, the minimum-norm and LCMV beamformer resulted in several type I errors in the MVAR analysis with focal and extended sources, including false interactions between sources 1 and 3, 2 and 4, 2 and 5, and many others in figure 2 and figure 3. Both the minimum-norm and LCMV beamformer produced type I errors in the estimation of coherence, and minimum-norm even produced type I errors in phase synchrony. Examples of type II errors include the failure of minimum-norm method to detect the PDC interaction from source 2 to 1 in the patch configuration (Figure 3).
We should note that the performance of the standard LCMV beamformer is highly dependent on the choice of the data used in estimating the data covariance in (4). Here we have selected a time window corresponding to the data for which we are interested in analyzing coherence as the basis for estimating the beamformer weights. In practice, using a different time window will produce a different response in the beamformer and hence different degrees of cross-talk. The important issue of the dependence of the beamformer on the time window used has recently been explored in Brookes et al. (2008).
In the presence of coherent source activity, the LCMV beamformer can cause signal cancellation, as mentioned in Section 2.1. Therefore, inaccurate estimation of source interactions with the LCMV beamformer can be caused either by linear mixing of incoherent third sources, or self cancellation of coherent ones.
An important limitation of the nulling beamformer is the requirement that we know the locations and extents of the sources to be canceled. However, we demonstrated that there is some tolerance in specifying the exact spatial configuration of the sources when eigenvalue constraints are used. In particular, when the exact locations of the sources are not known, we can use evidence from other inverse imaging methods or previously published studies to approximate the locations of activated cortical areas and force a null in the principal subspace of the corresponding patches. For cortical patches spanning a few cm2, a few eigenvalues are enough to null the majority of the subspace.
Our permutation approach relies on the fact that channel noise and ongoing brain activity in cortical areas outside the nulled sites have minimal impact on the estimated source time series with the nulling beamformer. In this case, the linear mixing primarily occurs between the identified cortical sites, and the nulling beamformer can effectively cancel it by zeroing the interfering sources. Therefore, the original data in the permutation test contain only the true interactions, which are completely destroyed by randomly exchanging the trial indices of each source in the permuted data. However, since we cannot completely ignore linear mixing from noise and other cortical sources, our permutation test is potentially not exact, but rather liberal; the original data have interactions due to linear mixing which are not canceled with the nulling beamformer, but are completely eliminated in the permutation samples. Our permutation test results in the MVAR analysis did not suffer from false positives when the locations of the sources were known, indicating that the method is relatively robust, but we cannot guarantee an exact α level control of the error rate in real data situations.
The bootstrapping analysis demonstrated that the MVAR models, when combined with the nulling beamformer, are reliable estimators of true cortical interactions. Since linear mixing is suppressed with the nulling beamformer, the only major variability in the interaction measurements is the one introduced by the MVAR model estimation.
In the simulation presented here, we used the orientation constrained version of the nulling beamformer. However, as indicated in the Methods section, the nulling beamformer can also be used with an orientation free source model, where the beamformer output will contain three orthogonal components for each source location. If the source has a predominantly fixed (but unknown) orientation, we can reduce the 3-component source to a scalar time series using a singular value decomposition and keeping only the principal component. Alternatively, if the source is more complex and cannot be adequately represented as a scalar time series, we can use measures that estimate interactions between vector time series, such as Granger Causality under Geweke’s formulation (Geweke, 1982), or canonical correlation analysis (Seber, 2004).
The nulling beamformer is more sensitive to noise than the LCMV beamformer for two reasons. First, because the nulling beamformer uses additional constraints to suppress the cross-talk, it has less degrees of freedom available to suppress noise than the LCMV beamformer. In our simulations, we observed that the white noise gain increased from the LCMV beamformer to the nulling beamformer. We also observed that the point constrained nulling beamformer had greater noise gain than the eigenvector constrained one. Second, when several spatial constraints are enforced, there is increased chance that the subspace of the nulling constraints has small subspace angles relative to the subspace for the unit constraints. This can cause the norm of the weight vectors to become larger, and therefore the noise gain increases. In our simulations, sources with small angles between the subspaces of the nulling and unit constraints had greater noise gain. Therefore, when designing a nulling beamformer, the overlap between the aforementioned subspaces should be considered. The estimation of the angle between subspaces is discussed in Bjorck and Golub (1973).
In comparing our network results to those in Brovelli et al. (2004), who used the same LFP data, we see some differences in the locations exhibiting significant interactions. This is due in part to differences in the time-window used for analysis. However, in exploring these differences further we found that PDC and Granger causality can produce interactions with different amplitudes from the same data. After testing for significance these differing amplitudes can result in differences in the final network model. While the methodological implications of these differences are clearly important, a comparison of different interaction measures is beyond the scope of this paper.
5. Conclusion
We have described a method to detect cortical interaction networks while at the same time controlling for linear mixing among several cortical sources. The method relies on the nulling beamformer and its extension with eigenvector constraints. We demonstrated that the method is superior to other inverse imaging methods, such as minimum norm imaging and conventional LCMV beamforming, in estimating cortical interactions.
Even though the nulling beamformer method is effective in addressing the cross-talk problem in cases where we approximately know the locations of the interfering sources, the information is not always known in real data experiments. Therefore, the nulling beamformer should be better viewed as a step towards ameliorating the linear mixing problem, rather than a complete solution. Careful interpretation of results and fine tuning of the eigenvector constraints are important for a reliable estimation of the interacting cortical sources.
Interaction measures insensitive to cross-talk, such as the imaginary part of the complex coherence (Nolte et al., 2004), provide another way of exploring cortical interaction networks. However, they also suffer from considerable limitations. For example, imaginary coherence is sensitive to time delay, and therefore completely blind to perfectly synchronous signals with zero time lag. Such a limitation does not exist with the nulling beamformer. For this reason, methods such as the nulling beamformer and imaginary coherence are complimentary, because they provide a different view of ongoing cortical networks, and they should both be considered when exploring experimental MEG and EEG data.
Acknowledgments
This work was supported by National Institute of Biomedical Imaging and BioEngineering under Grants No R01-EB002010 and No R01-EB000473.
Footnotes
Publisher's Disclaimer: This is a PDF file of an unedited manuscript that has been accepted for publication. As a service to our customers we are providing this early version of the manuscript. The manuscript will undergo copyediting, typesetting, and review of the resulting proof before it is published in its final citable form. Please note that during the production process errors may be discovered which could affect the content, and all legal disclaimers that apply to the journal pertain.
References
- Andrzejak R, Kraskov A, Stgbauer H, Mormann F, Kreuz T. Bivariate surrogate techniques: Necessity, strengths, and caveats. Phys Rev E J1 - PRE. 2003;68 (6):066202. doi: 10.1103/PhysRevE.68.066202. [DOI] [PubMed] [Google Scholar]
- Astolfi L, Cincotti F, Mattia D, De Vico Fallani F, Tocci A, Colosimo A, Salinari S, Marciani M, Hesse W, Witte H, Ursino M, Zavaglia M, Babiloni F. Tracking the time-varying cortical connectivity patterns by adaptive multivariate estimators. Biomedical Engineering, IEEE Transactions. 2008 March;55 (3):902–913. doi: 10.1109/TBME.2007.905419. [DOI] [PubMed] [Google Scholar]
- Babiloni F, Cincotti F, Babiloni C, Carducci F, Mattia D, Astolfi L, Basilisco A, Rossini P, Ding L, Ni Y. Estimation of the cortical functional connectivity with the multimodal integration of high-resolution EEG and fMRI data by directed transfer function. NeuroImage. 2005;24 (1):118–131. doi: 10.1016/j.neuroimage.2004.09.036. [DOI] [PubMed] [Google Scholar]
- Baccala LA, Sameshima K. Partial directed coherence: a new concept in neural structure determination. Biological Cybernetics. 2001;84 (6):463–474. doi: 10.1007/PL00007990. [DOI] [PubMed] [Google Scholar]
- Baillet S, Mosher J, Leahy R. Electromagnetic brain mapping. Signal Processing Magazine, IEEE. 2001;18 (6):14–30. [Google Scholar]
- Bjorck, Golub Numerical methods for computing angles between linear subspaces. Mathematics of computation. 1973:579–594. [Google Scholar]
- Bressler SL, Coppola R, Nakamura R. Episodic multiregional cortical coherence at multiple frequencies during visual task performance. Nature. 1993;366 (6451):153–156. doi: 10.1038/366153a0. [DOI] [PubMed] [Google Scholar]
- Brookes M, Stevenson C, Barnes G, Hillebrand A, Simpson M, Francis S, Morris P. Beamformer reconstruction of correlated sources using a modified source model. NeuroImage. 2007;34 (4):1454–1465. doi: 10.1016/j.neuroimage.2006.11.012. [DOI] [PubMed] [Google Scholar]
- Brookes MJ, Vrba J, Robinson SE, Stevenson CM, Peters AM, Barnes GR, Hillebrand A, Morris PG. Optimising experimental design for MEG beamformer imaging. NeuroImage. 2008 Feb;39 (4):1788–1802. doi: 10.1016/j.neuroimage.2007.09.050. [DOI] [PubMed] [Google Scholar]
- Brovelli A, Ding M, Ledberg A, Chen Y, Nakamura R, Bressler SL. Beta oscillations in a large-scale sensorimotor cortical network: Directional influences revealed by Granger causality. PNAS. 2004;101 (26):9849–9854. doi: 10.1073/pnas.0308538101. [DOI] [PMC free article] [PubMed] [Google Scholar]
- Carter G. Coherence and time delay estimation. Proceedings of the IEEE. 1987;75 (2):236–255. [Google Scholar]
- Carter G, Knapp C, Nuttall A. Estimation of the magnitude-squared coherence function via overlapped fast fourier transform processing. Audio and Electroacoustics, IEEE Transactions. 1973;21 (4):337–344. [Google Scholar]
- Dalal S, Sekihara K, Nagarajan S. Modified beamformers for coherent source region suppression. Biomedical Engineering, IEEE Transactions. 2006;53 (7):1357–1363. doi: 10.1109/TBME.2006.873752. [DOI] [PMC free article] [PubMed] [Google Scholar]
- Dale AM, Liu AK, Fischl BR, Buckner RL, Belliveau JW, Lewine JD, Halgren E. Dynamic statistical parametric mapping: combining fMRI and MEG for high-resolution imaging of cortical activity. Neuron. 2000;26 (1):55–67. doi: 10.1016/s0896-6273(00)81138-1. [DOI] [PubMed] [Google Scholar]
- Darvas F, Pantazis D, Kucukaltun-Yildirim E, Leahy R. Mapping human brain function with MEG and EEG: methods and validation. NeuroImage Mathematics in Brain Imaging. 2004;23 (Supplement 1):S289–S299. doi: 10.1016/j.neuroimage.2004.07.014. [DOI] [PubMed] [Google Scholar]
- Ding M, Bressler SL, Yang W, Liang H. Short-window spectral analysis of cortical event-related potentials by adaptive multivariate autoregressive modeling: data preprocessing, model validation, and variability assessment. Biological cybernetics. 2000;83 (1):35–45. doi: 10.1007/s004229900137. [DOI] [PubMed] [Google Scholar]
- Gardner WA. A unifying view of coherence in signal processing. Signal Process. 1992;29 (2):113–140. [Google Scholar]
- Geweke J. Measurement of linear dependence and feedback between multiple time series. Journal of the American Statistical Association. 1982;77 (378):304–313. [Google Scholar]
- Gow D, Segawa J, Ahlfors S, Lin F. Lexical influences on speech perception: A Granger causality analysis of MEG and EEG source estimates. Neuroimage. 2008;43 (3):614–623. doi: 10.1016/j.neuroimage.2008.07.027. [DOI] [PMC free article] [PubMed] [Google Scholar]
- Granger CWJ. Investigating causal relations by econometric models and cross-spectral methods. Econometrica. 1969;37 (3):424–438. [Google Scholar]
- Granger CWJ. Testing for causality: A personal viewpoint. Journal of Economic Dynamics and Control. 1980;2:329–352. [Google Scholar]
- Gross J, Kujala J, Hamalainen M, Timmermann L, Schnitzler A, Salmelin R. Dynamic imaging of coherent sources: Studying neural interactions in the human brain. Proceedings of the National Academy of Sciences. 2001;98 (2):694–699. doi: 10.1073/pnas.98.2.694. [DOI] [PMC free article] [PubMed] [Google Scholar]
- Hadjipapas A, Hillebrand A, Holliday IE, Singh KD, Barnes GR. Assessing interactions of linear and nonlinear neuronal sources using MEG beamformers: a proof of concept. Clinical Neurophysiology. 2005;116 (6):1300–1313. doi: 10.1016/j.clinph.2005.01.014. [DOI] [PubMed] [Google Scholar]
- Huang MX, Mosher JC, Leahy RM. A sensor-weighted overlapping-sphere head model and exhaustive head model comparison for MEG. Physics in Medicine and Biology. 1999;44 (2):423–440. doi: 10.1088/0031-9155/44/2/010. [DOI] [PubMed] [Google Scholar]
- Hui HB, Leahy RM. Linearly constrained MEG beamformers for MVAR modeling of cortical interactions. Biomedical Imaging: Nano to Macro; 2006; 3rd IEEE International Symposium; 2006. pp. 237–240. [Google Scholar]
- Jeffs B, Leahy R, Singh M. An evaluation of methods for neuromagnetic image reconstruction. Biomedical Engineering, IEEE Transactions on BME-34. 1987;(9):713–723. doi: 10.1109/tbme.1987.325996. [DOI] [PubMed] [Google Scholar]
- Kaminski M, Ding M, Truccolo WA, Bressler SL. Evaluating causal relations in neural systems: granger causality, directed transfer function and statistical assessment of significance. Biol Cybern. 2001;85 (2):145–57. doi: 10.1007/s004220000235. [DOI] [PubMed] [Google Scholar]
- Kus R, Kaminski M, Blinowska K. Determination of EEG activity propagation: pair-wise versus multichannel estimate. Biomedical Engineering, IEEE Transactions. 2004;51 (9):1501–1510. doi: 10.1109/TBME.2004.827929. [DOI] [PubMed] [Google Scholar]
- Lachaux JP, Baillet S, Adam C, Ducorps A, Jerbi K, Bertrand O, Garnero L, Martinerie J. A simultaneous MEG and intracranial EEG study of task-related brain oscillations. International Congress Series New Frontiers in Biomagnetism Proceedings of the 15th International Conference on Biomagnetism; Vancouver, BC, Canada. August 21–25, 2006; 2007. pp. 421–424. [Google Scholar]
- Lachaux JP, Rodriguez E, Martinerie J, Varela F. Measuring phase synchrony in brain signals. Human Brain Mapping. 1999;8 (4):194–208. doi: 10.1002/(SICI)1097-0193(1999)8:4<194::AID-HBM4>3.0.CO;2-C. [DOI] [PMC free article] [PubMed] [Google Scholar]
- Le Van Quyen M, Foucher J, Lachaux JP, Rodriguez E, Lutz A, Martinerie J, Varela FJ. Comparison of Hilbert transform and wavelet methods for the analysis of neuronal synchrony. Journal of Neuroscience Methods. 2001;111 (2):83–98. doi: 10.1016/s0165-0270(01)00372-7. [DOI] [PubMed] [Google Scholar]
- Lutkenhoner B, Greenblatt R, Hamalainen M, Mosher J, Scherg M, Tesche C, Sosa PV. Comparison between different approaches to the biomagnetic inverse problem - workshop report.1996. [Google Scholar]
- Mosher J, Baillet S, Darvas F, Pantazis D, Kucukaltun-Yildirim E, Leahy R. BrainStorm electromagnetic imaging software. International Journal of Bioelectromagnetism 2005 [Google Scholar]
- Mosher J, Lewis P, Leahy R. Multiple dipole modeling and localization from spatio-temporal MEG data. Biomedical Engineering, IEEE Transactions. 1992;39 (6):541–557. doi: 10.1109/10.141192. [DOI] [PubMed] [Google Scholar]
- Nichols T, Holmes A. Nonparametric permutation tests for functional neuroimaging: A primer with examples. Human Brain Mapping. 2002;15 (1):1–25. doi: 10.1002/hbm.1058. [DOI] [PMC free article] [PubMed] [Google Scholar]
- Nolte G, Bai O, Wheaton L, Mari Z, Vorbach S, Hallett M. Identifying true brain interaction from EEG data using the imaginary part of coherency. Clinical Neurophysiology. 2004;115 (10):2292–2307. doi: 10.1016/j.clinph.2004.04.029. [DOI] [PubMed] [Google Scholar]
- Nunez PL, Srinivasan R, Westdorp AF, Wijesinghe RS, Tucker DM, Silberstein RB, Cadusch PJ. EEG coherency: I: statistics, reference electrode, volume conduction, laplacians, cortical imaging, and interpretation at multiple scales. Electroencephalography and Clinical Neurophysiology. 1997;103 (5):499–515. doi: 10.1016/s0013-4694(97)00066-7. [DOI] [PubMed] [Google Scholar]
- Pantazis D, Nichols TE, Baillet S, Leahy RM. A comparison of random field theory and permutation methods for the statistical analysis of MEG data. NeuroImage. 2005;25 (2):383–394. doi: 10.1016/j.neuroimage.2004.09.040. [DOI] [PubMed] [Google Scholar]
- Pascual-Marqui RD. Standardized low-resolution brain electromagnetic tomography (sLORETA): technical details. Methods Find Exp Clin Pharmacol. 2002;24(Suppl D):5–12. [PubMed] [Google Scholar]
- Prichard D, Theiler J. Generating surrogate data for time series with several simultaneously measured variables. Phys Rev Lett J1 - PRL. 1994;73 (7):951–954. doi: 10.1103/PhysRevLett.73.951. [DOI] [PubMed] [Google Scholar]
- Reddy V, Paulraj A, Kailath T. Performance analysis of the optimum beamformer in the presence of correlated sources and its behavior under spatial smoothing. Acoustics, Speech, and Signal Processing [see also IEEE Transactions on Signal Processing], IEEE Transactions. 1987;35 (7):927–936. [Google Scholar]
- Robinson S, Vrba J. Recent Advances in Biomagnetisml. Japan: Tohoku Univ. Press; 1999. Functional neuroimaging by synthetic aperture magnetometry (SAM) pp. 302–305. [Google Scholar]
- Sameshima K, Baccal LA. Using partial directed coherence to describe neuronal ensemble interactions. J Neurosci Methods. 1999 Dec;94 (1):93–103. doi: 10.1016/s0165-0270(99)00128-4. [DOI] [PubMed] [Google Scholar]
- Scherg M, Von Cramon D. Two bilateral sources of the late AEP as identified by a spatio-temporal dipole model. Electroencephalogr Clin Neurophysiol. 1985;62 (1):32–44. doi: 10.1016/0168-5597(85)90033-4. [DOI] [PubMed] [Google Scholar]
- Seber G. Multivariate observations 2004 [Google Scholar]
- Sehatpour P, Molholm S, Schwartz TH, Mahoney JR, Mehta AD, Javitt DC, Stanton PK, Foxe JJ. A human intracranial study of long-range oscillatory coherence across a frontal-occipital-hippocampal brain network during visual object processing. Proceedings of the National Academy of Sciences. 2008;105 (11):4399–4404. doi: 10.1073/pnas.0708418105. [DOI] [PMC free article] [PubMed] [Google Scholar]
- Sekihara K, Nagarajan S, Poeppel D, Marantz A, Marantz A, Miyashita Y, Miyashita Y. Reconstructing spatio-temporal activities of neural sources using an MEG vector beamformer technique. Biomedical Engineering, IEEE Transactions. 2001;48 (7):760–771. doi: 10.1109/10.930901. [DOI] [PubMed] [Google Scholar]
- Sekihara K, Poeppel D, Marantz A, Koizumi H, Miyashita Y. Noise covariance incorporated meg-music algorithm: a method for multiple-dipole estimation tolerant of the influence of background brain activity. Biomedical Engineering, IEEE Transactions. 1997 Sept;44 (9):839–847. doi: 10.1109/10.623053. [DOI] [PubMed] [Google Scholar]
- Spencer M, Leahy R, Mosher J, Lewis P. Adaptive filters for monitoring localized brain activity from surface potential time series. Oct 1992;1:156–161. [Google Scholar]
- Sutherling WW, Crandall PH, Darcey TM, Becker DP, Levesque MF, Barth DS. The magnetic and electric fields agree with intracranial localizations of somatosensory cortex. Neurology. 1988;38 (11):1705–1714. doi: 10.1212/wnl.38.11.1705. [DOI] [PubMed] [Google Scholar]
- Tikhonov A, Arsenin V, John F. Solutions of ill-posed problems. VH Winston; Washington, DC: 1977. [Google Scholar]
- Van Veen B, Buckley K. Beamforming: a versatile approach to spatial filtering. ASSP Magazine, IEEE. 1988;5 (2):4–24. [Google Scholar]
- Van Veen B, Van Drongelen W, Yuchtman M, Suzuki A. Localization of brain electrical activity via linearly constrained minimum variance spatial filtering. Biomedical Engineering, IEEE Transactions. 1997;44 (9):867–880. doi: 10.1109/10.623056. [DOI] [PubMed] [Google Scholar]


