Abstract
We introduce a mathematical framework for computing geometrical properties of white matter fibres directly from diffusion tensor fields. The key idea is to isolate the portion of the gradient of the tensor field corresponding to local variation in tensor orientation, and to project it onto a coordinate frame of tensor eigenvectors. The resulting eigenframe-centered representation then makes it possible to define scalar indices (or measures) that describe the local white matter geometry directly from the diffusion tensor field and its gradient, without requiring prior tractography. We derive new scalar indices of (1) fibre dispersion and (2) fibre curving, and we demonstrate them on synthetic and in vivo data. Finally, we illustrate their applicability to a group study on schizophrenia.
Keywords: Diffusion Tensor Imaging, Magnetic Resonance Imaging, Fibre Geometry, Rotation Tangents, Fibre Dispersion, Fibre Curving, Schizophrenia
1 Introduction
Despite the advent of high angular resolution diffusion imaging techniques, diffusion tensor imaging (DTI) data continues to be commonly acquired and utilized in a variety of studies in neuroscience and medicine, in particular in clinical settings (e.g. [21,31]). Empirically established connections to biological tissue properties make DTI a uniquely powerful imaging modality. These connections are apparent when the diffusion tensors are mapped to well understood scalar metrics, such as the trace of the diffusion tensor (the average of its eigenvalues), which has been linked to ischemic stroke detection [36], or the anisotropy of the tensor, which has been related to the microstructural organisation of white matter tissue [11]. The introduction of the tensor model in diffusion MRI [7] led to the now well established use of tensor-derived scalar measures such as trace and fractional anisotropy (FA) as biologically meaningful descriptors of the structure in a tensor field (e.g. [5,6,29,39]). In addition, a rich set of increasingly sophisticated and abstract tensor analysis methods based on Euclidean (e.g. [1,8,27]) or Riemannian (e.g. [10,38,23,22,28,2,14,3]) geometry has been developed. These methods introduced a variety of metrics that quantify tensor similarity (between two tensors) and variation (within a tensor field), which have been incorporated in several different applications such as tractography, tensor field segmentation, regularization, interpolation.
In [19], Kindlmann et al. emphasised the need to develop models for diffusion tensor field analysis in terms of biologically meaningful parameters. They introduced a framework for expressing the six degrees of freedom of a diffusion tensor in terms of shape and orientation. At each location in a tensor field, they built an orthonormal reference frame with three shape-based components, called invariant gradients, which describe variations in tensor shape, and three orientation-based components, called rotation tangents, which capture variations in tensor orientation.
In this article, we use the framework of Kindlmann et al. [19] to perform a differential analysis of diffusion tensor fields, leading to novel methods for the recovery of white matter geometrical indices, directly from the tensor data. By isolating the portion of the gradient of the tensor field corresponding to local variation in tensor orientation, and by projecting it onto a coordinate frame of tensor eigenvectors, we achieve an eigenframe-centered representation of local tensor field configurations. Given that the principal eigenvector generally represents the dominant orientation of the underlying fibre population [24], this allows us to define measures of fibre curving and fibre dispersion.
Since our analysis is a differential one, based on tensor field gradients, it allows us to characterize white matter beyond the single voxel scale. At the same time, we compute white matter geometry based on information intrinsic to the data, instead of requiring prior tractography as in e.g. [9]. This makes the approach independent from errors in the tractography process, and from the need for establishing explicit point correspondences along tracts where tangent vector differences are to be computed. It also makes the approach consistent with the idea of differential geometry based “stains” proposed by Basser in [5], where he argues that in addition to measures based on individual tensors, the information found in patterns of tensors and their differential structure may yield new insights into tissue organisation, structure and function.
Such insights can be obtained by applying our scalar indices to the study of local fibre organisation in the context of population studies. As a proof-of-concept, we carry out a group study on schizophrenia, where we find differences in local fibre geometry between patients and normal controls. Schizophrenia is considered to be a disease that affects white matter connectivity in the brain [4,15], and results in subtle but important changes in the white matter [4,15,21]. Although the exact nature of these changes is still not entirely clear, our scalar indices may be useful to detect and quantify those changes that affect white matter geometry. Of course, the study of other diseases affecting the white matter may benefit from these methods as well. Other potential applications, to be pursued in future work, include the use of the indices in tractography, e.g. as geometrical priors, as well as in a context of registration as geometrical landmarks.
White matter geometry has been the topic of several methodology studies in diffusion MRI, and has been applied to tasks such as tractography, regularization, white matter tract clustering and segmentation, e.g. [13,9,12,34,25]. Many of these methods first perform tractography and then compute geometrical properties (e.g., curvature and torsion) of the recovered tracts. They typically reparametrize the reconstructed tracts using a representative geometric model, or they approximate Frenet’s formulas for the differential geometry of curves [26] by computing tangent vector variations along curves. Tractography, however, is an non trivial process that depends on a multitude of parameters, and any flaws in the tractography will inevitably be reflected in the subsequent analysis. Furthermore, most research on white matter geometry is concerned with the geometry of individual curves. When needed, the geometry of sets of curves is often obtained by mapping individual curves to an average representation, e.g. [12,25]. This mapping may often result in the loss of structural information, and it may often involve heuristic decisions in the choice of corresponding tract points or segments, fibre similarity measures, etc.
A more formal treatment of the geometry of 3D curve sets in a diffusion MRI context is presented in [35,32]. The key idea there is to compute locally three curvature functions which describe how the tangent vector changes along the curve and in directions orthogonal to it. A drawback of this method is a computationally intensive implementation which requires the optimal fitting of a local geometric model to the data. Nevertheless, the idea of considering tangent vector variations not only along a curve, as in the classical Frenet equations [26], but also across ensembles of curves, is a very compelling one. For example, the degree to which a population of curves varies in a direction orthogonal to the tangent may be a basis for quantifying the extent to which the curves deviate from parallelism, and for defining a notion of fibre fanning, or dispersion. This idea is one of the motivations of the work presented here.
2 Mathematical model
2.1 Rotation tangents: background
Our method is based on the mathematical framework developed in [19,20]. Let F: ℝ3 ↦ Sym3 be a diffusion tensor field, such that F(x) = D, a diffusion tensor with components Dij. Here Sym3 denotes the set of symmetric tensors (D = DT) in ℝ3 ⊗ ℝ3. Consider the tensor rotation function ψ which rotates D with rotation matrix R ∈ SO3, the group of rotations on ℝ3:
| (1) |
In [19], the rotation tangent Φp (D) associated with eigenvector ep (p ∈ {1, 2, 3}) of diffusion tensor D is defined as the change of tensor value due to infinitesimal rotations around ep:
| (2) |
where Rep(φ) denotes rotation by angle φ around ep. The partial derivative with respect to the rotation angle φ is measured at φ = 0 in order to approximate an infinitesimal rotation.
The rotation tangent Φp (D) is a second order tensor onto which the tensor field gradient ∇F(x) can be projected, in order to obtain three spatial gradients of orientation [19]:
| (3) |
Here “:” is the tensor contraction operator (analogous to the vector dot product), Φ̂p are unit-norm rotation tangents, and ∇φ̂p are vectors that indicate in ℝ3 the direction in which the tensor orientation around eigenvector ep varies the fastest.
In our work, gradient computations are performed as described in [19] and as implemented in [17], through a convolution-based approach which follows closely the method proposed by Pajevic et al. in [27]. We construct kernels that represent the partial derivatives of a separable uniform cubic B-spline. The linearity of convolution and differentiation makes possible the computation of the partial derivatives of the tensor field.
2.2 Scalar geometric indices: overview
The work presented in [35,32] argues for the representation of white matter fibre geometry (and that of sets of 3D curves in general) in terms of local coordinate frames. The idea is to capture the differential geometry of 3D curves by measuring changes in the tangent vector orientation in three mutually orthogonal directions provided by the tangent, normal and bi-normal vectors of a local coordinate frame. The projection of the change of tangent vector orientation in these three directions results in three curvature functions which characterize locally the differential geometry of 3D curve sets.
Motivated by this approach, in this paper we consider the projection of the three ∇φ̂p (3) into the local coordinate frame provided by the tensor eigenvectors. One can form a total of nine such projections ∇φ̂p · eq, p, q ∈ {1, 2, 3}. We choose the eigenframe as a projection basis due to the biological significance of tensor eigenvectors. It is commonly accepted that the principal eigenvector is aligned with the underlying white matter fibre tract in voxels where the diffusion anisotropy is strong enough (e.g. [24]). We can thus relate patterns of tensor organisation to the geometry of white matter fibres.
Given the assumption that e1 represents the local fibre tangent direction, one can establish correspondences between observed tensor configurations and local fibre configurations. For example, ∇φ̂2 · e1 and ∇φ̂3 · e1 measure tangential change in tensor orientation (i.e. change in the tensor field seen by an observer displacing locally in the direction parallel to e1), which is analogous to the classical Frenet curvature, or the tangential curvature [35], of the underlying fibre. On the other hand, the projection of ∇φ̂2 and ∇φ̂3 in the plane spanned by e2 and e3 measures fibre orientation changes in directions orthogonal to e1. This is analogous to the normal and bi-normal curvatures of [35]. Finally, tensor rotations around e1, captured by ∇φ̂1, would correspond to fibre twist.
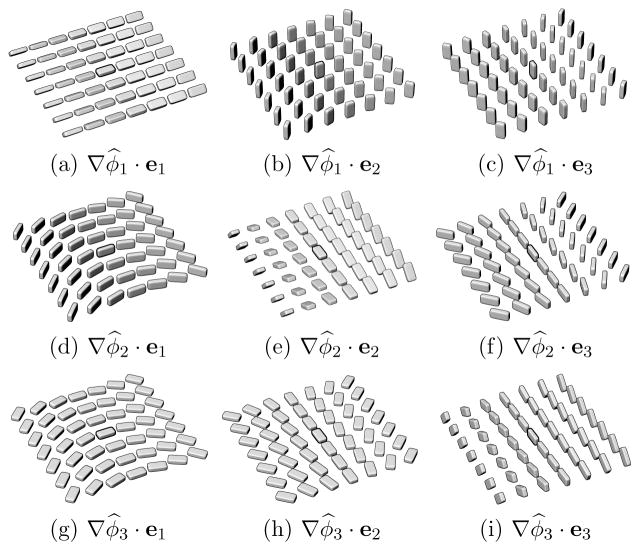
Figure 1 illustrates a variety of local tensor configurations characterized by orientation change, for the nine possible combinations of tensor rotation around an eigenvector ep observed in the direction of another eigenvector eq. For each example configuration, the projection ∇φ̂p · eq will result in a high value (the specific values for p and q are indicated for each case).
Fig. 1.
Examples of local tensor field configurations that show a high value for a particular projection of the form ∇φ̂p · eq.
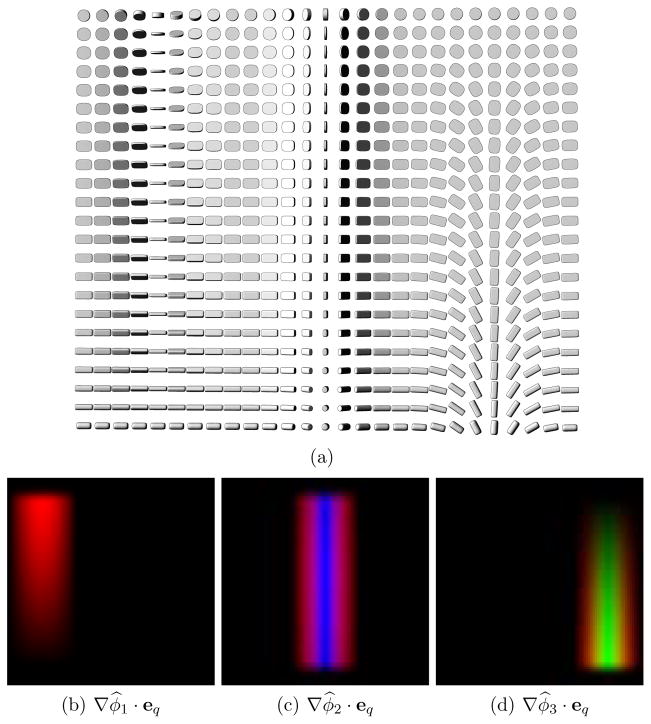
Figure 2 illustrates these projections on a 2D synthetic diffusion tensor field with gradients in tensor orientation (Fig. 2(a)). The dataset is constructed to have three vertical regions of tensor rotation, one around each eigenvector. In this example, tensor trace and FA are kept constant throughout the field, while tensor mode increases linearly from top to bottom (see [19] for a definition of tensor mode). Note how the projections shown in Fig. 2(b,c,d) are dependent on tensor shape. For instance, ∇φ̂p · e1 has lower values in the bottom left part of Fig. 2(b), where the tensors have a cylindrical shape. This is because rotations around e1 do not produce a significant change in the tensor field when the tensors are nearly cylindrical (with λ2 ≈ λ3). Similarly, rotation around e3 has little effect on tensors with a nearly disk shape (with λ2 ≈ λ3), and ∇φ̂3 and its eigenframe projections go to zero, as can be seen in the upper right part of Fig. 2(d).
Fig. 2.
(a) A 2D synthetic diffusion tensor field. (b,c,d) Results of projecting ∇φ̂p onto the local tensor eigenframe, with pixel intensities proportional to the projection result. Red: ∇φ̂p · e1. Green: ∇φ̂p · e2. Blue: ∇φ̂p · e3.
2.3 Dispersion and curving indices
We formalize the above observations by defining a local scalar index of fibre curving,  , and a local scalar index of fibre dispersion,
  :
:
| (4) |
| (5) |
Here “:”is the tensor contraction operator, and ⊗ represents the outer product (also known as the tensor product). The indices in (4) and (5) combine the rotation tangents ∇φ̂2 and ∇φ̂3 into a single second order tensor (∇φ̂2 ⊗ ∇φ̂2 + ∇φ̂3 ⊗ ∇φ̂3), which is then projected onto another second order tensor that represents the fibre tangent direction in the case of the curving measure (4), or the plane orthogonal to that direction in the case of (5). The use of outer products and tensor contractions sidesteps the sign ambiguity inherent in both the eigenvectors and the rotation tangents of [19].
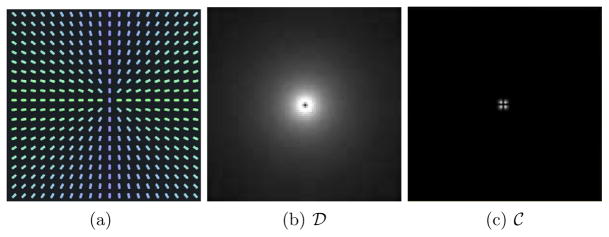
Figures 3 and 4 illustrate the dispersion  and curving
  indices, respectively, on one dispersing and one curving synthetic tensor dataset, where the tensors have all the same three eigenvalues. The dispersing tensors are aligned radially with respect to an origin, whereas the tensors in the curving field are tangent to a series of concentric circles with a common center (origin). In Fig. 3, the dispersion index is higher near the origin of the fanning, and decreases with distance. The same effect is observed in Fig. 4 with the curving index. With both measures, the origin itself is a singular point since the tensor orientation there is ill-defined. One may also note that the two measures are rotationally-invariant. In these examples, if the curving index is computed on the dispersing field, or the dispersion measure is computed on the curving field, the result is zero except in the regions of large tensor orientation changes near the origin, which may be interpreted as either curving or dispersion. Note that the two measures are not mutually exclusive.
Fig. 3.
(a) A downsampled visualization of a 100 × 100 synthetic diffusion tensor dataset. Here the color coding represents the orientation of the principal eigenvector - green denotes a horizontal orientation, blue denotes a vertical one. (b) The dispersion measure  . (c) The curving measure
  .
.
Fig. 4.
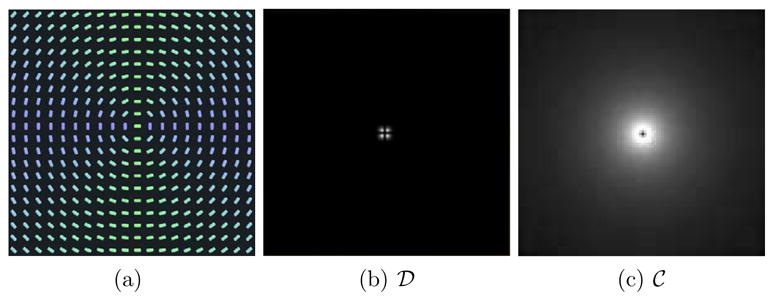
(a) A downsampled visualization of a 100 × 100 synthetic diffusion tensor dataset, with the same color coding as in Fig. 3 (a), (b) The dispersion measure  . (c) The curving measure
  .
.
As seen in Fig. 2, the value of projections of the form ∇φ̂p · eq is modulated by tensor shape. The dispersion and curving indices are consequently also modulated by tensor shape, and this effect is examined further in Section 3.1.1, where the indices are computed on synthetic tensor data with varying FA, mode, and norm (see [19] for a definition of tensor norm). In order to define mathematically the relation between tensor shape and our geometrical indices, in Appendix II we expand (3) and present a derivation that links the dispersion and curving measures to the spatial derivatives of tensor elements D12 and D13. Thus, our indices measure rates of change of tensor orientation (the tensor eigenvectors) weighted by the tensor shape (the eigenvalues). It is known that the off-diagonal tensor elements represent the correlation of diffusion in the x, y and z directions [5,30]. As presented in Appendix II, computing our indices amounts to measuring directional changes in these correlations.
In this paper, we do not propose measures involving ∇φ̂1. Unlike the geometry captured by ∇φ̂2 and ∇φ̂3, tensor rotations around e1 do not reflect a change in the fibre tangent direction. Rather, they capture rotations of the diffusion profile around the fibre tangent. Such rotations may be particularly sensitive to noise, and their biological meaning is not immediately clear. We thus leave their study for future work.
3 Experiments and results
3.1 Synthetic data validation
3.1.1 Variation with respect to tensor shape
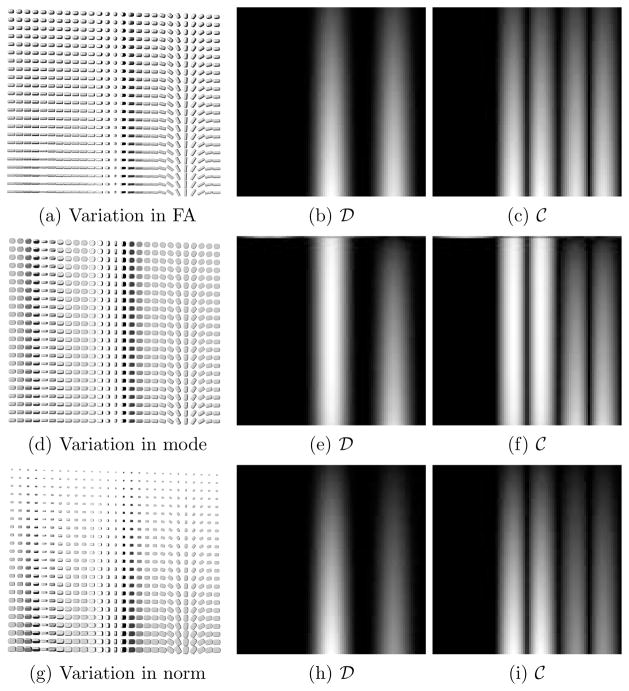
We computed the curving (4) and dispersion (5) indices on the synthetic datasets shown in Fig. 5. They all have the same eigenvector geometry as the dataset in Fig. 2, with the same three vertical regions of rotation, one for each eigenvector. In this figure, we examine the effect of varying tensor FA, mode, and norm. In each row of Fig. 5, we vary linearly one of these three tensor properties, while keeping the other two constant. As expected, the fanning tensor configurations in the central and right-hand side vertical bands have a high dispersion index. The immediately adjacent regions exhibit a high curving index, which is consistent with the underlying geometry. Since the measures are not mutually exclusive, some locations can have both high dispersion and high curving indices.
Fig. 5.
Each line shows the dispersion ( ) and curving (
 ) measures on a synthetic tensor dataset with the same eigenvector geometry but varying FA (top row), varying mode (middle row) and varying norm (bottom row).
3.1.2 The case of crossing voxels
The behaviour of our measures in the presence of fibre crossings is illustrated in detail with synthetic data in Appendix I. The diffusion tensor is a voxel-averaged quantity, which has a complex dependence on tissue structure especially in voxels with a non-uniform distribution of fibre directions [30]. For example, in the case of voxels with fibre crossings, the primary eigenvector corresponds to an average fibre direction (e.g. [8]), which may be quite different from the direction of either one of the crossing fibre populations. This direction depends on factors such as the angle between the crossing fibres and the relative volume fraction occupied in the voxel by each population. Because of all these effects, the tensor field may change dramatically in the vicinity of and within fibre crossings. As illustrated in Appendix I, such changes may be viewed as changes in dispersion and curving within the tensor field.
3.2 In vivo data validation
Diffusion-weighted images were acquired on a 3T scanner (General Electric Company, Milwaukee, WI, USA) using an echo planar imaging (EPI) sequence, with a double echo option to reduce eddy-current related distortions. To reduce the impact of EPI spatial distortion, an 8 Channel coil and ASSET with a SENSE-factor of 2 were used. The acquisition consisted in 51 directions with b= 900 s/mm2, and 8 baseline images with b= 0 s/mm2. The scan parameters were: TR=17000 ms, TE=78 ms, FOV=24 cm, 144 × 144 encoding steps, 1.7 mm slice thickness. A total of 85 axial slices covering the whole brain were acquired.
As discussed earlier, our measures assume that e1 reflects the predominant direction of the underlying fibre population. To ensure the validity of this assumption, we compute values for the dispersion and curving indices only in voxels where the linear anisotropy measure [39] is higher than a threshold, set to 0.1 in our experiments. This thresholding excludes mainly voxels with cerebro-spinal fluid or grey matter.
Section 2 discusses that in addition to reflecting fibre geometry, the geometric indices are also modulated by tensor size and tensor shape. In the following set of experiments, in order to ensure that the results reflect only fibre geometry in terms of changes in tensor orientation, we impose two different constraints on the data. The first constraint is a weaker one, and consists in normalizing the diffusion tensors by dividing each tensor by its norm. This normalization results in unit-norm tensors and thus removes the effect of tensor size, but does not affect tensor shape. The second constraint is a stronger one, and consists in removing the influence of tensor shape by setting the eigenvalues of all tensors as follows1: λ1 = 0.0012, λ2 = λ3 = 0.0005 mm2/s. Following this step, every tensor is divided by its norm. The net effect of this normalization is to transform all tensors to cylinders with identical shape and unit norm. This transformation modifies radically the data and results in the loss of structural information through the removal of planar anisotropy [39]. However, it also results in robustness to noise which may randomly interchange e2 and e3 in cases of high linear anisotropy, when λ2 and λ3 are both small and nearly equal. The main reason for performing this normalization, however, is to demonstrate that in practice, tensor shape does not strongly affect the computed indices.
Each of these normalizations were carried out as a preprocessing step, prior to computing the geometric indices, in two separate experiments. When the dispersion and curving indices are computed on data normalized by tensor size, we will refer to them as “size-normalized dispersion” (with acronym SD) and “size-normalized curving” (with acronym SC), respectively. When they are computed on data normalized by tensor shape and size, as in the second constraint above, we will refer to them as “shape-normalized dispersion” (with acronym SHD) and “shape-normalized curving” (with acronym SHC), respectively. For the latter normalization, the names do not include “size” for brevity, and also because shape is the stronger normalization factor. We will continue to use the terms “dispersion” and “curving” when no specific normalization is implied.
3.2.1 Results with size-normalized dispersion and curving: SD and SC
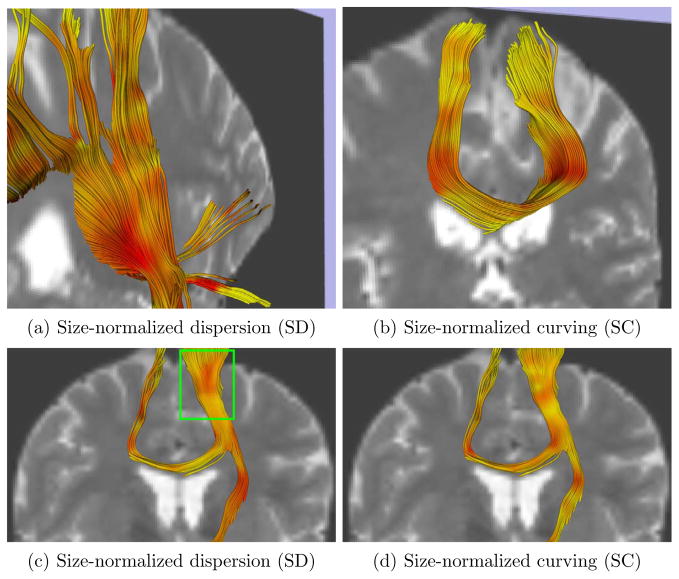
As described above, prior to computation of the geometric indices, each tensor was divided by its norm, in order to remove any dependence on tensor size in the results. After computation of the indices, standard streamline tractography [18] was run to help visualize in three dimensions the behaviour of the indices relative to well-known fibres. The resulting tracts were colored with the pre-computed scalar indices, as shown in Fig. 6. Note how the SD index captures the local fanning of fibres passing through the internal capsule in Fig. 6(a) . The fibres run parallel in the bottom part of the green box in Fig. 6(c) and the SD index is low. In the upper part of the box, however, the fibres fan, which is characterized by higher index values. While assessing visually these results, it is important to remember that fibre dispersion is a 3D phenomenon. Thus, for example, the area of high SD seen in the internal capsule (c) corresponds to fibre fanning orthogonal to the image plane. Finally, note that the SC index results in Fig. 6(b,d) are also consistent with the geometry of the recovered fibre tracts.
Fig. 6.
Streamline DT tractography colored by SD index (a,c) and SC index (b,d). Red indicates high index values. The T2-weighted image is shown in the background for reference. The region in the green box is discussed further in the text. (a) and (b) are displayed from an oblique angle for a better viewing of the tract geometry.
3.2.2 Results with shape-normalized dispersion and curving: SHD and SHC
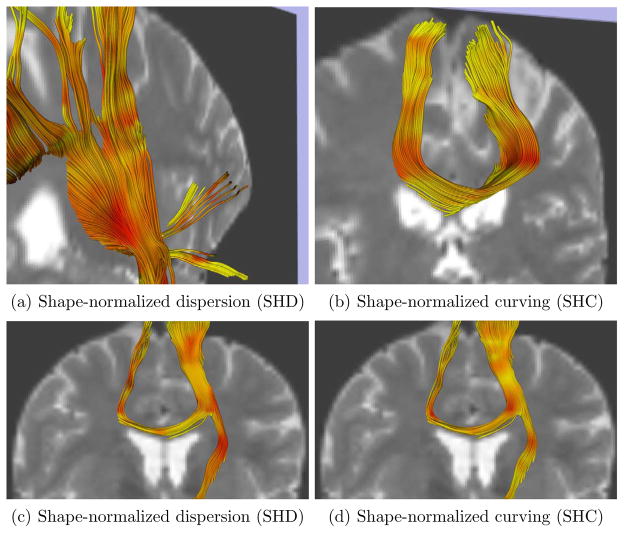
In this experiment, the effects of both tensor shape and size on the results were removed by modifying in a preprocessing step the diffusion tensors as described above. After computation of the geometrical indices, streamline tractography was run to help visualize in three dimensions the behaviour of the indices, in the same manner as in Fig. 6. The resulting tracts were colored with the pre-computed indices and are shown in Fig. 7. Note that there are no apparent differences with the results in Fig. 6, which is an qualitative indication that in vivo, tensor shape does not appear to have a major influence on the geometric indices.
Fig. 7.
Results obtained on shape-normalized tensor data. Streamline DT tractography colored by SHD index (a,c) and SHC index (b,d). Red indicates high index values. The T2-weighted image is shown in the background for reference.
3.3 Group study on schizophrenia
We carry out a group study on schizophrenia as a proof-of-concept to demonstrate the applicability of our indices in a population study context. Diffusion MRI data from 20 normal controls (NC) and 23 schizophrenic patients (SZ) was acquired as described in Section 3.2. All subjects in both groups are right-handed males, and all subjects in the SZ group are chronic schizophrenia patients. For the NC group, the age range is 21–55 years (mean 40.35 years, standard deviation of 11.83 years). For the SZ group, the age range is 22–55 years (mean 44.26 years, standard deviation of 9.94 years). The deep white matter structures were segmented in regions of interest (ROIs) by registering the ICBM-DTI-81 atlas [16] with the diffusion baseline of each subject using non-linear registration [18].
We computed dispersion (5) and curving (4) indices in ROIs that segment the anterior part of the corona radiata (CR), as well as the uncinate fasciculus (UF), in both hemispheres. A slice through each ROI is illustrated in Fig. 8. The CR is characterized by dispersion, whereas the UF is a curving tract. We thus hypothesized that the dispersion index in the CR case and the curving index in the UF case may reveal certain population differences.
Fig. 8.
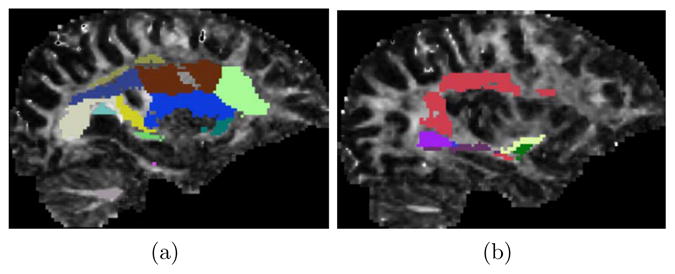
Sagittal slices through the right hemisphere, with the ROIs overlaid on an FA map. The results reported in Fig. 9 (a,b) pertain to the anterior corona radiata ROI, shown in light green in (a). Those presented in Fig. 9 (c,d) pertain to a segmentation of the uncinate, which combines the light and dark green ROIs in (b). Note the ROIs are 3D volumes, only a slice through which is visible here.
We computed the indices on data that was normalized by tensor size, as described in Section 3.2. The results are presented in the left column of Fig. 9. We repeated the same experiment with tensor shape and size normalization, also described in Section 3.2. The results are presented in the right column of Fig. 9.
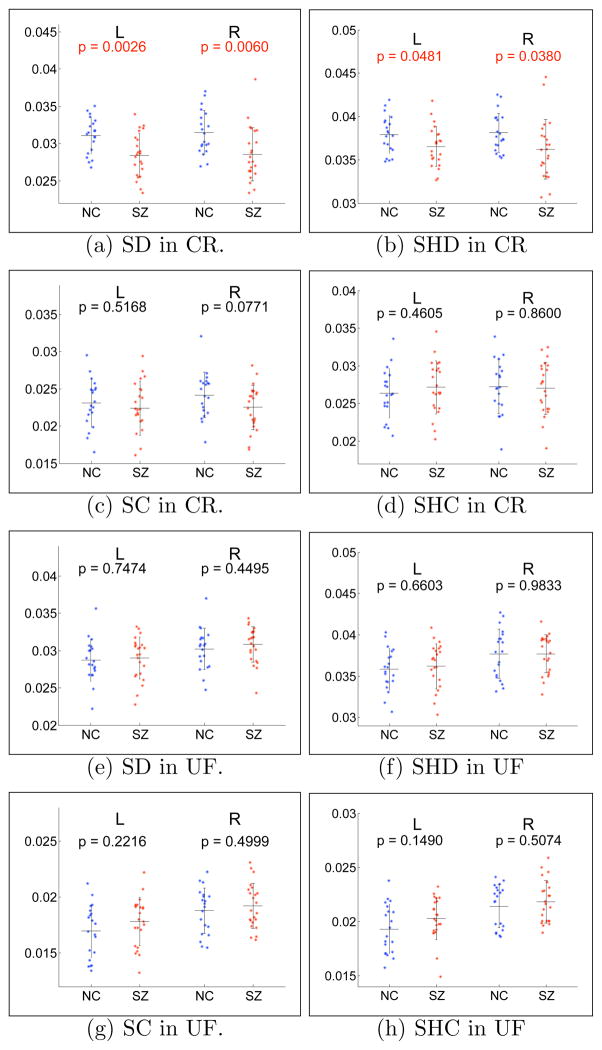
Fig. 9.
Scatter plots of mean index value for the anterior part of the corona radiata (CR) and for the uncinate fasciculus (UF). Left column: size-normalized indices. Right column: shape-normalized indices. Blue: NC. Red: SZ. Horizontal black lines: population mean. The error bars indicate ± 1 standard deviation. L: left hemisphere. R: right hemisphere. The p-values are computed with a two-sample T-test, and those that satisfy a significance threshold of 0.05 are given in red font.
The difference between the NC and SZ populations is significant in the anterior CR, in the cases of both SD and SHD, as shown in Fig. 9(a,b). The curving indices in Fig. 9(c,d) and (g,h) show a trend towards the SZ group having higher index values in the UF, and lower values in the CR. Thus, the population differences are reflected mainly in the dispersion index (both SD and SHD) in the anterior CR. As for the curving indices, they both reveal an interesting left vs. right asymmetry in the UF. The significant difference observed in the anterior CR is consistent with earlier studies of the white matter in the frontal lobe, which report reduced fractional anisotropy in schizophrenia patients [21].
It is important to note that neither the dispersion nor the curving indices are expected to be increased or decreased uniformly over the brain in patients as compared to controls. Rather, the effect is expected to be different depending on the region of interest. A region which normally shows a high level of dispersion or fanning in controls, such as the CR, might have its level of dispersion reduced because of white matter abnormalities. Conversely, a tightly bundled tract in normals that has very low dispersion may have an increased dispersion value in schizophrenics. We carried out a repeated Measures Analysis of Variance (ANOVA) test and found a significant Diagnosis × ROI interaction (F(1,41) = 14.82, p<0.001) in the case of size-normalized dispersion (SD) results, indicating that the difference between the SZ and NC groups was different for the CR compared to the UF region. With shape-normalized dispersion (SHD), the Diagnosis × ROI interaction is also significant: F(1,41) = 4.409, p=0.042. Because of that, we carried out independent t-tests in each ROI to determine levels of significance.
The comparison between results obtained with and without shape normalization shows once again that in practice, our measures reflect the underlying fibre geometry and are not strongly influenced by non-geometrical factors. This is not surprising, since in order to obtain these measures, information is integrated over a local neighborhood, and local variations in shape are probably too weak and too noisy in order to modulate significantly strong and consistent variations in tensor orientation over that neighborhood.
These results are very preliminary, and further study is required before clinical significance claims can be made. For instance, a better ROI definition scheme may be required. Nevertheless, these results serve as a proof-of-concept and demonstrate that geometrical indices can recover population trends.
4 Discussion
In this paper, we proposed two scalar measures of fibre geometry, each of which combines projections of the form ∇φ̂p · eq. In principle, it is possible to use individually each of the nine projections illustrated in Fig. 1 as a separate scalar measure. Here, we focused on the combined measures rather than on their individual “building blocks”, because they provide results that are more stable and easier to interpret. Other combinations that were not examined in this paper may be of interest as well, and are a topic of future work. For example, ∇φ̂2 · e2 and ∇ φ̂3 · e3 are sub-types of dispersion configurations that are probably common at interfaces of fibre tracts with different orientations. A measure that combines these two building blocks may therefore be useful to detect such interfaces.
As discussed throughout the paper, the geometric indices are dependent both on tensor orientation as well as tensor shape. Given the focus of this paper on white matter geometric features, a question that arises naturally is to what extent the proposed measures compute actual fibre geometry, as reflected in the change of tensor orientation, and to what extent they reflect changes in tensor shape, which may be related to fibre geometry, or to other factors such as changes in extracellular diffusion, partial voluming effects etc. Answering this question in the case of in vivo data is a difficult problem, since there is not an accepted method of isolating the geometry component of the diffusion tensor data from other, non-geometrical information (although previous work has attempted to solve the problem in the case of high-angular resolution diffusion imaging (HARDI) data, e.g. [33]). In this paper, we did not provide a conclusive answer to this question. However, we provided empirical evidence to indicate that in practice, in the case of in vivo data, the measures compute essentially only fibre geometry and are not significantly influenced by non-geometrical information. As shown in Sections 3.2 and 3.3, the results with tensor shape normalization are strikingly similar to those obtained without it.
The advantage of not performing shape normalization as described in Section 3.2, is that no artificial constraints are imposed on the data. On the other hand, shape normalization has the advantage of removing the spatially varying shape component of the tensor field, which may help the interpretation of correlations between the geometric indices and tensor shape metrics, such as FA. We plan to explore such correlations in future work. The specific values chosen in Section 3.2 for the normalized eigenvalues are of course only one set among many other possible choices.
Another question that may arise is why not simply compute the derivatives of the principal eigenvector field, instead of computing more complex tensor gradients, as proposed in this paper. Due to the sign ambiguity of tensor eigenvectors, derivatives of the principal eigenvector field are not well defined. Furthermore, the full tensor contains more information that only the principal eigenvector, and this additional information is likely to be valuable. For example, in the case of disk-shaped tensors, the principal eigenvector direction is not particularly meaningful. The weighting by tensor shape intrinsic to our indices will automatically take the uncertainty in the model into account and will reduce the computed dispersion or curving measure.
Another issue that merits consideration is that of scale. Currently, our measures work at a single scale determined by the spatial extent of the B-spline kernels used to compute tensor derivatives (see Section 2.1). However, fibre geometries such as dispersion and curving can be measured and described at various different scales. For example, the fanning of a structure such as the cortico-spinal tract occurs at a larger scale than the fanning of a U-fibre that parts to reach neighbouring gyri. It would appear then that a multi-scale approach may be well-suited for modeling fibre geometry. This is a topic for future investigation.
This paper focuses on the diffusion tensor model, which, as presented in the introduction (Section 1), has several biologically relevant properties and is still in wide use by the neuroscientific community. With the increased interest in HARDI methods seen in recent years, however, we intend in future work to generalize the ideas exposed in this paper to higher order tensor models.
5 Summary and conclusion
This paper introduced novel scalar indices of white matter dispersion and curving, based on a differential analysis of the diffusion tensor field. Since the indices are computed directly from the tensor field, without requiring prior tractography, they simplify the geometrical analysis of white matter and make it insensitive to possible tractography errors. Throughout the paper, we illustrated the indices on a variety of synthetic and in vivo examples. We also demonstrated the utility of the indices in the context of a population study on schizophrenia. Traditionally, clinical DTI studies focus on anisotropy, but our results demonstrate that geometrical measures may also be important. In our population study, the region-based comparison results clearly depend on factors such as the quality of white matter segmentation. We will address this issue as part of more detailed clinical comparison studies in the future. Finally, we intend to address applications in fibre tractography and DT image registration, as well as the extension of our indices to a multi-scale framework.
Acknowledgments
The authors are grateful to Thomas J. Whitford for helpful discussions and comments. This work was supported by NIH grants R01MH074794 (CFW, PS), P41RR013218 (CFW), U41RR019703 (CFW), U54EB005149 (MES), R01MH50740 (MES, PS, SB), K05MH070047 (MES), P50MH080272 (MES, PS, SB), R01MH082918 (SB), R03TW008134 (MES, SB), Department of Veteran Affairs Merit Awards (MES, SB), VA Schizophrenia Center grant (MES, SB), and Center for Integration of Medicine and Innovative Technology Soldier in Medicine Award (SB).
Appendix I
In this appendix, we illustrate the behaviour of the curving and dispersion measures in the presence of fibre crossings in synthetic data.
A 2D dispersing tensor field F1 was created in a 30 × 50 voxel grid, by setting the orientation of the principal eigenvector of each tensor to an angle θ = tan−1(y/x) where x and y are the position coordinates of the voxel in the grid. The eigenvalues of each tensor were set to λ1 = 0.0012, λ2 = 0.0004, λ3 = 0.0002, in units of mm2/s. These values were chosen as representative of a typical diffusion tensor measured in a relatively anisotropic region of the human white matter such as the U-fibres [30].
A second diffusion tensor field F2 consisting of horizontally aligned tensors was created over the grid, with tensor eigenvalues identical to those in the first field. The DWI signal from each tensor field was computed using the Stejskal-Tanner equation [37], and the signals of both fields were added:
| (6) |
where b is a constant (the b-value) set to 900 s/mm2, g is a set of 100 isotropically distributed gradient directions, and ω0 is a scalar spatial weighting function used to control the shape of the band of crossing tensors. In our model, S1 and S2 are constants with a value ranging between 0 and 1 which determine the proportion to which each tensor field contributes to the resulting combined signal Sadd. The resulting combined tensor field was recovered from Sadd through least-squares tensor estimation (see e.g. [39]).
To ensure that the crossing field F2 was defined only over a horizontal band over the top part of the grid, with a smooth edge, the weight ω0 in (6) was set to 1 in voxels within the band, to 0 in voxels outside the band, and to a sigmoid profile y = 1/(1 + e−x) over the band’s edge.
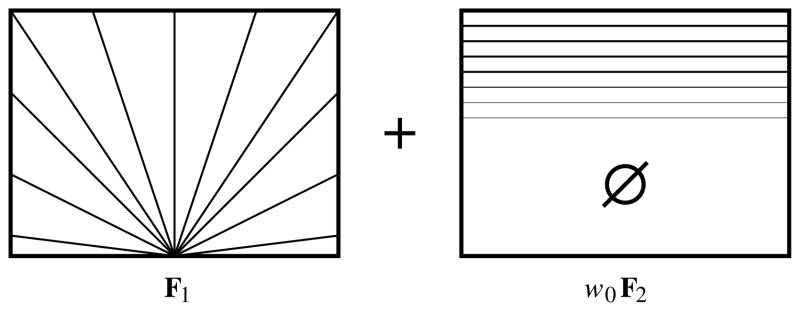
This combination is illustrated schematically in Fig. 10, which shows some of the direction lines with which the principal eigenvectors of F1 and F2 are aligned, as well as the result of multiplying F2 with the weighting function ω0.
Fig. 10.
A schematic illustration of the geometry of synthetic fields F1 and F2, which are combined according to (6) in order to produce a field of synthetic crossing tensors. F2 is illustrated after multiplication by weighting function ω0, which results in a band in the upper part of the dataset with a smooth edge with a sigmoid profile.
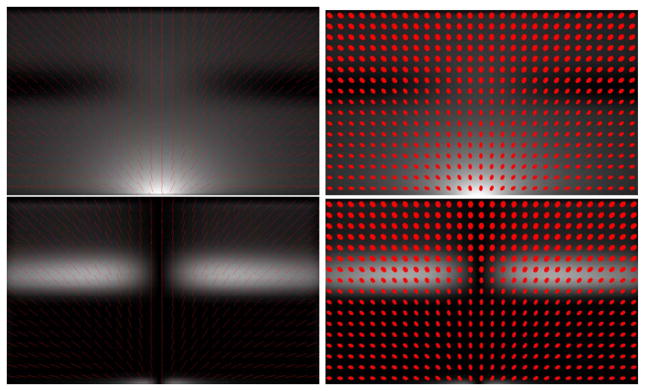
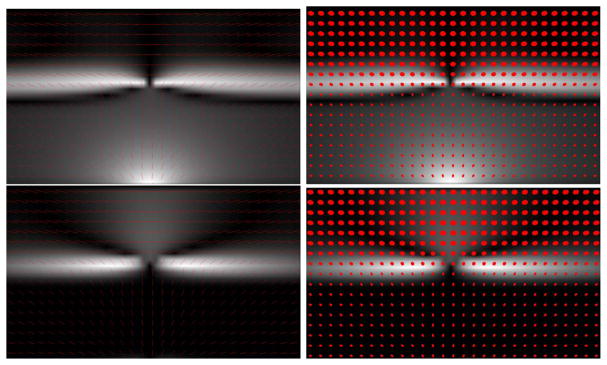
We carried out two experiments, with results presented in Figs. 11 and 12. For the first one (Fig. 11), the value of S1 in (6) is set to 0.7, and that of S2 is set to 0.3, so that most of the contribution comes from the fanning field F1. In the second experiment (Fig. 12), S1 is set to 0.3, and S2 = 0.7.
Fig. 11.
The crossing tensor field, overlaid on the computed dispersion measure  (top row) and curving measure
  (bottom row). The field is visualized with the principal eigenvectors (left column) and with ellipsoids (right column). The signal mixing parameters are set to S1 = 0.7, S2 = 0.3-
Fig. 12.
The crossing field and the geometrical indices visualized as in Fig. 11. Here the crossing field is obtained with S1 = 0.3 and S2 = 0.7.
In both experiments, we observe complex variations in the resulting tensor field, which are detected by the curving and dispersion measures. For example, in Fig. 11, there is a decrease in the dispersion measure near the edge of the crossing band, due to the progressive increase of the crossing field F2 strength, which reduces the variation of orientation present in F1. The same edge behaviour produces a different result with the curving measure  . The bottom part of the dataset consists only of the contribution of F1 and therefore lacks curving. The progressive increase of the strength of F2 over the edge of the crossing band induces a curving in the resulting field of principal eigenvectors, which is detected by
  .
.
In Fig. 12, even though the underlying fields F1 and F2 are the same as in Fig. 11, the differences in the relative contribution produce subtle but important changes in the resulting crossing field, which are reflected accordingly by the curving and dispersion measures. Both of these figures can be explained in terms of changes in the principal eigenvectors, but it is important to remember that the measures are computed using the full tensor information.
Appendix II
In our work, we develop indices that measure local changes in tensor orientation, which we relate to geometrical properties of the white matter. In this appendix, we derive the equations that link our geometrical indices to the components of the underlying diffusion tensor field. Since we are interested in local changes in the tensor field, we derive expressions that involve local spatial derivatives of tensor components. To do so, we work with tensor D at location x in the tensor field F, and we fix as a basis for ℝ3 the three tensor eigenvectors at F(x), i.e., ℰ = {e1, e2, e3}. Expressed in basis ℰ, an arbitrary vector v will have components x1, x2, x3, i.e., [v]ε = [x1, x2, x3]. In the following, basis ℰ is not always denoted but is always implied.
For a concise notation, we introduce the variables Rp = [Φ̂p(D)]ε and G = [∇F(x)]ε to symbolize the matrix representations in basis ℰ of the rotation tangent Φ̂p and of the spatial gradient of F, respectively. Recall from Section 2.1 that Φ̂p(D) is the rotation tangent of D associated with eigenvector ep (p ∈ {1, 2, 3}). In the following, we use Einstein notation, where a repeated index implies summation over that index, e.g. . We will also use the spatial gradient of F, which is a third order tensor [19]:
| (7) |
We begin by expanding (3) as a matrix expression:
| (8) |
Expressed in basis ℰ, the projections of the form ∇φ̂p·eq, p, q ∈ {1, 2, 3} for a particular pair {p, q} are simplified. For example,
| (9) |
As defined in Eqs. (20)–(22) in [19],
| (10) |
where ⊗ denotes the tensor product of two vectors. Thus, for example, the matrix representation of Φ̂2(D) in basis ℰ is given by [19]:
| (11) |
By combining this definition for R2 with (9), we obtain
| (12) |
where the last step is allowed by the symmetry of the diffusion tensor.
In a similar fashion, one can derive the other possible combinations of ∇φ̂p·eq:
| (13) |
| (14) |
| (15) |
| (16) |
| (17) |
| (18) |
| (19) |
| (20) |
| (21) |
The definition in (4) and (5) of the curving and dispersion measures uses only some of these terms. In particular, these measures depend on the three partial derivatives of D12 and D13, but not on derivatives of D23. We observe the following.
Curving
The curving measure depends on the projections in (16) and (19), i.e. on ∂D13/∂x1 and ∂D12/∂x1. Given the construction of our derivation where the basis of ℝ3 is the principal eigenframe, taking a partial derivative with respect to x1 is equivalent to a partial derivative in the direction of e1, the principal eigenvector. D13 represents the correlation of diffusion in the e1 and e3 directions, and D12 represents the correlation of diffusion in the e1 and e2 directions (e.g. [5,30]). Thus, the curving measure  measures the change along e1 in the correlation between diffusion along e1 and diffusion along the other two orthogonal directions.
Dispersion
Similarly, the dispersion measure depends on ∂D12/∂x2, ∂D12/∂x3, ∂D13/∂x2, and ∂D13/∂x3. Thus it measures the change in the plane orthogonal to e1 of the same correlations as above.
Note that instead of simply summing the projections involved in each measure, the formulation in (4) and (5) is equivalent to summing the squares of these terms, followed by the square root. This is equivalent to computing a norm and removes dependence on the sign of each term. For example, for the case of the dispersion index  ,
,
| (22) |
A similar expansion can be written for the curving index  :
:
| (23) |
Of course, these definitions for  and
and  in (22) and (23) are given with respect to basis ℰ. The advantage of the rotation tangent based definitions in (4) and (5) is that they are not dependent on a specific basis choice.
Footnotes
These values were chosen to be representative of a typical tensor in a relatively anisotropic part of the human white matter such as certain U-fibres [30].
Publisher's Disclaimer: This is a PDF file of an unedited manuscript that has been accepted for publication. As a service to our customers we are providing this early version of the manuscript. The manuscript will undergo copyediting, typesetting, and review of the resulting proof before it is published in its final citable form. Please note that during the production process errors may be discovered which could affect the content, and all legal disclaimers that apply to the journal pertain.
References
- 1.Alexander DC, Gee JC, Bajcsy R. Similarity measures for matching diffusion tensor images. Proc British Machine Vision Conference (BMVC) 1999:93–102. [Google Scholar]
- 2.Arsigny V, Fillard P, Pennec X, Ayache N. Log-Euclidean metrics for fast and simple calculus on diffusion tensors. Magn Res in Medicine. 2006;56:411–421. doi: 10.1002/mrm.20965. [DOI] [PubMed] [Google Scholar]
- 3.Barmpoutis A, Vemuri BC, Shepherd TM, Forder JR. Tensor splines for interpolation and approximation of DT-MRI with applications to segmentation of isolated rat hippocampi. IEEE Trans Medical Imaging. 2007;26:1537–1546. doi: 10.1109/TMI.2007.903195. [DOI] [PMC free article] [PubMed] [Google Scholar]
- 4.Bartzokis G. Schizophrenia: breakdown in the well-regulated lifelong process of brain development and maturation. Neuropsychopharmacology. 2002;27(4):672–683. doi: 10.1016/S0893-133X(02)00364-0. [DOI] [PubMed] [Google Scholar]
- 5.Basser PJ. New histological and physiological stains derived from diffusion-tensor MR images. Ann NY Acad Sci. 1997;820:123–138. doi: 10.1111/j.1749-6632.1997.tb46192.x. [DOI] [PubMed] [Google Scholar]
- 6.Basser PJ, Jones DK. Diffusion-tensor MRI: theory, experimental design and data analysis - a technical review. NMR in Biomedicine. 2002;15:456–467. doi: 10.1002/nbm.783. [DOI] [PubMed] [Google Scholar]
- 7.Basser PJ, Mattiello J, Le Bihan D. MR diffusion tensor spectroscopy and imaging. Biophysical Journal. 1994;66:259–267. doi: 10.1016/S0006-3495(94)80775-1. [DOI] [PMC free article] [PubMed] [Google Scholar]
- 8.Basser PJ, Pajevic S, Pierpaoli C, Duda J, Aldroubi A. In vivo fiber tractography using DT-MRI data. Magnetic Resonance in Medicine. 2000;44:625–632. doi: 10.1002/1522-2594(200010)44:4<625::aid-mrm17>3.0.co;2-o. [DOI] [PubMed] [Google Scholar]
- 9.Batchelor PG, Calamante F, Tournier JD, Atkinson D, Hill DLG, Connelly A. Quantification of the shape of fiber tracts. Magnetic Resonance in Medicine. 2006;55:894–903. doi: 10.1002/mrm.20858. [DOI] [PubMed] [Google Scholar]
- 10.Batchelor PG, Moakher M, Atkinson D, Calamante F, Connelly A. A rigorous framework for diffusion tensor calculus. Magnetic Resonance in Medicine. 2005;53(1):221–225. doi: 10.1002/mrm.20334. [DOI] [PubMed] [Google Scholar]
- 11.Beaulieu C. The basis of anisotropic water diffusion in the nervous system - a technical review. NMR in Biomedicine. 2002;15:435–455. doi: 10.1002/nbm.782. [DOI] [PubMed] [Google Scholar]
- 12.Corouge I, Fletcher PT, Joshi S, Gouttard S, Gerig G. Fiber tract-oriented statistics for quantitative diffusion tensor MRI analysis. Medical Image Analysis. 2006;10(5):786–798. doi: 10.1016/j.media.2006.07.003. [DOI] [PubMed] [Google Scholar]
- 13.Ding Z, Gore JC, Anderson AW. Classification and quantification of neuronal fiber pathways using diffusion tensor MRI. Magn Res in Medicine. 2003;49:716–721. doi: 10.1002/mrm.10415. [DOI] [PubMed] [Google Scholar]
- 14.Fletcher PT, Joshi S. Riemannian geometry for the statistical analysis of diffusion tensor data. Signal Processing. 2007;87(2):250–262. [Google Scholar]
- 15.Friston KJ. The disconnection hypothesis. Schizophrenia Research. 1998;30:115–125. doi: 10.1016/s0920-9964(97)00140-0. [DOI] [PubMed] [Google Scholar]
- 16.http://loni.ucla.edu/Atlases/
- 17.http://teem.sourceforge.net
- 18.http://www.slicer.org
- 19.Kindlmann G, Ennis DB, Whitaker RT, Westin CF. Diffusion tensor analysis with invariant gradients and rotation tangents. IEEE Trans Medical Imaging. 2007;26(11):1483–1499. doi: 10.1109/TMI.2007.907277. [DOI] [PubMed] [Google Scholar]
- 20.Kindlmann GL. Visualization and analysis of diffusion tensor fields. University of Utah; 2004. Ph.D. thesis. [Google Scholar]
- 21.Kubicki M, McCarley R, Westin CF, Park HJ, Maier S, Kikinis R, Jolesz FA, Shenton ME. A review of diffusion tensor imaging studies in schizophrenia. J Psychiatric Research. 2007;41:15–30. doi: 10.1016/j.jpsychires.2005.05.005. [DOI] [PMC free article] [PubMed] [Google Scholar]
- 22.Lenglet C, Rousson M, Deriche R. DTI segmentation by statistical surface evolution. IEEE Transactions in Medical Imaging. 2006;25(6):685–700. doi: 10.1109/tmi.2006.873299. [DOI] [PubMed] [Google Scholar]
- 23.Lenglet C, Rousson M, Deriche R, Faugeras O. Statistics on the manifold of multivariate normal distributions: Theory and applications to diffusion tensor MRI processing. J Mathematical Imaging and Vision. 2006;25:423–444. [Google Scholar]
- 24.Lin CP, Tseng WYI, Cheng HC, Chen JH. Validation of diffusion tensor magnetic resonance axonal fiber imaging with registered manganese-enhanced optic tracts. NeuroImage. 2001;14:1035–1047. doi: 10.1006/nimg.2001.0882. [DOI] [PubMed] [Google Scholar]
- 25.O’Donnell L, Westin CF. Automatic tractography segmentation using a high-dimensional white matter atlas. IEEE Trans Medical Imaging. 2007;26(11):1562–1575. doi: 10.1109/TMI.2007.906785. [DOI] [PubMed] [Google Scholar]
- 26.O’Neill B. Elementary Differential Geometry. Academic Press; 1966. [Google Scholar]
- 27.Pajevic S, Aldroubi A, Basser PJ. A continuous tensor field approximation of discrete DT-MRI data for extracting microstructural and architectural features of tissue. J Magn Resonance. 2002;154:85–100. doi: 10.1006/jmre.2001.2452. [DOI] [PubMed] [Google Scholar]
- 28.Pennec X, Fillard P, Ayache N. A Riemannian framework for tensor computing. International Journal of Computer Vision. 2006;66(1):41–66. [Google Scholar]
- 29.Pierpaoli C, Basser PJ. Toward a quantitative assessment of diffusion anisotropy. Magnetic Resonance in Medicine. 1996;36:893–906. doi: 10.1002/mrm.1910360612. [DOI] [PubMed] [Google Scholar]
- 30.Pierpaoli C, Jezzard P, Basser PJ, Barnett A, Di Chiro G. Diffusion tensor MR imaging of the human brain. Radiology. 1996;201:637–648. doi: 10.1148/radiology.201.3.8939209. [DOI] [PubMed] [Google Scholar]
- 31.Rovaris M, Filippi M. Diffusion tensor MRI in multiple sclerosis. J Neuroimaging. 2007;17(s1):27s–30s. doi: 10.1111/j.1552-6569.2007.00133.x. [DOI] [PubMed] [Google Scholar]
- 32.Savadjiev P. Perceptual organisation in diffusion MRI: curves and streamline flows. McGill University; 2009. Ph.D. thesis. [Google Scholar]
- 33.Savadjiev P, Campbell JSW, Descoteaux M, Deriche R, Pike GB, Siddiqi K. Labeling of ambiguous sub-voxel fibre bundle configurations in high angular resolution diffusion MRI. NeuroImage. 2008;41(1):58–68. doi: 10.1016/j.neuroimage.2008.01.028. [DOI] [PubMed] [Google Scholar]
- 34.Savadjiev P, Campbell JSW, Pike GB, Siddiqi K. 3D curve inference for diffusion MRI regularization and fibre tractography. Medical Image Analysis. 2006;10(5):799–813. doi: 10.1016/j.media.2006.06.009. [DOI] [PubMed] [Google Scholar]
- 35.Savadjiev P, Zucker SW, Siddiqi K. On the differential geometry of 3D flow patterns: Generalized helicoids and diffusion MRI analysis. Proc. IEEE Intl. Conf. on Computer Vision (ICCV)’07; 2007. [Google Scholar]
- 36.Sotak CH. The role of diffusion tensor imaging in the evaluation of ischemic brain injury - a review. NMR in Biomedicine. 2002;15:561–569. doi: 10.1002/nbm.786. [DOI] [PubMed] [Google Scholar]
- 37.Stejskal EO, Tanner JE. Spin diffusion measurements: spin echoes in the presence of a time-dependent field gradient. Journal of Chemical Physics. 1965;42:288–292. [Google Scholar]
- 38.Wang Z, Vemuri BC. DTI segmentation using an information theoretic tensor dissimilarity measure. IEEE Trans Medical Imaging. 2005;24:1267–1277. doi: 10.1109/TMI.2005.854516. [DOI] [PubMed] [Google Scholar]
- 39.Westin CF, Maier SE, Mamata H, Nabavi A, Jolesz FA, Kikinis R. Processing and visualization for diffusion tensor MRI. Medical Image Analysis. 2002;6:93–108. doi: 10.1016/s1361-8415(02)00053-1. [DOI] [PubMed] [Google Scholar]


