An official website of the United States government
Here's how you know
Official websites use .gov
A
.gov website belongs to an official
government organization in the United States.
Secure .gov websites use HTTPS
A lock (
) or https:// means you've safely
connected to the .gov website. Share sensitive
information only on official, secure websites.

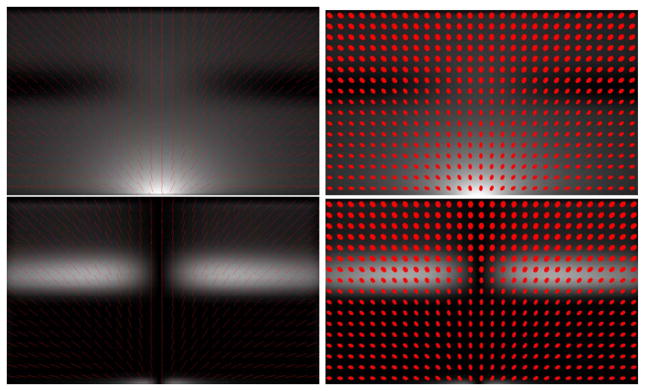
 (top row) and curving measure
  (bottom row). The field is visualized with the principal eigenvectors (left column) and with ellipsoids (right column). The signal mixing parameters are set to S1 = 0.7, S2 = 0.3-