

Abstract
Mouse-adapted human influenza virus is detectable in the olfactory bulbs of mice within hours after intranasal challenge and is associated with enhanced local cytokine mRNA and protein levels. To determine whether signals from the olfactory nerve influence the unfolding of the acute phase response (APR), we surgically transected the olfactory nerve in mice prior to influenza infection. We then compared the responses of olfactory nerve-transected (ONT) mice to those recorded in sham-operated control mice using measurements of body temperature, food intake, body weight, locomotor activity and immunohistochemistry for cytokines and the viral antigen, H1N1. ONT did not change baseline body temperature (Tb); however, the onset of virus-induced hypothermia was delayed for about 13 h in the ONT mice. Locomotor activity, food intake and body weights of the two groups were similar. At 15 h post-challenge fewer viral antigen-immunoreactive (IR) cells were observed in the olfactory bulb (OB) of ONT mice compared to sham controls. The number of tumor necrosis factor alpha (TNFα)- and interleukin 1 beta (IL1β)-IR cells in ONT mice was also reduced in the OB and other interconnected regions in the brain compared to sham controls. These results suggest that the olfactory nerve pathway is important for the initial pathogenesis of the influenza-induced APR.
Keywords: H1N1 virus, olfactory nerve transection, tumor necrosis factor, interleukin-1 beta, olfactory bulb, immunohistochemistry
1. Introduction
Cytokines such as tumor necrosis factor α (TNFα) and interleukin 1β (IL1β) are prominent mediators of the acute phase response (APR) (Bluthe et al., 2000). In influenza virus-infected mice, the APR includes enhanced sleep accompanied by reduced body temperature, locomotor activity and food intake (Conn et al., 1995; Fang et al., 1995; Toth et al., 1995; Swiergiel et al., 1997). Some facets of the APR are evident within 15 h post-inoculation (PI) (Fang et al., 1995). The infected animals manifest a profound hypothermia starting between 13 and 15 h PI that is associated with significantly elevated TNFα and IL1β olfactory bulb (OB) transcripts (Majde et al., 2007) and enhanced number of OB TNFα and IL1β immunoreactive (IR) cells (Leyva-Grado et al., 2009) within 15 h after intranasal (IN) challenge with influenza virus A (H1N1 PR8/34, abbreviated PR8). The APR is posited to be regulated, in part, by hypothalamic cytokines (Kent et al., 1992, Opp, 2005; Alt et al., 2007). In fact, by 38 h post-influenza viral inoculation, hypothalamic IL1β and TNFα mRNAs are up-regulated (Alt et al., 2007). However, our previous studies of influenza-infected mice suggest that OB cytokines could also potentially play a role in the APR (Majde et al., 2007; Leyva-Grado et al., 2009).
Selective removal of the OB using surgical bulbectomy or chemical deafferentation prior to intranasal inoculation with mouse hepatitis virus prevents the spread of this neurotropic virus into the brain (Barnett & Perlman, 1993). Using a recombinant construct of the rhabdovirus, vesicular stomatitis virus, expressing the reporter gene green fluorescent protein (GFP) demonstrates the virus presence as early as 2 days post IN infection in the olfactory nerves within the OB, particularly in the axons that terminated in the glomeruli of the OB (van den Pol et al., 2002). These data provide evidence that the olfactory nerve pathway is a possible route for different viruses to reach the CNS and produce infection (Reiss et al., 1998, Iwasaki et al., 2004, Mori et al., 2005). However, viruses previously shown to invade the OB via the olfactory nerve (ON) are neurotropic and capable of employing classical axonal transport pathways. The virus employed in these studies has no neurotropic properties and is appropriately termed gliotropic. Gliotropic viruses have not been demonstrated to employ axonal transport, but may enter the OB via alternative pathways (Majde, et al., 2007).
In the present study, therefore, the olfactory nerve was transected at the level of the cribriform plate prior to viral infection. We then evaluated body temperature (Tb), locomotor activity and food intake responses in the infected mice. In addition, we investigated by immunohistochemistry the distribution and the number of IR cells for the viral antigen H1N1 and the cytokines TNFα and IL1β-IR in the OB, the olfactory cortex, the amygdala and the hypothalamus (specifically the medial preoptic nucleus) of olfactory-nerve transected (ONT) mice after influenza virus infection. Results suggest a role for the ON pathway in the pathogenesis of the APR.
2. Materials and Methods
2.1 Virus
Allantoic fluid containing influenza virus A/Puerto Rico/8/34 H1N1 (PR8) prepared under pyrogen-free conditions was purchased from Specific Pathogen-Free Avian Supply. The virus was purified by sucrose-gradient sedimentation using pyrogen-free materials and the stock was tested for endotoxin and mycoplasma (both were negative), and titered in Madin-Darby canine kidney cells as previously described (Chen et al., 2004).
2.2 IN inoculation procedure
Mice were inoculated IN at light onset by delivering 25 μl to each nostril using a 100 μl micropipette under light methoxyflurane (Schering-Plough Animal Health) inhalation anesthesia. Infected mice received live virus: 2.5 × 10⁶ TCID50 purified PR8 suspended in Dulbecco’s phosphate buffered saline (DPBS). Control mice received the same dose of viral suspension that had been heat inactivated in boiling water for 25 min.
2.3 Animals
C57BL/6J male mice were purchased from Jackson Laboratories (Bar Harbor, ME) at 4–6 weeks of age. After arrival, animals were housed in 48 × 25 × 16 cm polypropylene cages with filter tops to minimize intercurrent infections. Food (rodent chow Purina 5001) and water were provided ad libitum. Mice were maintained on a 12:12 h light:dark cycle at an ambient temperature of 24° ± 1°C. They were used in the experiments when they were 8–12 weeks of age and their body weights were between 26–30 grams.
2.4 Olfactory nerve transection (ONT) experimental design
A total of 52 mice were used and divided into groups as follows; 14 mice received the ONT and live virus challenge; 12 mice received the sham surgery and live virus challenge; and 8 mice received sham surgery and boiled virus challenge. For food intake and body weight analyses, subsets (n=5 per group) of these same mice were used. For immunohistochemistry (IHC) studies of ONT mice, two groups of separate mice were inoculated with live virus, one with ONT (n=6) and the other with sham surgery (n=6). These mice were also used in a task to test the latency to find buried food. An additional group of mice were used for the histological analysis to test the effectiveness of ONT (n=4) and compared with sham mice (n=2).
2.5 Surgical procedure for ONT
The surgical procedure was adapted from Yee and Constanzo (1995). Briefly, mice were anesthetized using intraperitoneal (IP) ketamine (87 mg/kg) and xylazine (13 mg/kg) prepared in pyrogen-free saline (0.1 ml/10 g body weight each). A skin incision was made at the midline over the anterior skull and nasal bones. A small section of the frontal bones was removed with a dental drill to expose the dorsal surface of the OBs. A microdissecting knife (blade 3.0 mm; Roboz Surgical Instrument, Gaithersburg, MD) was inserted between the OB and the cribriform plate to cut all the olfactory axons projecting from the nasal cavity. Sham animals received identical surgical exposure of the OB as the experimental mice except the blade was not used to cut the nerve. Following surgery, mice were allowed to recover for 10 days, and then challenged with PR8 virus on day 10 post-surgery.
2.6 Tests for the effectiveness of the ONT
In a separate experiment, we tested the mice for their latency in finding buried food to determine whether mice could detect odorants after the ONT. Briefly, mice (n=12) were trained for three consecutive days to find a sugar cube randomly buried under approximately 1 inch of pine shavings. The mouse was removed from the test cage after eating the food or after 5 min. Mice were tested on days 5 and 7 after surgery. The average time to find the sugar cube was significantly higher in the mice with ONT (n=6) compared to the sham group (n=6) (sham 79.21 ± 7.9 sec; ONT 166.83 ± 30.55 sec, p=0.02). Results indicate the effectiveness for the ONT surgery was approximately 85% [1 out of 6 mice fell outside 2 standard deviations (Glantz, 2002)].
The brains from six additional uninfected mice (ONT=4; sham=2) euthanized 3 days after surgery were examined histologically for ON connections between the olfactory epithelium and the forebrain using light microscopy on hematoxylin-eosin stained sections. Primary fibers connecting the olfactory epithelium with the forebrain were not evident in the four ONT mice but were seen in the sham mice (Figure 1).
Fig. 1.
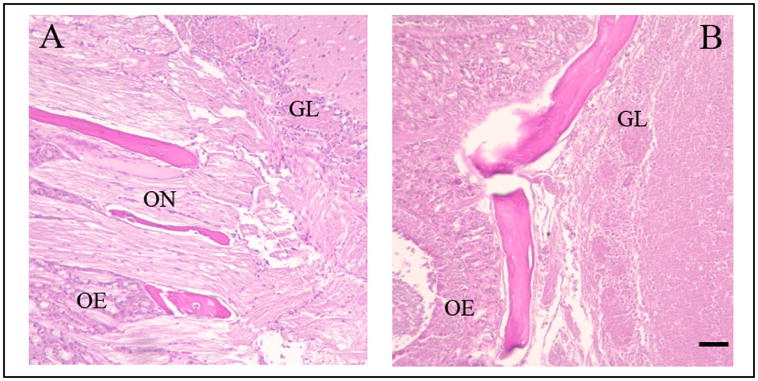
Photomicrographs of sagittal sections of the distal olfactory nerve and its connectivity with the olfactory bulb. (A) A sagittal section showing the axons of the olfactory receptor neurons connecting with the glomerular layer of the olfactory bulb in a mouse that received a sham surgery. (B) A sagittal section showing the loss of connectivity between the olfactory nerve axons and the olfactory bulb after the olfactory nerve transection surgery. OE, olfactory epithelium; ON, olfactory nerve; GL, glomerular layer. The scale bar is 0.02 mm.
2.7 Body temperature and motor activity analyses
During the sham or ONT operations, a small transponder (E-Mitter, Mini Mitter, Bend, OR) was implanted into the peritoneum of each mouse. Following surgery, mice were placed back in their home cages (1 mouse/cage). Then individually caged mice were placed on telemetry receivers (TR-3000, Mini Mitter) and Tb and locomotor activity were recorded using VitalView data acquisition software (Mini Mitter). After recovery from surgery, baseline data were collected for 2 days and then the mice were challenged with live (12 sham, 14 ONT) or boiled (8 sham) PR8 virus. Temperature and activity values were collected every 6 min and averaged in 1 h blocks for each animal (Traynor et al., 2004) for 6 days after viral challenge. Activity values on the baseline day (the day before infection) were averaged across the entire 24-h recording period for each mouse separately to obtain a reference value. Hourly activity data on each experimental day were expressed as a percentage of this reference value (Kapas et al., 2008).
2.8 Food intake and body weight
Food intake and body weights of 10 infected mice (5 sham, 5 ONT) and 5 uninfected mice were determined daily for six days starting on the day of inoculation. Food consumption was determined by weighing the food pellets before been put in the individual cages one hour before dark onset and the next day at the same time when new food was added. Food weighing was repeated daily. The weight of each mouse was recorded at the same time. Body weight values were expressed as the percent of the initial body weight (Szretter et al., 2007).
2.9 Brain collection
Under deep isoflurane anesthesia the animals were perfused with warm saline (0.9% NaCl) containing 0.004% of heparin followed by 35 ml of cold paraformaldehyde in phosphate-buffered saline (PBS). Brains were carefully removed from the skull and postfixed for 6 h at 4° C and then sunk in 20% sucrose overnight. The brains were frozen in crushed dry ice, and stored at −80° C until sectioned. For the IHC studies, mice were killed at 15 h PI.
2.10 Immunohistochemistry (IHC)
IHC was performed as previously described using diaminobenzidine as a chromophore (Churchill et al., 2005; Leyva-Grado et al., 2009). Olfactory bulbs, forebrain and midbrain sections were processed in pairs and adjacent frozen coronal tissue sections were cut at 30 μm thickness and floated onto PBS. Adjacent tissue sections were incubated with one of the following antibodies; mouse anti-influenza A H1N1 virus monoclonal antibody (Millipore, Temecula, CA, dilution 1:100), rabbit anti-recombinant mouse IL1β (Millipore, dilution 1:100) and goat anti-recombinant rat TNFα (R&D, Minneapolis MN, dilution 1:200). The sections were developed in 3, 3′-diaminobenzidine tetrahydrochloride (DAB kit, Vector Laboratories, Burlingame, CA,) as a chromophore.
The specificities of the anti-TNFα and anti-IL1β antibodies used in this experiment were previously reported (Leyva-Grado et al., 2009). They include omitting the primary antibody during the immunohistochemistry procedure, pre-absorption experiments using the target cytokine for TNFα or IL1β and the use of OB tissues from non-infected TNFα knock out (KO) (Jackson Laboratories, strain name: B6.129S-Tnftm1Gkl/J, stock #: 005540) or IL1β KO mice on a C57BL/6 background (a gift from Dr Kerry O’Banion, University of Rochester, NY) to stain sections with DAB. Additionally, we did Western blot analyses for TNFα and IL1β using mouse OBs to demonstrate antibody recognition of the two forms of TNFα and IL1β. For the present experiment, we incubated sections without the primary antibody or with pre-absorbed antibody [using specific recombinant cytokines as done previously (Leyva-Grado et al., 2009)]; both procedures blocked the immunoreactivity.
Images were captured with a Spot camera and software (Diagnostic Instruments Inc. Sterling Heights, MI), in a Leica DMLB microscope. The number of IR-cells in the OB of mice that received the ONT was determined using a rectangular box that measured 0.20 mm by 0.22 mm (H1N1 and IL1β) for photographs taken at 40× or 0.25 mm by 0.5 mm (TNFα) for photographs taken at 20× in 6 different fields from several sections of the rostral OB. The pictures for the H1N1 immunoreactivity were taken from the ventrolateral area of the OB sections where the topographical distribution of the viral antigen-IR cells is more evident (Leyva-Grado et al., 2009), i.e. close to the entry of the ON into the OB. In the olfactory and central autonomic nervous systems, the number of both TNFα and IL1β-IR cells was determined using a rectangular box that measured 0.15 mm by 0.35 mm [the piriform cortex (Pir) and the olfactory tubercle (Tu)]; 0.3 mm by 0.3 mm for the hypothalamic medial preoptic nucleus (MPO) or a circle with a radius of 0.100 mm for the central amygdala (CeA). As previously described (Leyva-Grado et al., 2009), the soma of immunoreactive neuron-like cells was counted in every region. Only brain regions that previously showed significant increases in cytokine-IR after intranasal inoculation with live virus (Leyva-Grado et al., 2009) were analyzed in the present study. The number of sections analyzed for each mouse varied depending on the number available for each brain region. Normally three-six different fields were analyzed for each mouse. For all the analyzed regions an individual blinded to the experimental treatment completed the quantification.
2.11 Statistical analyses
To compare body temperature and activity, three way ANOVA was used; surgery was the between factor and days and hours within the day, the repeated factors. For the food intake and body weight among the ONT, sham and boiled groups two-way ANOVA was used (between factor: surgery, repeated factor: day). When ANOVA showed significance, post hoc comparisons were performed using the Student-Newman-Keuls test or Student’s t-test. For IHC, the total number of IR cells was analyzed and the means ± the standard error of the mean were calculated and then statistically analyzed using a paired Student’s t-test. A p-value of 0.05 or less was considered statistically significant.
3. Results
3.1 Body temperature and locomotor activity
There were no significant differences in baseline body temperatures (Tbs) between the ONT and the sham operated mice over the 12:12 h light-dark cycle [Figure 2 (hours −24 to 0); F (1, 24) = 1.2, p= 0.32]. Mice in both groups demonstrated the normal circadian pattern with higher Tbs during the night and lower Tbs during their inactive day period (Figure 2). After viral challenge, both groups of mice became hypothermic compared to their respective baseline values [Figure 2; F (1, 36) = 2.15, p<0.01]. However, on day one PI, Tbs in ONT mice were significantly higher when compared to Tbs in the sham mice between 15 and 27 h PI (p< 0.05). After 28 h PI, Tbs were not significantly different (p> 0.05) between the two groups for the remaining 5 days of recording (days 3–5 not shown in Figure 2).
Fig. 2.

Time course of body temperature changes in olfactory nerve transected [ONT (closed circles)] or sham (open circles) mice following intranasal inoculation with influenza virus. The mice with a transected olfactory nerve (ONT) delay their hypothermia response to influenza virus by 13 h. Data points represent the means ± SEM at 1 h intervals. Asteriks (*) designate significant differences, p<0.05 between the ONT and the sham groups. The solid horizontal bars along the abscissa depict the 12 h dark periods.
The baseline locomotor activity responses were not significantly different between the ONT and the sham mice over the 12:12 h light-dark cycle [Figure 3 (hours −24 to 0); F (1, 20) = 0.86, p= 0.36]. Activity prior to infection was higher during the night and lower during the day (Figure 3, baseline −24 to 0 h) as is characteristic of healthy mice. After influenza challenge, there was a transient increase in activity of about 4 h in both groups (Figure 3). After this initial increase in activity, locomotor activity fell to the normally low daytime values during 4–12 h PI in both groups of mice. After 12 h PI, during the dark phase (12–24 h PI), locomotor activity in both ONT and sham groups was less than their corresponding baseline values [F (1, 20) = 32.16, p< 0.01]. This reduced activity remained below normal values until the end of the recording period. Although no significant differences in activity were observed between the ONT and sham groups after viral infection [Figure 3; F (1, 20) = 0.46, p= 0.50], during the delay hypothermia period, the ONT group had higher activity than the sham group (Figure 3).
Fig. 3.

Locomotor activity responses to PR8 challenge in ONT (closed circles) or sham (open circles) mice. Data points represent the means ± SEM at 1 h intervals. No significant differences were observed between the olfactory nerve transected (ONT) and the sham groups. After live viral challenge, locomotor activity increased for about 4 h compared with the same time of the baseline day. It then decreased below baseline values in both groups. The second day after viral challenge, activity remained below baseline levels. The solid horizontal bars along the abscissa mark the 12 h dark periods.
3.2 Food intake and body weight
There was a significant treatment effect on both food intake [Figure 4A; F (2, 12) = 7.25, p<0.01] and body weight [Figure 4B; F (2, 12) = 22.03, p<0.01] among the three treatment groups. Food intake and body weights of the mice that received boiled virus did not change over time and values were significantly higher than those measured in the live virus-treated groups on day 2 post-challenge. There were no significant differences in food intake or body weights between the infected ONT and sham groups that received the live virus.
Fig. 4.

Food intake and body weight following intranasal inoculation with influenza virus in ONT or sham mice. Food intake (A) and body weight (B) were determined for 6 days. (A) Data points represent the food consumption for the 24 h prior to the measurement. A decrease in food intake was observed in the ONT (closed circles) and sham (open circles) groups that received live virus compared to the sham mice that received the boiled virus (open triangles). (B) Data points represent the percentage of body weight in relationship to the initial body weight (day of virus challenge or day 0). Mice inoculated with live virus (ONT and sham) lost weight when compared with the sham mice that received boiled virus. Asterisks (*) represent significant differences, p<0.05 between the ONT and the sham groups compared to the boiled virus group.
3.3 Mortality rate
There were no differences in the percentage of deaths between the two groups of mice inoculated with live virus (ONT or sham). Mice started dying on day 5 after infection with more than 70% of the deaths occurring between day 5 and day 8 PI [ONT 71% (10 out of 14 mice) and sham 75% (9 out of 12 mice)]. None of the mice inoculated with boiled virus died.
3.4 Immunohistochemistry from ONT and sham mice
3.4.1 Viral antigen immunoreactivity
H1N1 immunoreactivity at 15 h PI was mainly present in the olfactory nerve (ON) and in the glomerular layer (GL) of the OB, and was observed in both the ONT mice (Figures 5A and 5B) and the sham mice (Figures 5C and 5D). The number of H1N1-IR cells was significantly reduced in the GL of the ONT group (8.4 ± 1.47) compared with the sham group [18.7 ± 3.69; p=0.02 (Figure 6)]. No H1N1 viral antigen immunoreactivity was observed in any of the olfactory cortex or midbrain regions analyzed.
Fig. 5.

Photomicrographs of olfactory bulb coronal sections from infected ONT or sham mice killed 15 h PI and stained for influenza H1N1. (A) Coronal section from an ONT mouse that received live PR8, with little evident H1N1 immunoreactivity is evident. (B) A higher magnification of the GL shown in (A). (C) Coronal section from a sham mouse showing the H1N1 immunoreactivity in the ON and the GL. (D) A higher magnification of the GL in (C). Arrows point to some stained cells with glial-like morphology. The scale bar for lower magnification pictures (A and C) is 0.02 mm; for higher magnification pictures (B and D) the scale bar is 0.025 mm. ML, mitral cell layer; EPL, external plexiform layer; GL, glomerular layer; ON, olfactory nerve.
Fig. 6.

Quantitative analyses of the number of the viral antigen H1N1-immunoreactive (IR) cells in the OB of ONT (n=6) or sham (n=6) mice inoculated with live virus. The number of H1N1-IR cells was significantly different between the two groups. Mice were inoculated with virus 10 days subsequent to olfactory nerve transection. Asterisk (*) indicates p<0.05
3.4.2 TNFα and IL1β immunoreactivities
TNFα-IR cells were evident 15 h PI in the GL and external plexiform layer (EPL) of the OB from infected sham mice, confirming our earlier studies of unoperated mice (Leyva-Grado et al., 2009). Absolute numbers and statistical analyses of TNFα-IR cells in the different brain regions examined are provided in Table 1. In infected ONT mice, the number of TNFα-IR cells was significantly reduced in the EPL when compared with the sham group. Similarly, in ONT mice, the number of TNFα-IR cells in the GL was less than the corresponding number in sham mice, but these latter differences only showed a trend toward significance (p=0.08). A significant reduction in TNFα-IR cell numbers occurred in the Tu of infected ONT mice relative to sham controls but not in the CeA.
Table 1.
Quantitative evaluation of the number of TNFα-IR cells in mice with olfactory nerve transection or sham surgery in specific brain regions 15 h after live-PR8 challenge.
| Brain regions | Sham | ONT | P value | % of control |
|---|---|---|---|---|
| OB GL | 45 ± 5.5 | 27 ± 6.1 | 0.08 | |
| OB EPL | 20 ± 2.4 | 14 ± 1.1 | 0.05* | 42.8 |
| Tu | 45.1 ± 4.8 | 34.2 ± 5.1 | 0.02* | 31.9 |
| CeA | 20.2 ± 2.9 | 17 ± 3.3 | 0.07 |
In the ONT mice 15 h PI, the number of IL1β-IR cells was significantly reduced in the EPL, Tu and MPO when compared with the infected sham group (Table 2). There were no significant differences in the number of IL1β-IR in the GL, Pir and CeA between the two groups of mice.
Table 2.
Quantitative evaluation of the number of IL1β-IR cells in mice with olfactory nerve transection or sham surgery in specific brain regions 15 h after live-PR8 challenge.
| Brain regions | Sham | ONT | P value | % of control |
|---|---|---|---|---|
| OB GL | 31 ± 3.5 | 31 ± 3.7 | 0.73 | |
| OB EPL | 15.3 ± 1.3 | 12 ± 2.4 | 0.05* | 27.5 |
| Pir | 57.1 ± 2.6 | 52.2 ± 3.1 | 0.19 | |
| Tu | 60.7 ± 8.2 | 50.6 ± 8.4 | 0.02* | 20 |
| CeA | 60.8 ± 2.9 | 59.6 ± 6.0 | 0.44 | |
| MPO | 303.1 ± 33.2 | 281.1 ± 29.3 | 0.05* | 7.9 |
4. Discussion
The transection of the olfactory nerve at the level of the cribriform plate 10 days prior to intranasal inoculation with influenza PR8 affected the APR by delaying the decline in body temperature for about 13 h. Furthermore, the nerve transection also reduced the number of TNFα- and IL1β-IR cells at 15 h PI after influenza viral challenge in the OB and Tu, suggesting that the ON serves as a cytokine-activation pathway.
Hypothermia, rather than fever, is usually observed in mice in response to challenge with influenza virus, regardless of the virus dose (Conn et al., 1995; Toth et al., 1995; Traynor et al., 2007). In rodents with systemic inflammation, hypothermia functions as an adaptive mechanism that correlates with enhanced protection and survival (Leon, 2004). Influenza virus-induced hypothermia is a regulated response in the sense that infected mice choose cool ambient temperatures even during the advance stage of the disease when hypothermia is more evident (Klein et al., 1992). Furthermore, influenza-infected mice show hypothermia even in warm environments (30 °C) (Jhaveri et al., 2007). Current results showing the delay of the hypothermic response for about 13 h in mice that received the ONT are consistent with the idea that the ON is involved very early in the hypothermia response. However, this delay in the onset of hypothermia did not affect the survival rate after the infection. Hypothermia, like fever, is mediated by cytokines such as TNFα, IL-1β and interferons (Leon, 2004; Traynor et al., 2007).
TNFα and IL1β are associated with the initiation of the APR after influenza infection, acting in the brain regions responsible for regulation of temperature, sleep, food intake and sickness behavior (Leon, 2004; Schmitz et al., 2005). We found that the number of TNFα and IL1β-IR cells was reduced in the EPL of the OB in the mice that received the ONT in comparison with the sham group. Primary olfactory neuronal axons synapse in the EPL with dendrites of second-order neurons such as the tufted cells (Astic & Saucier, 2001).
We previously demonstrated that the number of TNFα and IL1β-IR cells increased in different brain regions with direct and indirect connections with the OB in intact mice 15 h after inoculation with influenza virus (Leyva-Grado et al., 2009). In the present study we analyzed some of these regions to determine the impact of the ONT in the activation of neurons to express cytokines after the intranasal inoculation with the virus. Reduction in the number of TNFα and IL1β-IR cells in regions such as the Tu and the MPO corroborate the role of the olfactory pathway in the induction of cytokine production in brain regions related to the APR. The OB tufted cells, along with the mitral cells extend axons to different regions of the olfactory cortex including the Tu (Josephson et al., 1997; Haberly, 2001) and indirectly connect with regions that are important regulators of the sickness behavior (particularly body temperature) such as the MPO (Szymusiak and Satinoff, 1982; Shipley et al 2004). Although, the mechanisms involved in the reduction of the number of cells expressing TNFα and IL1β are not clear, current results clearly indicate that some signal from the ON hastens the early expression of TNFα and IL1β in the OB and its interconnected regions in the brain. It is likely that the virus detected in the OB is the activating stimulus via the glial cells that take it up and produce IL1β (Leyva-Grado et al., 2009).
The reduced locomotor activity observed in mice after influenza challenge (Conn et al., 1995; Toth et al., 1995) was confirmed in the current studies after inoculation with live PR8. However, we did not find significant differences between the ONT and sham groups, suggesting that virus transported via the ON is not involved in the locomotor activity response after live virus challenge. Consistent with our findings, no significant changes in locomotor activity are observed as an effect of the ONT in uninfected animals (Harding & Wright, 1979; Yee & Constanzo, 1995; Astic & Saucier, 2001).
The reduced body weight and food intake after virus challenge was also consistent with prior findings (Conn et al., 1995; Swiergiel et al., 1997). The fact that we found no significant differences between the ONT and the sham groups suggests that the ON is not essential to induce changes in food intake and body weight responses to influenza challenge. Previous studies in uninfected rodents also show that the ONT does not affect normal food intake and body weight parameters (Yee & Constanzo, 1995; Yee & Rawson, 2000). Since Tb, locomotor activity, food intake and body weight during the APR are all thought to be regulated in part via enhanced cytokine production, current results of only Tb being affected by the ONT indicate that the importance of the ON and OB cytokines induced after influenza challenge is limited to hypothermia. The reasons for these differential effects remain unknown. Perhaps the hypothermic-responsive brain regions are more sensitive to the olfactory input than the brain regions regulating locomotor activity or food intake. For example, food intake and body weight are to a great extent regulated by the input from the gastrointestinal system through the vagus nerve (Bugajski, et al., 2007), suggesting that the visceral input to the regulatory centers in the brain is more important for these parameters than the olfactory input. The effect of the ONT on Tb was temporary (a 13 h delay), if the effect of the ONT procedure on food intake is also short-termed, there is a possibility, since we measure food intake every 24 h, that we might have missed the effect on this parameter.
The olfactory system has the capacity to undergo neurogenesis and continuously replace its primary olfactory neurons (Harding & Wright, 1979; Yee & Constanzo, 1995; Yee & Rawson, 2000). The olfactory receptor neurons (ORNs) are replaced when cells undergo normal aging, nerve injury or following toxic chemical exposure. After the ONT, an extended neuronal degeneration occurs within the first 2 days post-surgery (Holcomb et al., 1995; Astic & Saucier, 2001). Immediately after the injury, a proliferative response starts to replace the lost ORN (Constanzo et al., 2006). Restoration of the olfactory mediated behavior is achieved within 20 to 30 days after surgery (Harding & Wright, 1979; Yee & Constanzo, 1995). In our experiments we infected the mice 10 days after the ONT. We used this time frame because we wanted the mice to recover from the surgery before the infection and because at this time we expected that the nerve had not grown back. The expression and transport within the ORN of carnosine and the olfactory marker protein (both markers of mature ORN) do not start until between 15 and 45 days after surgery (Wright & Harding, 1982; Constanzo et al., 2006). However, it is possible, that by the time of infection and in the days following, some cells have already reestablished connections with the OB. Accordingly, the conclusions drawn for our transection experiment regarding the role of the primary olfactory tract and the secondary OB projections likely underestimate the importance of this pathway.
The olfactory epithelium in the nose is formed by sensory neurons with unmyelinated olfactory cilia protected only by nasal mucus (Dahlin et al., 2000; Mori et al., 2005). From the main olfactory epithelium the axons the olfactory receptor neurons (ORN) form the olfactory nerve that crosses through the lamina cribosa to the olfactory bulb where they synapse with second order neurons. These ORN have some unique characteristics such as the capacity to capture and transport exogenous substances to the central nervous system and unlike other neurons have the capacity to regenerate as part of the normal cycle of life about every 90 days (Mori, 2005). These characteristics and the connectivity between the ORN exposed to the environment with cortical areas in the brain make the olfactory nerve pathway an important route for viruses to reach the brain (Urbanska, et al., 1997; McNamara et al., 2000; Shepherd, 2007). This may be relevant for the natural occurrence of influenza infection in humans since the nasal route is the main route of infection (Lofgren et al., 2007). It is also important to point out that the intranasal vaccination with live attenuated influenza virus induces mild flu-like symptoms like fever (Izurieta et al., 2005), suggesting a role for the olfactory pathway in the activation of the influenza virus-induced APR. Furthermore, we can speculate that since the olfactory receptor neurons are the only neurons that are in direct contact with the environment (Mori et al., 2005), they might also function as a possible CNS mechanism for early innate recognition of pathogens entering through the nasal pathway.
In conclusion, our findings indicate that the surgical transection of the ON delays the decline of body temperature for 13 h and decreases the number of TNFα- and IL1β-IR cells in the OB and interconnecting regions of the brain 15 h after PR8 inoculation, thereby strongly suggesting a role for the ON pathway in the initial pathogenesis of influenza-induced APR.
Acknowledgments
This work was supported by the Institute of Child Health and Development NIH Grant No. HD36520 and the National Institute of Neurological Disorders and Stroke Grant Nos. NS25378 and NS31453. Dr. Leyva-Grado was supported by the Direccion General de Apoyo al Personal Academico of the National Autonomous University of Mexico.
Footnotes
Publisher's Disclaimer: This is a PDF file of an unedited manuscript that has been accepted for publication. As a service to our customers we are providing this early version of the manuscript. The manuscript will undergo copyediting, typesetting, and review of the resulting proof before it is published in its final citable form. Please note that during the production process errors may be discovered which could affect the content, and all legal disclaimers that apply to the journal pertain.
References
- Alt JA, Bohnet S, Taishi P, Durika D, Obal F, Traynor T, Majde JA, Krueger JM. Influenza virus-induced glucocorticoid and hypothalamic and lung cytokine mRNA responses in dwarf lit/lit mice. Brain Behav Immun. 2007;21:60–67. doi: 10.1016/j.bbi.2005.05.002. [DOI] [PubMed] [Google Scholar]
- Astic L, Saucier D. Neuronal plasticity and regeneration in the olfactory system of mammals: morphological and functional recovery following olfactory bulb deafferentation. Cell Mol Life Sci. 2001;58:538–545. doi: 10.1007/PL00000879. [DOI] [PMC free article] [PubMed] [Google Scholar]
- Barnett EM, Perlman S. The olfactory nerve and not the trigeminal nerve is the major site of CNS entry for mouse hepatitis virus, strain JHM. Virology. 1993;194:185–191. doi: 10.1006/viro.1993.1248. [DOI] [PubMed] [Google Scholar]
- Bluthé RM, Layé S, Michaud B, Combe C, Dantzer R, Parnet P. Role of interleukin-1beta and tumour necrosis factor-alpha in lipopolysaccharide-induced sickness behaviour: a study with interleukin-1 type I receptor-deficient mice. Eur J Neurosci. 2000;12:4447–4456. [PubMed] [Google Scholar]
- Bugajski AJ, Gil K, Ziomber A, Zurowski D, Zaraska W, Thor PJ. Effect of long-term vagal stimulation on food intake and body weight during diet induced obesity in rats. J Physiol Pharmacol. 2007;58(Suppl 1):5–12. [PubMed] [Google Scholar]
- Chen L, Duricka D, Nelson S, Mukherjee S, Bohnet S, Taishi P, Majde JA, Krueger JM. Influenza virus-induced sleep responses in mice with targeted disruptions in neuronal or inducible nitric oxide synthases. J Appl Physiol. 2004;97:17–28. doi: 10.1152/japplphysiol.01355.2003. [DOI] [PubMed] [Google Scholar]
- Churchill L, Yasuda K, Yasuda T, Blindheim K, Falter M, Garcia-Garcia F, Krueger JM. Unilateral cortical application of tumor necrosis factor-α induces asymmetry in Fos- and interleukin-1β-immunoreactive cells within the corticothalamic projection. Brain Res. 2005;1055:15–24. doi: 10.1016/j.brainres.2005.06.052. [DOI] [PubMed] [Google Scholar]
- Conn C, McClellan J, Maassab H, Smitka C, Majde JA, Kluger M. Cytokines and the acute phase response to influenza virus in mice. Am J Physiol. 1995;268:R78–R84. doi: 10.1152/ajpregu.1995.268.1.R78. [DOI] [PubMed] [Google Scholar]
- Constanzo R, Perrino L, Kobayashi M. Response of matrix metalloproteinase-9 to olfactory nerve injury. Neuroreport. 2006;17:1787–17891. doi: 10.1097/WNR.0b013e32800fef87. [DOI] [PMC free article] [PubMed] [Google Scholar]
- Fang J, Sanborn C, Renegar K, Majde JA, Krueger JM. Influenza viral infections enhance sleep in mice. Proc Soc Exp Biol Med. 1995;210:242–252. doi: 10.3181/00379727-210-43945. [DOI] [PubMed] [Google Scholar]
- Glantz S. Primer of Biostatistics. 5. McGrawHill; USA: 2002. [Google Scholar]
- Haberly L. Parallel-distributed processing in olfactory cortex: new insights from morphological and physiological analysis of neuronal circuitry. Chem Senses. 2001;26:551–576. doi: 10.1093/chemse/26.5.551. [DOI] [PubMed] [Google Scholar]
- Harding J, Wright J. Reversible effects of olfactory nerve section on behaviour and biochemistry in mice. Brain Res Bull. 1979;4:17–22. doi: 10.1016/0361-9230(79)90053-4. [DOI] [PubMed] [Google Scholar]
- Holcomb J, Mumm J, Calof A. Apoptosis in the neuronal lineage of the mouse olfactory epithelium: regulation in vivo and in vitro. Dev Biol. 1995;172:307–323. doi: 10.1006/dbio.1995.0025. [DOI] [PubMed] [Google Scholar]
- Iwasaki T, Itamura S, Nishimura H, Sato Y, Tashiro M, Hashikawa T, Murata T. Productive infection in the murine central nervous system with avian influenza virus (H5N1) after intranasal inoculation. Acta Neuropathol. 2004;108:485–492. doi: 10.1007/s00401-004-0909-0. [DOI] [PubMed] [Google Scholar]
- Izurieta HS, Haber P, Wise RP, Iskander J, Pratt D, Mink C, Chang S, Braun MM, Ball R. Adverse events reported following live, cold-adapted, intranasal influenza vaccine. JAMA. 2005;294:2720–2725. doi: 10.1001/jama.294.21.2720. [DOI] [PubMed] [Google Scholar]
- Jhaveri K, Trammell R, Toth L. Effect of environmental temperature on sleep, locomotor activity, core body temperature and immune responses of C57BL/6J mice. Brain Behav Immun. 2007;21:975–987. doi: 10.1016/j.bbi.2007.03.007. [DOI] [PMC free article] [PubMed] [Google Scholar]
- Josephson E, Padgett ML, Buxton DF. The lateral and medial compartments of the olfactory tubercle and their relation to olfactory-related input as determined by artificial neural network. Brain Res. 1997;744:253–271. doi: 10.1016/s0006-8993(96)01086-4. [DOI] [PubMed] [Google Scholar]
- Kapás L, Bohnet SG, Traynor TR, Majde JA, Szentirmai E, Magrath P, Taishi P, Krueger JM. Spontaneous and influenza virus-induced sleep are altered in TNF-α double-receptor deficient mice. J Appl Physiol. 2009;105(4):1187–1198. doi: 10.1152/japplphysiol.90388.2008. [DOI] [PMC free article] [PubMed] [Google Scholar]
- Kent S, Bluthe R, Kelley K, Dantzer R. Sickness behavior as a new target for drug development. Trends Pharmacol Sci. 1992;13:24–28. doi: 10.1016/0165-6147(92)90012-u. [DOI] [PubMed] [Google Scholar]
- Klein M, Conn C, Klueger M. Behavioral thermoregulation in mice inoculated with influenza virus. Physiol Behav. 1992;52:1133–1139. doi: 10.1016/0031-9384(92)90472-e. [DOI] [PubMed] [Google Scholar]
- Leon L. Hypothermia in systemic inflammation: role of cytokines. Front Biosci. 2004;9:1877–1888. doi: 10.2741/1381. [DOI] [PubMed] [Google Scholar]
- Leyva-Grado VH, Churchill L, Wu M, Williams TJ, Taishi P, Majde JA, Krueger JM. Influenza virus- and cytokine-immunoreactive cells in the murine olfactory and central autonomic nervous systems before and after illness onset. J Neuroimmunol. 2009;211:73–83. doi: 10.1016/j.jneuroim.2009.03.016. [DOI] [PMC free article] [PubMed] [Google Scholar]
- Lofgren E, Fefferman NH, Naumov YN, Gorski J, Naumova EN. Influenza seasonality: underlying causes and modeling theories. J Virol. 2007;81:5429–5436. doi: 10.1128/JVI.01680-06. [DOI] [PMC free article] [PubMed] [Google Scholar]
- Majde JA, Bohnet S, Ellis G, Churchill L, Leyva-Grado VH, Wu M, Szentirmai E, Rehman A, Krueger JM. Detection of mouse-adapted human influenza viruses in the olfactory bulbs of mice within hours after intranasal inoculation. J Neurovirol. 2007;13:399–409. doi: 10.1080/13550280701427069. [DOI] [PubMed] [Google Scholar]
- Mori I, Goshima F, Ito H, Koide N, Yoshida T, Yokochi T, Kimura Y, Nishiyama Y. The vomeronasal chemosensory system as a route of neuroinvasion by herpes simplex virus. Virology. 2005;334:51–58. doi: 10.1016/j.virol.2005.01.023. [DOI] [PubMed] [Google Scholar]
- Opp M. Cytokines and sleep. Sleep Med Rev. 2005;9:355–364. doi: 10.1016/j.smrv.2005.01.002. [DOI] [PubMed] [Google Scholar]
- Reiss C, Plakhov I, Komatsu T. Viral replication in olfactory receptor neurons and entry into the olfactory bulb and brain. Ann N Y Acad Sci. 1998;855:751–761. doi: 10.1111/j.1749-6632.1998.tb10655.x. [DOI] [PubMed] [Google Scholar]
- Schmitz N, Kurrer M, Bachmann M, Kopf M. Interleukin-1 is responsible for acute lung immunopathology but increases survival of respiratory influenza virus infection. J Virol. 2005;79:6441–6448. doi: 10.1128/JVI.79.10.6441-6448.2005. [DOI] [PMC free article] [PubMed] [Google Scholar]
- Shipley MT, Ennis M, Puche AC. Olfactory System. In: Paxinos G, editor. The Rat Nervous System. Chapter 25. 2004. pp. 923–964. [Google Scholar]
- Swiergiel A, Smagin G, Dunn A. Influenza virus infection of mice induces anorexia: comparison with endotoxin and interleukin-1 and the effects of indomethacin. Pharmacol Biochem Behav. 1997;57:389–396. doi: 10.1016/s0091-3057(96)00335-8. [DOI] [PubMed] [Google Scholar]
- Szymusiak R, Satinoff E. Acute thermoregulatory effects of unilateral electrolytic lesions of the medial and lateral preoptic area in rats. Physiol Behav. 1982;28:161–170. doi: 10.1016/0031-9384(82)90118-4. [DOI] [PubMed] [Google Scholar]
- Szretter K, Gangappa S, Lu X, Smith C, Shieh W, Zaki S, Sambhara S, Tumpey T, Katz J. Role of host cytokine responses in the pathogenesis of avian H5N1 influenza viruses in mice. J Virol. 2007;81:2736–2744. doi: 10.1128/JVI.02336-06. [DOI] [PMC free article] [PubMed] [Google Scholar]
- Toth L, Rehg J, Webster R. Strain differences in sleep and other pathophysiological sequelae of influenza virus infection in naive and immunized mice. J Neuroimmunol. 1995;58:89–99. doi: 10.1016/0165-5728(94)00193-r. [DOI] [PubMed] [Google Scholar]
- Traynor T, Majde JA, Bohnet S, Krueger JM. Intratracheal double-stranded RNA plus interferon-gamma: a model for analysis of the acute phase response to respiratory viral infections. Life Sci. 2004;74:2563–2576. doi: 10.1016/j.lfs.2003.10.010. [DOI] [PubMed] [Google Scholar]
- Traynor T, Majde JA, Bohnet S, Krueger JM. Interferon type I receptor-deficient mice have altered disease symptoms in response to influenza virus. Brain Behav Immun. 2007;21:311–322. doi: 10.1016/j.bbi.2006.09.007. [DOI] [PMC free article] [PubMed] [Google Scholar]
- van den Pol A, Dalton K, Rose J. Relative neurotropism of a recombinant rhabdovirus expressing a green fluorescent envelope glycoprotein. J Virol. 2002;76:1309–1327. doi: 10.1128/JVI.76.3.1309-1327.2002. [DOI] [PMC free article] [PubMed] [Google Scholar]
- Wright J, Harding J. Recovery of olfactory function after bilateral bulbectomy. Science. 1982;216:322–324. doi: 10.1126/science.7063891. [DOI] [PubMed] [Google Scholar]
- Yee K, Constanzo R. Restoration of olfactory mediated behavior after olfactory bulb deafferentation. Physiol Behavior. 1995;58:959–968. doi: 10.1016/0031-9384(95)00159-g. [DOI] [PubMed] [Google Scholar]
- Yee K, Rawson N. Retinoic acid enhances the rate of olfactory recovery after olfactory nerve transection. Develop Brain Res. 2000;124:129–132. doi: 10.1016/s0165-3806(00)00108-5. [DOI] [PubMed] [Google Scholar]