Abstract
Human bone marrow mesenchymal stem cells (MSC) are pleitrophic cells that differentiate to either adipocytes or osteoblasts as a result of cross-talk by specific signaling pathways including heme oxygenase (HO)-1/-2 expression. We examined the effect of inducers of HO-1 expression and inhibitors of HO activity on MSC differentiation to the osteoblast and adipogenesis lineage. HO-1 expression is increased during osteoblast stem cell development, but remains elevated, at 25 days. The increase in HO-1 levels proceed an increase in alkaline phosphatase (AP) activity and an increase in BMP, osteonectin and RUNX-2 mRNA. Induction of HO-1 by osteogenic growth peptide (OGP) was associated with an increase in BMP-2 and osteonectin. Exposure of MSC to high glucose levels decreased osteocalcin and osteogenic protein expression, which was reversed by upregulation of the OGP-mediated increase in HO-1 expression. The glucose mediated decrease in HO-1 resulted in decreased levels of pAMPK, pAKT and the eNOS signaling pathway and was reversed by OGP. In contrast, MSC-derived adipocytes were increased by glucose. HO-1 siRNA decreased HO-1 expression but increased adipocyte stem cell differentiation and the adipogenesis marker, PPARγ. Thus, upregulation of HO-1 expression shifts the balance of MSC differentiation in favor of the osteoblast lineage. In contrast, a decrease in HO-1 or exposure to glucose drives the MSC towards adipogenesis. Thus targeting HO-1 expression is a portal to increased osteoblast stem cell differentiation and to the attenuation of osteoporosis by the promotion of bone formation.
Keywords: diabetes, osteoporosis, osteoblasts, BMP2
INTRODUCTION
Human bone marrow-derived mesenchymal stem cells give rise to osteoblastic and adipogenic lineages. The shift from osteoblastic to adipocyte lineage is a result of cross talk and the various factors that drive MSC to adipocytes lineages inhibiting osteoblast formation [1]. Diabetes affects dynamic bone formation in both humans and animals leading to osteopenia and osteoporosis [2, 3] and increased adipogenesis [4-6]. Bone-mineral density and other biochemical markers of bone turnover are adversely affected in individuals with diabetes [7]. Reduction of bone mass, occurring with increased frequency in individuals with diabetes mellitus, has been attributed to poor glycemic control, but the pathogenic mechanisms remain unknown. High concentrations of glucose (hyperglycemia) in diabetics exacerbate this complication [7-9]. Osteoblasts secrete growth factors including platelet derived growth factor, insulin like growth factors and bone morphogenetic proteins [10] that are stored in the bone matrix. Whether these factors are affected by diabetes remains to be seen. Furthermore, the molecular mechanism underlying osteoblast stem cell differentiation under hyperglycemic conditions has not been fully elucidated.
In contrast to diabetes, recent studies have shown that several growth factors including osteogenic growth peptide (OGP) enhance differentiation of mesenchymal stem cells to osteoblasts [11] and that endothelial growth factor (EGF) and OGP enhance osteoblast cell proliferation by regulating several signaling pathways. Osteogenic growth peptide is a naturally occurring tetradecapeptide that is both an anabolic agent and a hematopoietic stimulator [12]. OGP increases osteoblast proliferation, alkaline phosphatase (AP) activity and matrix synthesis and mineralization. It prevents glucocorticoid-induced apoptosis and the subsequent bone remodeling alterations that are associated with steroids [13].
Heme oxygenase-1 (HO-1) plays a major role during bone marrow stem cell differentiation [14-16]. Heme oxygenase which exists in two forms, HO-1 (inducible) and HO-2 (constitutive), catalyzes the rate-limiting step in heme degradation, resulting in the formation of carbon monoxide (CO), iron and biliverdin, the latter is subsequently reduced to bilirubin by biliverdin reductase. Additionally, both CO and nitric oxide (NO) protect against tumor necrosis factor-induced apoptosis in osteoblasts [17]. In addition, during fracture repair, activation of HIF-1 and its target genes, VEGF and HO-1, regulate osteoblasto-genesis and bone reabsorption [18] suggesting a role of HO-1 in bone metabolism. Finally, several lines of evidence suggest that HO-1 plays an important physiological role in obesity and diabetes. Increased HO-1 expression decreases adipogenesis in obese animals [4, 5, 19]. However, the role of HO-1 expression in mesenchymal stem cell (MSC) development and differentiation into either osteoblasts or adipocyte stem cells is poorly understood. HO-1 expression and its role in diabetes and other pathologies is a burgeoning area of research [20]. HO-1 is a target gene for the prevention of diabetes and obesity. Increased HO-1 expression resulted in higher adiponectin levels, and improved insulin sensitivity [19].
The goal of the present study was to determine whether HO-1 and HO-2 expression shifts the balance of MSC-mediated lineage expression towards osteoblast or adipocyte differentiation. MSC are multipotent cells that have the potential to proliferate and differentiate into a variety of cell types characteristic of bone, skeletal and cardiac muscle, adipose tissue, and neural cells [21-24] and are used as a model system to study the effect of HO-1 expression on osteoblast and adipocyte differentiation. We report here that inducers of HO-1 expression such as OGP, affects osteoblast differentiation via increased levels of HO-1, pAKT and eNOS. We demonstrate that osteoblast differentiation is positively regulated by HO-1 expression, which was associated with a reduction of reactive oxygen species (ROS), thereby permitting the restoration of osteoblast markers, specifically, induction of OPG and osteocalcin, while HO-1 expression negatively regulate adipocyte stem cell differentiation.
MATERIALS AND METHODS
Cell culture from BM and differentiation into osteoblasts
Frozen bone marrow mononuclear cells were purchased from Allcells (Allcells, Emeryville, CA). After thawing the cells, mononuclear cells were resuspended in an α-minimal essential medium (α-MEM, Invitrogen, Carlsbad CA) supplemented with 20% heat inactivated fetal bovine serum (FBS, Invitrogen, Carlsbad, CA) and 1% antibiotic/antimycotic solution (Invitrogen, Carlsbad, CA). The cells were plated at a density of 1-5X10⁶ cells per 100 cm2 dish. The cultures were maintained at 37 °C in a 5% CO2 incubator, and the medium was changed after 48h and every 3~4 days thereafter. When the MSCs were confluent, the cells were recovered by the addition of 0.25% trypsin/EDTA (Life Technologies, Frederick, MD). Mesenchymal stem cells (MSCs Passage 2-3) were plated in a 60-cm2 dish at a density of 1-2X10⁴ and cultured in α-MEM with 10% FBS for 7 days at 37°C. HO-1 silencing was achieved by infecting cells two days after seeding with a commercially available lentiviral siRNA for HO-1, at a viral total of 4-6 transduction units per milliliter; as a control, a siRNA scrambled mixture was used. siRNA HO-1 was purchased from Sigma-Aldrich, St. Louis, MO.
Beginning at day 7, cultures were switched to differentiation medium in phenol red-free BGJb (Fitton-Jackson modification) and supplemented with 5% FBS containing 50 μg/ml ascorbic acid (for appropriate collagen and extracellular matrix production). From day 14 forward, 3 mM β-glycerophosphate (for appropriate mineralization) was added to the differentiation media. For some studies, cultures were grown entirely in phenol red-free Ham's F-12 with 5% FBS without the addition of differentiation medium.
HO-1 siRNA transfection
Cells were treated with three different predesigned siRNAs of HO-1 gene (SASI_ Hs01_00035068, SASI_Hs01_00035065 and SASI_Hs01_00035067 from Sigma-Aldrich, St. Louis, MO). According to the manufacture's protocol, Osteogeneic media containing siRNA using N-TER (Sigma-Aldrich, St. Louis, MO) was replaced every 48 hours. Briefly, nanoparticle solution was incubated with 10nM siRNA. After 20 min, cells were treated with siRNA solution, with or without OGP during osteogenesis for 21 days.
DNA content and fragmentation
Osteoblasts were plated (4,000 cells/96well) in two plates, for cellular density using CyQuant™ kit (Molecular Probes, Eugene, OR) and for the fragmentation DNA assay using Apostain Elisa Kit (Alexis Biochemicals, Inc, Plymouth Meeting, PA) according to the manufacture's protocol. Cultures were treated with both Osteogeneic media and OGP for 21 days.
Alkaline phosphatase activity
Cells were plated in six-well plates. Cell layers were washed twice with ice-cold phosphate-buffered saline (PBS), then harvested in 1 ml 50 mM Tris-HCl (pH 7.6), sonicated twice on ice, and then centrifuged at 4°C for 15 min at 1000 xg. The supernatants were stored at −20°C until analysis for alkaline phosphatase activity was conducted, using p-nitrophenylphosphate as substrate. Absorbance was read at 405 nm using a microplate reader. Alkaline phosphatase activity was expressed as nmol p-nitrophenol released/min per μg DNA. All analyses were replicated 6 times. Each experiment was repeated two or three times.
Measurement of DNA content and bone mineralization
Osteoblasts were plated in six-well plates. Cell layers were washed twice with ice-cold PBS, harvested in 50 mM Tris-HCl (pH 7.6), sonicated, and then centrifuged for 15 min at 1000 xg. The supernatants were analyzed for DNA content by measuring fluorescence at 458 nm spectrophotometrically, using purified calf thymus as a DNA standard [25]. All analyses were performed in six replicates. Bone mineralization was determined using Alizarin Red S (Sigma-Aldrich, St. Louis, MO) staining and phase-contrast microscopy 21 days after treatment. Cell were incubated with 2% alizarin red at pH 4.2 for 10 minutes and subsequently washed with distilled water. Subcultured cells were examined by phase-contrast microscopy at 21 days to determine cell morphology and to verify the presence of mineralized nodules.
Immunoblot analysis
Osteoblasts or adipocytes were incubated with stimulants in T75 flasks for 24 h. They were then washed with PBS and trypsinized (0.05% trypsin w/v with 0.02% EDTA). The pellets were lysed in buffer (Tris-Cl 50 mM, EDTA 10 mM, Triton X-100 1% v/v, PMSF 1%, pepstatin A 0.05 mM and leupeptin 0.2 mM) and, after mixing with sample loading buffer (Tris-Cl 50 mM, SDS 10% w/v, glycerol 10% v/v, 2-mercaptoethanol 10% v/v and bromophenol blue 0.04%) at a of ratio 4:1, were boiled for 5 min. Samples (10 μg protein) were loaded onto 12% gels and subjected to electrophoresis (150 V, 80 min). The separated proteins were transferred to nitrocellulose membranes (Bio-Rad, Hercules, CA; 1 h, 200 mA per gel). After transfer, the blots were incubated overnight with 5% nonfat milk in TTBS followed by incubation with 1:1000 dilution of the primary antibody for 3 h. Polyclonal rabbit antibodies directed against the human HO-1, AMPK, pAMPK, peNOS, HO-2 were obtained from Stressgen Biotechnologies (Victoria, BC). After washing with TTBS, the blots were incubated for 2 h with secondary antibody (1:5000) and conjugated with alkaline phosphatase. Finally, the blots were developed using a premixed solution containing 0.56 mM 5-bromo-4-chloro-3-indolyl phosphate (BCIP) and 0.48 mM nitro blue tetrazolium (NBT) in buffer (Tris-HCl 10 mM, NaCl 100 mM, MgCl2 59.3 μM, pH 9.5). The blots were scanned and the optical density of the bands was measured using Scion (New York, NY) Image software.
Human bone marrow derived adipocyte mesenchymal stem cells
Frozen bone marrow mononuclear cells were purchased from Allcells (Allcells, Emeryville, CA). After thawing the cells were resuspended in an α-minimal essential medium (α-MEM, Invitrogen, Carlsbad CA) supplemented with 10% heat inactivated fetal bovine serum (FBS, Invitrogen, Carlsbad CA) and 1% antibiotic/antimycotic solution (Invitrogen, Carlsbad CA). The cells were plated at a density of 1-5X10⁶ cells per 100 cm2 dish. The cultures were maintained at 37 °C in a 5% CO2 incubator, and the medium was changed after 48h and every 3-4 days thereafter. When the MSCs were confluent, the cells were recovered by the addition of 0.25% trypsin/EDTA (Life Technologies, Frederick, MD). MSCs (Passage 2-3) were plated in a 60-cm2 dish at a density of 1-2X10⁴ and cultured in α-MEM with 10% FBS for 7 days. The medium was replaced with adipogenic medium, and the cells were cultured for an additional 21 days. The adipogenic medium consisted of complete culture medium supplemented with OM EM-high glucose, 10% (v/v) FBS, 10 μg/ml insulin, 0.5 mM dexamethasone (Sigma-Aldrich, St. Louis, MO), 0.5 mM isobutylmethylxanthine (Sigma-Aldrich, St. Louis, MO) and 0.1 mM indomethacin (Sigma-Aldrich, St. Louis, MO).
Oil Red O staining
For Oil Red O staining, 0.5% Oil Red O solution (Sigma-Aldrich, St. Louis, MO) was used. Briefly, adipocytes were fixed in 1% formaldehyde, washed in Oil-red O for 20 min, rinsed with 85% propylene glycol (Sigma-Aldrich, St. Louis, MO) for 3 min, washed in distilled water and mounted with aqueous mounting medium, [26].
Heme oxygenase activity assay
HO activity was assayed in homogenates of osteoblasts. Cell homogenates were incubated with 50 μM heme, 2 mg/ml rat liver cytosol (as a source of biliverdin reductase), 1 mM MgCl2, 3 units glucose-6-phosphatase dehydrogenase, 1 mM glucose-6-phosphate and 2 mM NADP+ in 0.5 ml 0.1 M potassium phosphate buffer, pH 7.4, for 30 min at 37°C. The reaction was terminated by placing the tubes on ice and bilirubin was then extracted with chloroform. The amount of bilirubin generated was determined using a dual-beam scanning spectrophotometer (Perkin-Elmer, Norwalk, CT, Lambda 17 UV/VIS) and is defined as the difference between 464 and 530 nm (extinction coefficient: 40 mM-1 cm-1 for bilirubin). The results were expressed as nmol of bilirubin/5×106 cells/h. Tin mesoporphyrin (SnMP), purchased from Frontier Science, Logan UT, was used to inhibit heme oxygenase activity [27]. Cobalt protoporphyrin (CoPP) was purchased from Frontier Science, Logan UT to induce HO-1 expression and HO activity [28].
mRNA isolation and real-time PCR quantification
Total RNA was isolated using Trizol® (Invitrogen, Carlsbad, CA) according to the manufacturer's instructions. First strand cDNA was synthesized with Roche reverse transcription reagents. Total RNA (1 μg) was analyzed by real-time PCR.
The quantitative real-time polymerase chain reaction (qRT-PCR) was performed with the TaqMan gene expression assay on an ABI Prism 7900 sequence analyzer according to the manufacturer's recommended protocol (Applied Biosystems, Foster City, CA). Each reaction was run in triplicate. The comparative threshold cycle (CT) method was used to calculate the amplification fold as specified by the manufacturer. A value of 10 ng of reverse-transcribed RNA samples was amplified by using the TaqMan Universal PCR Master Mix and TaqMan gene expression assays (ID Hs01055564_m1 for human BMP-2, ID Hs00231692_m1 for RUNX2, ID HS99999901_s1 for 18S as an endogenous control; Applied Biosystems).
ELISA assay for osteocalcin and osteoprotegerin
By using a specific ELISA test, according to the manufacturer's recommendation, we evaluated the levels of osteocalcin (BioSource International, Inc., Camarillo, CA, USA) and OPG (osteoprotegerin) in the culture supernatant (BioVendor Laboratory Medicine, Modrice, Czech Republic).
Statistical analysis
Data are presented as mean ± standard error (SE) for the number of experiments. Statistical significance (p<0.05) was determined by the Fisher method of multiple comparisons. For comparison between treatment groups, the null hypothesis was tested by single factor analysis of variance (ANOVA) for multiple groups or unpaired t-test for two groups.
RESULTS
Effect of OGP on HO-1 protein levels and HO activity
The basal levels of HO-1 expression increased during MSC osteoblast-culture growth and peaked at 20 days following treatment with OGP. HO activity followed a similar pattern but with a peak at day 15 (p<0.05) and then gradually declining (Figure 1B). HO-2 protein levels did not change during osteoblast proliferation in absence of OGP (day 5 and 10) or in presence of OGP (Figure 1A and 1B). To examine whether HO-1 protein expression was associated with a corresponding increase in osteoblast proliferation and differentiation, the temporal sequence of differentiation was also determined. Alkaline phosphatase (AP) activity gradually increased, reaching a maximum at day 20, where it plateaued. OGP treatment significantly (p<0.05) increased AP levels above control, Figure 1C. A temporal increase in DNA (μg/plate) followed a pattern similar to that of HO-1 protein. As seen in Figure 1D, DNA accumulation in control increased to reach a maximum at day 15, and declined to low levels at 25 days. OGP treatment resulted in significantly (p<0.05) increased levels of DNA at days 10, 15 and 20 over control.
Figure 1.
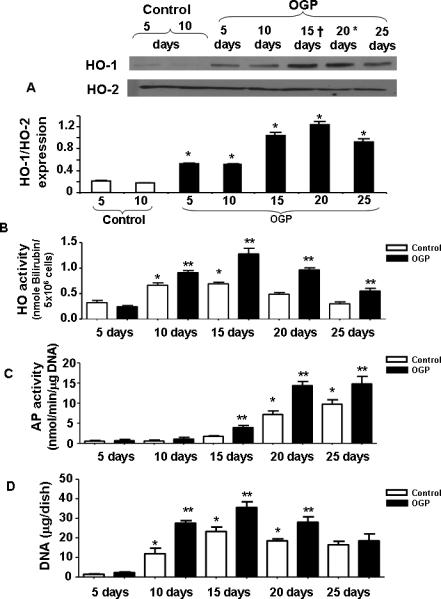
A) Effect of OGP (Upper panel) and protein levels in osteoblasts as a function of time during the periods of proliferation and differentiation. Western blot analyses of HO proteins in osteoblast homogenates were performed using antibodies against human HO-1 and HO-2 proteins. Blots shown are representative of 3 separate experiments. B) Effect of OGP on HO activity in isolated cell homogenates of cells harvested after 5, 10, 15, 20 and 25 days of growth. HO activity in osteoblasts was measured as described in Methods. Results are the mean ± SE; n=3; *p<0.05 compared to 5 days OGP treated, effect of OGP on AP activity C) and, DNA accumulation D) AP activity and DNA content were measured as described in the Methods. Data presented are the result of 3 separate experiments. *p<0.001.
Effect of OGP on differentiation of mesenchymal stem cells in osteoblastic cells
PCR quantification of undifferentiated MSCs and of cells at day 21 after culture in differentiation medium confirmed that the cells were positive for early mature osteoblastic markers such as BMP-2, RUNX-2, osteonectin and osteocalcin (Figure 2A). The effect of OGP real time PCR Quantification of osteonectin mRNA indicated a time dependent increase reaching a maximum at day 15 followed by a decline at day 21. BMP-2 and RUNX-2 exhibited a similar time-dependent increase that peaked at day 21 of OGP exposure (Figure 2B).
Figure 2.
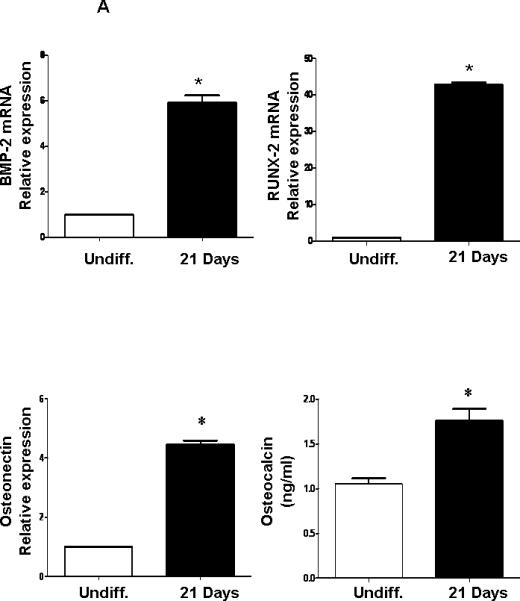
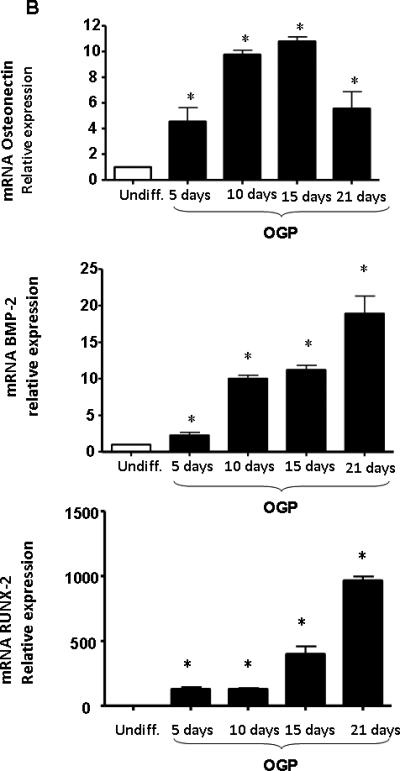
A: Expression of osteoblastic markers in differentiated MSCs by PCR. qRTPCR revealed a marked increase in BMP-2, RUNX2, osteocalcin and osteonectin at 21 days of osteoblastic differentiation. Bars represent the mean ± SEM of three independent experiments. *p < 0.05 vs. undifferentiated cells. B) Expression of mRNA of osteonectin, BMP-2 and RUNX-2 with time of exposure to OPG (10-6M). The results are of 3 independent experiments. *p<0.05 vs undifferentiated cells.
Effect of OGP on eNOS, peNOS and pAKT
To investigate the possibility that differential activation of eNOS, peNOS and the anti-apoptotic signaling molecule pAKT could account for the increase in osteoblast cell proliferation and differentiation, we assessed the levels of these protein after 10 days of culture in the presence of OGP. As seen in Figure 3, OGP treatment resulted in a significant (p<0.05) increase in the amount of HO-1 protein. OGP supplementation also resulted in a significant increase in the anti-apoptotic protein pAKT. Upregulation of HO activity by OGP also resulted in a significant increase in eNOS and peNOS. It should be noted that the significant increase in pAKT occurred without any change in AKT (p<0.05, Figure 3).
Figure 3.
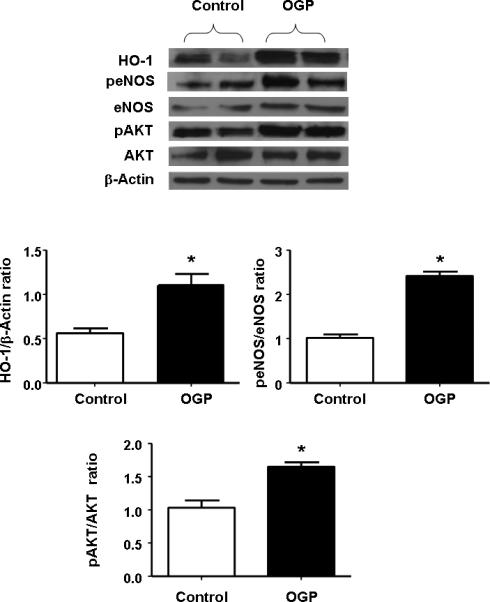
Western blot and densitometry analysis of effect of OGP on HO-1 expression, peNOS, and eNOS, pAKT, and AKT proteins measured after 21 days of osteoblast differentiation. We performed quantitative densitometry evaluation of p-eNOS, eNOS, pAKT, AKT in the cells. *p < 0.05 Control vs. OGP. Each bar represents mean SE± of 3 experiments.
Effect of OGP on HO-1 expression and pAMPK in the presence of siRNA
We tested the hypothesis that OGP increases signaling molecules in osteoblasts via an increase in HO-1. MSC were transduced with HO-1 siRNA to test whether this treatment could inhibit HO-1 mRNA and the signaling molecule pAMPK expression. The results presented in Figure 4A, strongly support the hypothesis, OGP increased both HO-1 and pAMPK expression in osteoblasts. HO-1 siRNA, added to osteoblast cells dramatically reduced both HO-1 expression (Figure 4A) and pAMPK levels (Figure 4B).
Figure 4.
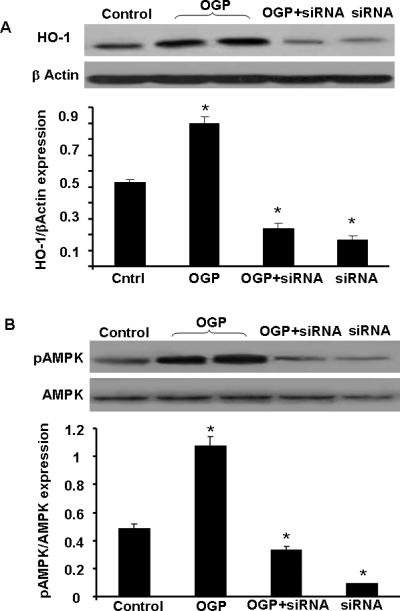
A) Western blot analysis of HO in osteoblasts homogenates treated with OGP (10 -6M) for 10 days. In the presence and absence of siRNA HO-1. Immunoblots were performed using antibodies against human HO-1 protein. Blots shown are representative of 3 separate experiments, *<0.05 B) Effect of siRNA HO-1 on OGP-mediated pAMPK activation. *p<0.05 and **p<0.01, compared to OGP, n=4.
Effect of high glucose levels on OPG and osteocalcin levels during osteoblastic differentiation: Role of OGP
We verified whether suppression of HO-1 as a result of hyperglycemia (glucose 20 mM) can affect other gene expression. OPG expression (Figure 5A) and osteocalcin secretion (Figure 5B) during differentiation was significantly (p<0.05) decreased when MSC were exposed to glucose (20 mM) compared to untreated cells. In addition, OGP treatment in the presence of glucose resulted in an increase in osteocalcin levels after secretion was reduced by a high glucose concentration. Similarly, glucose exposure showed a significant (p<0.05) reduction in osteonectin secretion compared to untreated control cells (data not shown). This is the first demonstration that OGP can protect osteoblast from hyperglycemia by increasing the levels of OPG and osteocalcin (Figure 5A and B) during osteoblast cell growth and differentiation. Inhibition of HO activity by SnMP treatment in the presence of glucose abrogated OGP-mediated increases in both OPG and osteocalcin (Figures 5A and B).
Figure 5.
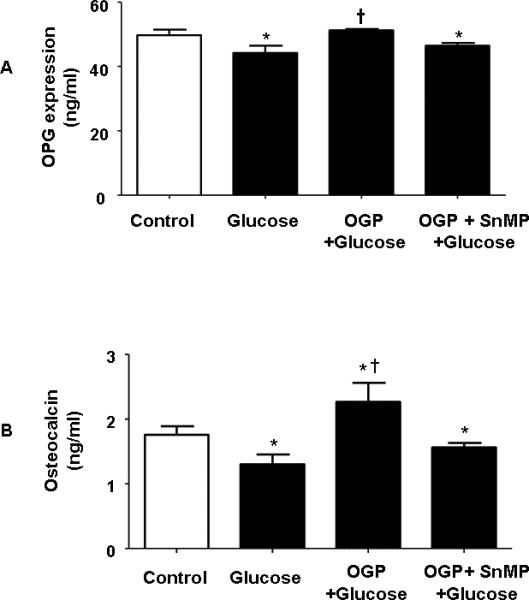
A and B) Effect of Glucose (30 mM), OGP + Glucose and SnMP + Glucose OGP + on osteoblast marker expression. ELISA shows an increase of OPG A) and osteocalcin B) those samples treated vehicle solution, control, glucose, glucose + OGP, glucose + OGP + SnMP. Control bars represent the mean ± SEM of three independent experiments. *p < 0.05 vs. undifferentiated cells +p<0.05 compared to glucose. Addition of SnMP caused a statistically significant reduction in the expression of both. p<.05.
Effect of OGP and glucose on HO-1, eNOS, peNOS, pAMPK and pAKT expression
The induction of diabetes by culturing cells in glucose resulted in a significant decrease in HO-1 protein levels Figure 6A. This decrease was partially restored by culturing the cells in the presence of OGP. Similarly, eNOS and pAMPK phosphorylation were decreased by culturing osteoblasts in glucose, Figure 6A. OGP treatment had no effect on AMPK expression. However, there was a significant (p<0.05) increase in the expression of pAMPK and eNOS (Figure 6A). As seen in Figure 6B, pAKT phosphorylation was decreased by culturing osteoblasts in glucose and there was no affect on AKT. The presence of OGP reversed the effect of glucose and increased activation of pAKT. The changes in protein expression of pAKT (Figure 6B) mirrored those seen with HO-1 protein expression (Figure 6A). Similarly, MSCs cultured with SnMP, an inhibitor of HO-1/-2 activity [29], and glucose displayed a significant p<0.05 decrease in pAKT (Figure 6B) compared to MSC-cultured with OGP and glucose.
Figure 6.
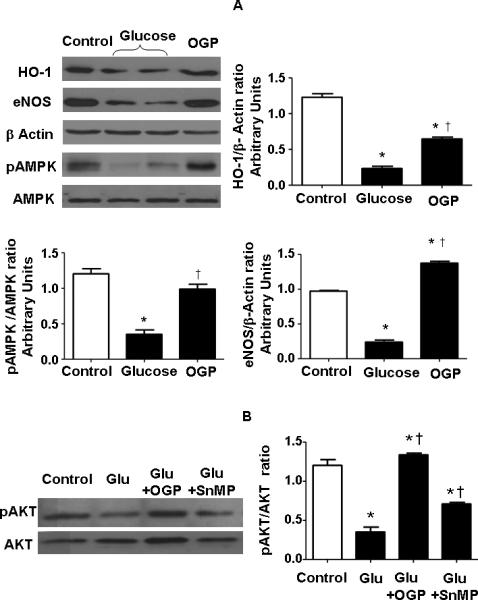
A) Lysates of osteoblasts cultured in the presence of a high glucose concentration (30 mM) and OGP were assayed. Representative Western blots are shown for HO-1, eNOS, pAMPK, AMPK, and actin proteins. Bars represent the mean ± SEM of four independent experiments B) pAKT and AKT levels were measured in presence of vehicle solution, glucose (30 mM), glucose + OGP in combination with SnMP. Both CoPP and OGP increased pAKT levels. *p < 0.05 vs. differentiated cells (Control); †p < 0.05 vs. glucose.
Effect of HO-1 induction on osteogenesis, adipogenesis and PPARγ levels
We used a potent inducer of HO-1, CoPP, to assess the differential effect of HO-1 on osteogenesis and adipogenesis. CoPP treatment resulted in an increase in bone mineralization when measured at day 21 (Figure 7A). The increase was significant (p<0.01) when compared to vehicle. In contrast, the reverse was seen on adipogenesis with a significant (p<0.05) decline apparent at day 21 (Figure 7B). In agreement with the effect of HO-1 on adipogenesis, Figure 7C, the decline in HO-1 expression at day 10 of adipogenic differentiation (p<0.05) was accompanied by a significant (p<0.01) increase in the levels of PPARγ (Figure 7C). In addition, HO-1 siRNA increased the area of lipid droplets, i.e. adipogenesis (Figure8).
Figure 7.
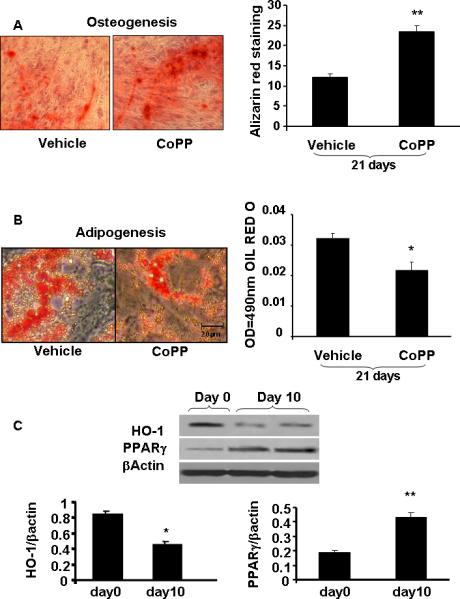
Samples were stained as described in Methods to determine A) bone mineralization. CoPP (2.0 μM) was added once every 5 days during culture media change for 21 days. These pictures are representative of 3 repeated experiments at 16 days, **p<0.01 and *p<0.05 compared to control. B) Adipogenesis MSC were treated with 2.0 μM CoPP for 14 days and lipid droplets were stained with Oil red O then measured adipogenesis on 490nm wave length. Levels of significance: *p<0.05 Control vs CoPP; and C) Effect of HO-1 expression on PPARγ expression, *p<0.05, **p<0.02, n=4.
Figure 8.
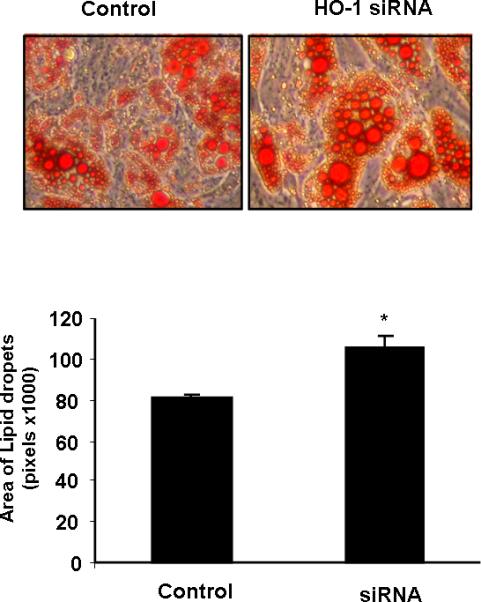
The effect of HO-1 siRNA on adipogenesis. Lipid droplets area was determined by Oil red O staining after 21 days. *p<0.05 control vs HO-1 siRNA
DISCUSSION
In the present study we show, for the first time, that the upregulation of HO-1 increases MSC-mediated osteoblasts lineages but decreases adipocytes. The OGP-mediated increase in HO-1 levels increases osteoblast proliferation and differentiation, and is associated with an increase in osteoblast function, via an increase in AKT. A significant increase in OGP-mediated cell proliferation was observed while, in contrast, both SnMP, a competitive inhibitor of HO activity, and HO-1 siRNA, reversed the OGP-mediated effect, suggesting that the effect of OGP was dependent on an increase in both HO-1 expression and HO activity. To further explore the functional expression of HO-1 in human MSC-mediated osteoblast lineages, we measured AP, DNA accumulation and bone mineralization. The increase in HO-1 resulted in an increase in the rate of AP and DNA accumulation and mineralization as a function of time when compared to untreated osteoblasts. In addition, osteoblasts cultured in the presence of an inhibitor of HO-1, as in cells exposed to high glucose, exhibited a decrease in the levels of BMP-2, osteonectin, pAMPK and eNOS. However, upregulation of HO-1 by OGP in cultured osteoblasts rescued the hyperglycemia-mediated decrease in BMP-2, HO-1, eNOS and pAMPK. Previous studies have shown that eNOS was expressed in osteoblasts and that a deficiency of this enzyme resulted in a significant reduction in bone formation in mice [30]. Thus, the OGP-mediated increase HO-1 and eNOS can be regarded as a pivotal step in bone metabolism through an ability to modulate osteoblast function. eNOS and NO are stimulators of the levels of BMP-2 and increase differentiation of osteoblasts [31, 32].
More recently, we reported that HO-1 overexpression in animal models of both type 1 and type II diabetes attenuates vascular dysfunction via an increase in pAMPK and AKT and a decrease in oxidative stress [4, 28, 33]. Diabetes affects the integrity and functionality of bone tissue [34-36] possibly through increased adiposity [37]. Patients with diabetes frequently show either low bone mass (osteopenia) or increased bone mineral density with an increased risk of fracture and an impairment in bone healing [38], presumably, due to stimulation of osteoblast apoptosis [39], recently reviewed [40].
Finally, the present data demonstrate a differential effect of HO-1 on MSC-mediated adipocyte stem cells. We investigated the effect of HO-1 expression on differentiation. A clear induction of adipogenic transformation was observed upon exposure of MSC to glucose. The capacity of high glucose to activate adipogenic differentiation has been described in isolated adipocytes [19] and was shown to be dependent on suppression of HO-1. In agreement with these results glucose increased adipogenesis and this was assocated with the suppression of HO-1 protein levels. Glucose has been shown to suppress HO-1 promoter and HO-1 levels [41, 42]. High glucose suppressed HO-1 expression in cell lines [42-44] as well as in animal models [19, 45, 46]. In fact, supplementation of high glucose, 20 mM, increased adipogenesis which was further increased in the presence of HO-1 siRNA (Figure 8). The identification that inhibition of HO-1 expression increased the MSC-shift towards adipocytes has at least two important conceptual implications. Firstly, high glucose has an adipogenic potential, secondly, a direct link exists between the suppression of HO-1 and the increase in adipogenesis and metabolic syndrome. Upregulation of HO-1 was involved in detecting and decoding a variety of stress conditions including hyperglycemia and angiotensin II-mediated stress [4]. We recently showed that HO-1 recruits the EC-SOD to act as an anti-oxidant and to dissipate H2O2 [45] and in triggering an increase in adiponectin and the signaling pathway pAMPK- pAKT [47]. Additionally, Figure 7 shows that HO-1 expression decreased during differentiation, while PPARγ levels increased. PPARγ is commonly referred to as the master regulator of adipogenesis [48, 49]. Ectopic expression and activation of PPARγ are sufficient to induce adipocyte differentiation. Given the role of HO-1 expression in preventing obesity [15], it is possible that the differential role of HO-1 in adipocytes and osteoblast lineage might represent a strategy to curb adiposity and increase osteogenesis.
The results of the present study show that increased HO-1 expression and HO activity are essential for MSC growth to the osteoblast lineage and is consistent with the role of HO-1 in hematopoietic stem cell differentiation [14, 15, 50] in which HO-1 regulates stem cell differentiation to a number of lineages [14-16]. The HO-1/HO-2 system participates in the regulation of cell differentiation in osteoblasts and adipocytes in a cell-specific but very different manner. Although, the basal levels of HO-1 protein and HO activity are needed for osteoblast cell growth, an increase in the basal level of HO-1 resulted in the enhancement of osteoblast differentiation. Induction of HO-1 is essential for the resultant increase in pAKT, pAMPK, peNOS levels and NO bioavailability [5, 28, 47]. An increase in NO may be necessary for OGP-mediated osteoblastic acitivity [51]; upregulation of NO was shown to play a positive role in bone formation [30-32]. Although the mechanism by which HO-1 overexpression decreased adipocyte differentiation but increased osteoblast differentiation is still unclear, it is apparent that HO activity and its products, bilirubin, CO, and iron, play a different role in cell proliferation. More recently, it was shown that the elevation of HO-1-derived CO in endothelial cells, enhanced endothelial cell proliferation [52, 53]. In contrast, increased HO-1 levels caused a decrease in vascular smooth cells [4]. The effect of HO-1 expression on osteoblasts and adipocytes is mirrored by the effect of HO-1 on endothelial cells and vascular smooth muscle cells. In fact, adipocyte stem cells from both obese rats and mice have low levels of HO-1 protein and HO activity, which may reflect an increase in adiposity [4, 19]. Upregulation of HO-1 in obesity decreases adiposity and increases adiponectin [4]. Thus, the site-specific delivery of HO-1 to adipocytes may play a regulatory role in the prevention of adipocyte differentiation in a variety of vascular diseases including metabolic syndrome [4]. Our results provide direct evidence that HO-1 gene expression has a differential effect on osteoblast and adipocyte cell proliferation and differentiation. Thus, by manipulating the expression of HO-1, it will be possible to attenuate the hyperglycemia-mediated inhibition of osteoblast differentiation, while simultaneously inhibiting adipocyte differentiation and thereby offereing potential in the management of the metabolic syndrome.
ACKNOWLEDGEMENTS
This work was supported by NIH grants DK068134, HL55601 and HL34300 (NGA).
List of Abbreviations
- HO-1
heme oxygenase-1
- AP
alkaline phosphatase
- VEGF
vascular endothelial growth factor
- OGP
osteogenic growth peptide
- NO
nitric oxide
- CO
carbon monoxide
- MSC
mesenchymal stem cell
- ROS
reactive oxygen species
- EGF
endothelial growth factor
Footnotes
Publisher's Disclaimer: This is a PDF file of an unedited manuscript that has been accepted for publication. As a service to our customers we are providing this early version of the manuscript. The manuscript will undergo copyediting, typesetting, and review of the resulting proof before it is published in its final citable form. Please note that during the production process errors may be discovered which could affect the content, and all legal disclaimers that apply to the journal pertain.
REFERENCES
- 1.Muruganandan S, Roman AA, Sinal CJ. Adipocyte differentiation of bone marrow-derived mesenchymal stem cells: cross talk with the osteoblastogenic program. Cell Mol Life Sci. 2009;66:236–53. doi: 10.1007/s00018-008-8429-z. [DOI] [PMC free article] [PubMed] [Google Scholar]
- 2.Hamilton EJ, Rakic V, Davis WA, Chubb SA, Kamber N, Prince RL, Davis TM. Prevalence and predictors of osteopenia and osteoporosis in adults with Type 1 diabetes. Diabet Med. 2009;26:45–52. doi: 10.1111/j.1464-5491.2008.02608.x. [DOI] [PubMed] [Google Scholar]
- 3.Fowlkes JL, Bunn RC, Liu L, Wahl EC, Coleman HN, Cockrell GE, Perrien DS, Lumpkin CK, Jr., Thrailkill KM. Runt-related transcription factor 2 (RUNX2) and RUNX2-related osteogenic genes are down-regulated throughout osteogenesis in type 1 diabetes mellitus. Endocrinology. 2008;149:1697–704. doi: 10.1210/en.2007-1408. [DOI] [PMC free article] [PubMed] [Google Scholar]
- 4.Abraham NG, Kappas A. Pharmacological and clinical aspects of heme oxygenase. Pharmacol Rev. 2008;60:79–127. doi: 10.1124/pr.107.07104. [DOI] [PubMed] [Google Scholar]
- 5.Peterson SJ, Drummond G, Hyun KD, Li M, Kruger AL, Ikehara S, Abraham NG. L-4F treatment reduces adiposity, increases adiponectin levels and improves insulin sensitivity in obese mice. J Lipid Res. 2008;49:1658–69. doi: 10.1194/jlr.M800046-JLR200. [DOI] [PMC free article] [PubMed] [Google Scholar]
- 6.Tuominen JT, Impivaara O, Puukka P, Ronnemaa T. Bone mineral density in patients with type 1 and type 2 diabetes. Diabetes Care. 1999;22:1196–200. doi: 10.2337/diacare.22.7.1196. [DOI] [PubMed] [Google Scholar]
- 7.Yaturu S, Humphrey S, Landry C, Jain SK. Decreased bone mineral density in men with metabolic syndrome alone and with type 2 diabetes. Med Sci Monit. 2009;15:CR5–CR9. [PubMed] [Google Scholar]
- 8.Inaba M, Terada M, Koyama H, Yoshida O, Ishimura E, Kawagishi T, Okuno Y, Nishizawa Y, Otani S, Morii H. Influence of high glucose on 1,25-dihydroxyvitamin D3-induced effect on human osteoblast-like MG-63 cells. J Bone Miner Res. 1995;10:1050–6. doi: 10.1002/jbmr.5650100709. [DOI] [PubMed] [Google Scholar]
- 9.Terada M, Inaba M, Yano Y, Hasuma T, Nishizawa Y, Morii H, Otani S. Growth-inhibitory effect of a high glucose concentration on osteoblast-like cells. Bone. 1998;22:17–23. doi: 10.1016/s8756-3282(97)00220-2. [DOI] [PubMed] [Google Scholar]
- 10.Lin SS, Landesberg R, Chin HS, Lin J, Eisig SB, Lu HH. Controlled Release of PRP-Derived Growth Factors Promotes Osteogenic Differentiation of Human Mesenchymal Stem Cells. Conf Proc IEEE Eng Med Biol Soc. 2006;1:4358–61. doi: 10.1109/IEMBS.2006.260847. [DOI] [PubMed] [Google Scholar]
- 11.Chen ZX, Chang M, Peng YL, Zhao L, Zhan YR, Wang LJ, Wang R. Osteogenic growth peptide C-terminal pentapeptide [OGP(10-14)] acts on rat bone marrow mesenchymal stem cells to promote differentiation to osteoblasts and to inhibit differentiation to adipocytes. Regul Pept. 2007;142:16–23. doi: 10.1016/j.regpep.2007.01.003. [DOI] [PubMed] [Google Scholar]
- 12.Spreafico A, Frediani B, Capperucci C, Leonini A, Gambera D, Ferrata P, Rosini S, Di SA, Galeazzi M, Marcolongo R. Osteogenic growth peptide effects on primary human osteoblast cultures: potential relevance for the treatment of glucocorticoid-induced osteoporosis. J Cell Biochem. 2006;98:1007–20. doi: 10.1002/jcb.20836. [DOI] [PubMed] [Google Scholar]
- 13.Weinstein RS, Chen JR, Powers CC, Stewart SA, Landes RD, Bellido T, Jilka RL, Parfitt AM, Manolagas SC. Promotion of osteoclast survival and antagonism of bisphosphonate-induced osteoclast apoptosis by glucocorticoids. J Clin Invest. 2002;109:1041–8. doi: 10.1172/JCI14538. [DOI] [PMC free article] [PubMed] [Google Scholar]
- 14.Abraham NG, Nelson JC, Ahmed T, Konwalinka G, Levere RD. Erythropoietin controls heme metabolic enzymes in normal human bone marrow culture. Exp Hematol. 1989;17:908–13. [PubMed] [Google Scholar]
- 15.Abraham NG. Molecular regulation--biological role of heme in hematopoiesis. Blood Rev. 1991;5:19–28. doi: 10.1016/0268-960x(91)90004-v. [DOI] [PubMed] [Google Scholar]
- 16.Abraham NG, Lutton JD, Levere RD. Heme metabolism and erythropoiesis in abnormal iron states: role of delta-aminolevulinic acid synthase and heme oxygenase. Exp Hematol. 1985;13:838–43. [PubMed] [Google Scholar]
- 17.Chae HJ, Chin HY, Lee GY, Park HR, Yang SK, Chung HT, Pae HO, Kim HM, Chae SW, Kim HR. Carbon monoxide and nitric oxide protect against tumor necrosis factor-alpha-induced apoptosis in osteoblasts: HO-1 is necessary to mediate the protection. Clin Chim Acta. 2006;365:270–8. doi: 10.1016/j.cca.2005.09.011. [DOI] [PubMed] [Google Scholar]
- 18.Zwerina J, Tzima S, Hayer S, Redlich K, Hoffmann O, Hanslik-Schnabel B, Smolen JS, Kollias G, Schett G. Heme oxygenase 1 (HO-1) regulates osteoclastogenesis and bone resorption. FASEB J. 2005;19:2011–3. doi: 10.1096/fj.05-4278fje. [DOI] [PubMed] [Google Scholar]
- 19.Li M, Kim DH, Tsenovoy PL, Peterson SJ, Rezzani R, Rodella LF, Aronow WS, Ikehara S, Abraham NG. Treatment of obese diabetic mice with a heme oxygenase inducer reduces visceral and subcutaneous adiposity, increases adiponectin levels, and improves insulin sensitivity and glucose tolerance. Diabetes. 2008;57:1526–35. doi: 10.2337/db07-1764. [DOI] [PubMed] [Google Scholar]
- 20.Wagener FA, Volk HD, Willis D, Abraham NG, Soares MP, Adema GJ, Figdor CG. Different faces of the heme-heme oxygenase system in inflammation. Pharmacol Rev. 2003;55:551–71. doi: 10.1124/pr.55.3.5. [DOI] [PubMed] [Google Scholar]
- 21.Ferrari G, Cusella-De AG, Coletta M, Paolucci E, Stornaiuolo A, Cossu G, Mavilio F. Muscle regeneration by bone marrow-derived myogenic progenitors. Science. 1998;279:1528–30. doi: 10.1126/science.279.5356.1528. [DOI] [PubMed] [Google Scholar]
- 22.Pittenger MF, Mackay AM, Beck SC, Jaiswal RK, Douglas R, Mosca JD, Moorman MA, Simonetti DW, Craig S, Marshak DR. Multilineage potential of adult human mesenchymal stem cells. Science. 1999;284:143–7. doi: 10.1126/science.284.5411.143. [DOI] [PubMed] [Google Scholar]
- 23.Marie PJ, Fromigue O. Osteogenic differentiation of human marrow-derived mesenchymal stem cells. Regen Med. 2006;1:539–48. doi: 10.2217/17460751.1.4.539. [DOI] [PubMed] [Google Scholar]
- 24.Barbagallo I, Tibullo D, Di RM, Giallongo C, Palumbo GA, Raciti G, Campisi A, Vanella A, Green CJ, Motterlini R. A cytoprotective role for the heme oxygenase-1/CO pathway during neural differentiation of human mesenchymal stem cells. J Neurosci Res. 2008;86:1927–35. doi: 10.1002/jnr.21660. [DOI] [PubMed] [Google Scholar]
- 25.Labarca C, Paigen K. A simple, rapid, and sensitive DNA assay procedure. Anal Biochem. 1980;102:344–52. doi: 10.1016/0003-2697(80)90165-7. [DOI] [PubMed] [Google Scholar]
- 26.Bavendiek U, Zirlik A, LaClair S, MacFarlane L, Libby P, Schonbeck U. Atherogenesis in mice does not require CD40 ligand from bone marrow-derived cells. Arterioscler Thromb Vasc Biol. 2005;25:1244–9. doi: 10.1161/01.ATV.0000161420.55482.ef. [DOI] [PubMed] [Google Scholar]
- 27.Drummond GS, Galbraith RA, Sardana MK, Kappas A. Reduction of the C2 and C4 vinyl groups of Sn-protoporphyrin to form Sn- mesoporphyrin markedly enhances the ability of the metalloporphyrin to inhibit in vivo heme catabolism. Arch Biochem Biophys. 1987;255:64–74. doi: 10.1016/0003-9861(87)90294-3. [DOI] [PubMed] [Google Scholar]
- 28.Kruger AL, Peterson SJ, Schwartzman ML, Fusco H, McClung JA, Weiss M, Shenouda S, Goodman AI, Goligorsky MS, Kappas A, Abraham NG. Up-regulation of heme oxygenase provides vascular protection in an animal model of diabetes through its antioxidant and antiapoptotic effects. J Pharmacol Exp Ther. 2006;319:1144–52. doi: 10.1124/jpet.106.107482. [DOI] [PubMed] [Google Scholar]
- 29.Drummond GS, Kappas A. Chemoprevention of neonatal jaundice: potency of tin-protoporphyrin in an animal model. Science. 1982;217:1250–2. doi: 10.1126/science.6896768. [DOI] [PubMed] [Google Scholar]
- 30.Armour KE, Armour KJ, Gallagher ME, Godecke A, Helfrich MH, Reid DM, Ralston SH. Defective bone formation and anabolic response to exogenous estrogen in mice with targeted disruption of endothelial nitric oxide synthase. Endocrinology. 2001;142:760–6. doi: 10.1210/endo.142.2.7977. [DOI] [PubMed] [Google Scholar]
- 31.Mundy G, Garrett R, Harris S, Chan J, Chen D, Rossini G, Boyce B, Zhao M, Gutierrez G. Stimulation of bone formation in vitro and in rodents by statins. Science. 1999;286:1946–9. doi: 10.1126/science.286.5446.1946. [DOI] [PubMed] [Google Scholar]
- 32.Garrett IR, Gutierrez G, Mundy GR. Statins and bone formation. Curr Pharm Des. 2001;7:715–36. doi: 10.2174/1381612013397762. [DOI] [PubMed] [Google Scholar]
- 33.Kruger AL, Peterson S, Turkseven S, Kaminski PM, Zhang FF, Quan S, Wolin MS, Abraham NG. D-4F induces heme oxygenase-1 and extracellular superoxide dismutase, decreases endothelial cell sloughing, and improves vascular reactivity in rat model of diabetes. Circulation. 2005;111:3126–34. doi: 10.1161/CIRCULATIONAHA.104.517102. [DOI] [PubMed] [Google Scholar]
- 34.Hamada Y, Kitazawa S, Kitazawa R, Fujii H, Kasuga M, Fukagawa M. Histomorphometric analysis of diabetic osteopenia in streptozotocin-induced diabetic mice: a possible role of oxidative stress. Bone. 2007;40:1408–14. doi: 10.1016/j.bone.2006.12.057. [DOI] [PubMed] [Google Scholar]
- 35.Schwartz AV. Diabetes Mellitus: Does it Affect Bone? Calcif Tissue Int. 2003;73:515–9. doi: 10.1007/s00223-003-0023-7. [DOI] [PubMed] [Google Scholar]
- 36.Schwartz AV, Sellmeyer DE, Ensrud KE, Cauley JA, Tabor HK, Schreiner PJ, Jamal SA, Black DM, Cummings SR. Older women with diabetes have an increased risk of fracture: a prospective study. J Clin Endocrinol Metab. 2001;86:32–8. doi: 10.1210/jcem.86.1.7139. [DOI] [PubMed] [Google Scholar]
- 37.Botolin S, Faugere MC, Malluche H, Orth M, Meyer R, McCabe LR. Increased bone adiposity and peroxisomal proliferator-activated receptor-gamma2 expression in type I diabetic mice. Endocrinology. 2005;146:3622–31. doi: 10.1210/en.2004-1677. [DOI] [PMC free article] [PubMed] [Google Scholar]
- 38.Strotmeyer ES, Cauley JA, Schwartz AV, Nevitt MC, Resnick HE, Bauer DC, Tylavsky FA, de RN, Harris TB, Newman AB. Nontraumatic fracture risk with diabetes mellitus and impaired fasting glucose in older white and black adults: the health, aging, and body composition study. Arch Intern Med. 2005;165:1612–7. doi: 10.1001/archinte.165.14.1612. [DOI] [PubMed] [Google Scholar]
- 39.Al-Mashat HA, Kandru S, Liu R, Behl Y, Desta T, Graves DT. Diabetes enhances mRNA levels of proapoptotic genes and caspase activity, which contribute to impaired healing. Diabetes. 2006;55:487–95. doi: 10.2337/diabetes.55.02.06.db05-1201. [DOI] [PubMed] [Google Scholar]
- 40.Hofbauer LC, Brueck CC, Singh SK, Dobnig H. Osteoporosis in patients with diabetes mellitus. J Bone Miner Res. 2007;22:1317–28. doi: 10.1359/jbmr.070510. [DOI] [PubMed] [Google Scholar]
- 41.Chang SH, Barbosa-Tessmann I, Chen C, Kilberg MS, Agarwal A. Glucose deprivation induces heme oxygenase-1 gene expression by a pathway independent of the unfolded protein response. J Biol Chem. 2002;277:1933–40. doi: 10.1074/jbc.M108921200. [DOI] [PubMed] [Google Scholar]
- 42.Quan S, Kaminski PM, Yang L, Morita T, Inaba M, Ikehara S, Goodman AI, Wolin MS, Abraham NG. Heme oxygenase-1 prevents superoxide anion-associated endothelial cell sloughing in diabetic rats. Biochem Biophys Res Commun. 2004;315:509–16. doi: 10.1016/j.bbrc.2004.01.086. [DOI] [PubMed] [Google Scholar]
- 43.Chang SH, Garcia J, Melendez JA, Kilberg MS, Agarwal A. Haem oxygenase 1 gene induction by glucose deprivation is mediated by reactive oxygen species via the mitochondrial electron-transport chain. Biochem J. 2003;371:877–85. doi: 10.1042/BJ20021731. [DOI] [PMC free article] [PubMed] [Google Scholar]
- 44.Abraham NG, Kushida T, McClung J, Weiss M, Quan S, Lafaro R, Darzynkiewicz Z, Wolin M. Heme oxygenase-1 attenuates glucose-mediated cell growth arrest and apoptosis in human microvessel endothelial cells. Circ Res. 2003;93:507–14. doi: 10.1161/01.RES.0000091828.36599.34. [DOI] [PubMed] [Google Scholar]
- 45.Turkseven S, Kruger A, Mingone CJ, Kaminski P, Inaba M, Rodella LF, Ikehara S, Wolin MS, Abraham NG. Antioxidant mechanism of heme oxygenase-1 involves an increase in superoxide dismutase and catalase in experimental diabetes. Am J Physiol Heart Circ Physiol. 2005;289:H701–H707. doi: 10.1152/ajpheart.00024.2005. [DOI] [PubMed] [Google Scholar]
- 46.Di Noia MA, Van DS, Palmieri F, Yang LM, Quan S, Goodman AI, Abraham NG. Heme oxygenase-1 enhances renal mitochondrial transport carriers and cytochrome C oxidase activity in experimental diabetes. J Biol Chem. 2006;281:15687–93. doi: 10.1074/jbc.M510595200. [DOI] [PubMed] [Google Scholar]
- 47.Peterson SJ, Kim DH, Li M, Positano V, Vanella L, Rodella LF, Piccolomini F, Puri N, Gastaldelli A, Kusmic C, L'Abbate A, Abraham NG. The L-4F mimetic peptide prevents insulin resistance through increased levels of HO-1, pAMPK, and pAKT in obese mice. J Lipid Res. 2009;50:1293–304. doi: 10.1194/jlr.M800610-JLR200. [DOI] [PMC free article] [PubMed] [Google Scholar]
- 48.Schadinger SE, Bucher NL, Schreiber BM, Farmer SR. PPARgamma2 regulates lipogenesis and lipid accumulation in steatotic hepatocytes. Am J Physiol Endocrinol Metab. 2005;288:E1195–E1205. doi: 10.1152/ajpendo.00513.2004. [DOI] [PubMed] [Google Scholar]
- 49.Liu J, Farmer SR. Regulating the balance between peroxisome proliferator-activated receptor gamma and beta-catenin signaling during adipogenesis. A glycogen synthase kinase 3beta phosphorylation-defective mutant of beta-catenin inhibits expression of a subset of adipogenic genes. J Biol Chem. 2004;279:45020–7. doi: 10.1074/jbc.M407050200. [DOI] [PubMed] [Google Scholar]
- 50.Chertkov JL, Jiang S, Lutton JD, Harrison J, Levere RD, Tiefenthaler M, Abraham NG. The hematopoietic stromal microenvironment promotes retrovirus-mediated gene transfer into hematopoietic stem cells. Stem Cells. 1993;11:218–27. doi: 10.1002/stem.5530110309. [DOI] [PubMed] [Google Scholar]
- 51.Bab I, Gazit D, Chorev M, Muhlrad A, Shteyer A, Greenberg Z, Namdar M, Kahn A. Histone H4-related osteogenic growth peptide (OGP): a novel circulating stimulator of osteoblastic activity. EMBO J. 1992;11:1867–73. doi: 10.1002/j.1460-2075.1992.tb05238.x. [DOI] [PMC free article] [PubMed] [Google Scholar]
- 52.Quan S, Yang L, Abraham NG, Kappas A. Regulation of human heme oxygenase in endothelial cells by using sense and antisense retroviral constructs. Proc Natl Acad Sci U S A. 2001;98:12203–8. doi: 10.1073/pnas.211399398. [DOI] [PMC free article] [PubMed] [Google Scholar]
- 53.Li Volti G, Wang J, Traganos F, Kappas A, Abraham NG. Differential effect of heme oxygenase-1 in endothelial and smooth muscle cell cycle progression. Biochem Biophys Res Commun. 2002;296:1077–82. doi: 10.1016/s0006-291x(02)02054-5. [DOI] [PubMed] [Google Scholar]


