

Abstract
The purpose of this investigation was to replicate the methods of Anderson, Pellowski, and Conture (2005) to determine whether a different sample of preschool children who stutter (CWS) exhibit more dissociations in speech-language abilities than children who do not stutter (CWNS; Study 1) and to examine the relation between dissociations and specific characteristics of stuttering (e.g., most common disfluency type) using a much larger sample size (Study 2). Participants for Study 1 were 40 CWS and 40 CWNS between the ages of 3;0 and 5;11. Participants for Study 2 were the same as for Study 1 plus the 45 CWS and 45 CWNS used by Anderson et al. (2005) for a total of 85 CWS and 85 CWNS. Participants were administered five standardized speech-language (sub)tests and a conversational speech sample was obtained from each participant for the analyses of speech disfluencies/stuttering. Standard scores from the standardized speech-language tests were analyzed using a correlation-based statistical procedure (Bates, Applebaum, Salcedo, Saygin & Pizzamiglio, 2003) to identify possible dissociations among the speech-language measures. Findings from Study 1 supported Anderson et al.’s findings that CWS exhibited significantly more speech-language dissociations than CWNS. Results from Study 2 further revealed that CWS who exhibited dissociations were more likely to exhibit non-stuttered (other) disfluencies as their most common disfluency type. Findings provide further support for the possibility that dissociations among various aspects of the speech-language system may contribute to the difficulties that some children have establishing normally fluent speech.
Keywords: Stuttering, Dissociation, Preschool, Linguistic
1. Introduction
As discussed by Hall, Wagovich, and Bernstein Ratner (2007), numerous researchers have investigated language skills, effects, and disorders in children who stutter (CWS). Results of several of these studies indicate that CWS, when compared to children who do not stutter (CWNS), score lower on various indices of expressive and/or receptive language (e.g., Anderson & Conture, 2000; Bajaj, Hodson & Schommer-Aiken, 2004; Murray & Reed, 1977; Ryan, 1992; Westby, 1974). However, others (e.g., Häge, 2001; Kloth, Kraaimaat, Janssen, & Brutten, 1999; Watkins & Yairi, 1997; Watkins, Yairi, & Ambrose, 1999) have reported “…no evidence of pervasive expressive language difficulty in young children who stutter” (Yairi & Ambrose, 2005, p. 241). Indeed, Reilly et al. (2009) reported that “....communication skills and vocabulary are more highly developed in children who start to stutter by 3 years of age” (p. 275). Clearly, there are many possible sources for these equivocal findings, for example, differences in sample sizes and hence power to reject the null hypothesis, differences in talker group classification criteria, differences in research design (e.g., cross-sectional versus longitudinal designs), etc.
What seems to be the case, however, with at least some of the aforementioned studies, is that they were motivated, in whole or in part, by attempts to discover the language “disorder(s)” that may contribute to childhood stuttering. Although this notion may eventually receive empirical support, it would seem to restrict our perspective regarding the potential relation between language and childhood stuttering. In other words, it seems reasonable to assume that the ability of CWS to accurately, efficiently, and rapidly plan and produce language is normally distributed throughout the population. Some CWS may be more or less proficient than others even though most of these children are within normal limits relative to these skills. From this perspective, it would seem less challenging to reconcile the above equivocation in findings and at the same time consider several interesting empirical observations in this area.
The notion that developmental stuttering may be related to language processing difficulties is further supported by findings of linguistic constraints on instances of stuttering. That is, CWS tend to exhibit more instances of stuttering on: low frequency words (Anderson, 2007; Palen & Peterson, 1982); first three words of an utterance (Howell & Au-Yeung, 1995); function words (Howell, Au-Yeung, & Sackin, 1999); utterance-initial function words in longer, more complex sentences (Richels, Buhr, Conture, & Ntourou, 2009); longer or more syntactically complex utterances (Logan & Conture, 1995; Melnick & Conture, 2000; Yaruss, 1999); and utterances above the child’s Mean Length of Utterance (Zackheim & Conture, 2003). These findings suggest that there is a relationship between some aspect of speech-language production planning and the fluency with which words are produced. Accordingly, the speech and language development of CWS need not be “disordered,” in the clinical sense, but rather it may be that these children are simply less well equipped to handle the various linguistic processes involved with accurate, efficient and rapid conversational speech-language planning and production.
For example, even when both CWS and CWNS exhibit speech-language development within normal limits, CWS exhibit faster speech reaction times when primed with syntactically related sentences compared to CWNS (Anderson & Conture, 2004). This finding suggests that CWS with typical speech language development may be less likely to operate near the “ceiling” of their speech-language abilities, thus more apt to benefit from structural or syntactic priming, which helps to facilitate or “push” the speed of their planning closer to maximum. On the other hand, CWS were found to be significantly slower that CWNS, when semantically primed (Pellowski & Conture, 2005), suggesting that they are less able to make use of external semantic than syntactic cueing or priming. In other words, for at least some CWS, there appears to be some degree of asynchronous or unevenness in the development of the various components (e.g., morpho-syntactic construction, lexical selection, etc.) of speech-language planning and production. However, any such unevenness in abilities/development for CWS need not necessarily manifest itself in the form of a clinically significant speech-language disorder.
Thus, the possibility of an interaction between linguistic processing and instances of stuttering, even for children with no apparent clinically significant speech-language problem, has led some (e.g., Anderson & Conture, 2000) to speculate that there may be asynchrony or mismatches among the linguistic processing systems or abilities of CWS. Specifically, Anderson and Conture reported that the difference between standardized measures of receptive/expressive language and receptive vocabulary was significantly greater for CWS than CWNS, results that lead these authors to conclude that this disparity may contribute to the frequent hesitations, prolongations, or repetitions that characterize the speech-language production of CWS.
In addition to empirically exploring the relation between linguistic processing and stuttering, researchers have also investigated the interaction between semantic and syntactic skills in relation to fluency development in typically developing children (Hall & Burgess, 2000), as well as children with developmental language disorders (Hall, 1996; Hall, Yamashita, & Aram, 1993). For example, in a case study of a normally-fluent child, Hall and Burgess (2000) demonstrated that asynchronous development of semantic and syntactic skills, in conjunction with pragmatic factors, led to a breakdown in fluency. In a subsequent paper, Hall (2004) explained these findings to suggest that a disparity among lexical and syntactic skills may create more of a chance for disruptions in linguistic planning in that construction of the sentence frame may be delayed or retrieval of an incorrect lexical item may occur. Therefore, relative to developmental stuttering, Hall (2004) argued that mismatches among language skills, especially between semantics and syntax, coupled with a predisposition to stuttering, may contribute to the frequent disruptions in fluency experienced by CWS.
The notion that there are subtle differences between the speech-language abilities of CWS and CWNS—even in the presence of normal speech-language abilities and development–has received some degree of empirical support (Anderson & Conture, 2000; Anderson et al., 2005). In particular, Anderson et al. employed a correlation-based statistical procedure developed by Bates, Appelbaum, Salcedo, Saygin, and Pizzamiglio (2003) to assess the probability of dissociations (i.e., the occurrence of at least one standard deviation between two speech-language measures that fall outside of a 95% confidence interval representing the normal population) among behavioral measures of speech and language in 45 CWS and 45 CWNS between the ages of 3;0 and 5;11 (years;months). When used to determine the probability of dissociations, this statistical procedure takes the means and standard deviations of the population into account along with the correlation between the behavioral measures. Children were administered five standardized speech-language (sub)tests to assess their receptive and expressive vocabulary, receptive and expressive language, and speech sound development. The correlation analyses were then conducted to examine relationships between performances on these measures. Results revealed that CWS are over three times more likely than CWNS to exhibit speech-language dissociations, a finding that suggests that group mean differences between CWS and CWNS on (non)standardized measures of speech and language may be less salient than the relative congruence among these various measures of speech and language.
Therefore, the present writers speculate that mismatches in the child’s development of specific speech and language skills and the child’s attempt to reconcile this asynchronous development may be more contributory to disturbances in speech fluency than clinically significant deficits in one or more abilities. This possibility may be especially apparent and/or problematic during the relatively rapid, unpredictable speech-language planning and production associated with conversational discourse. In such situations, speech-language planning and production may be less than efficient when one component of the speech-language system is not congruent with skills in another speech language component. Or, as Anderson et al. (2005) speculated, dissociations among speech-language processes may bring about a disruption in speech fluency as more resources are devoted to resolving or reconciling unevenly developed linguistic formulation processes.
Based upon the preceding discussion, it would appear that further study of the presence and nature of linguistic dissociations in CWS is warranted. However, prior to further theorizing and/or empirically exploring specific dissociations of CWS (e.g., between speech sound articulation and expressive vocabulary), it seems reasonable to further empirically examine the presence of all such speech-language dissociations in another sample of CWS and CWNS. If the findings of Anderson et al. (2005) are consistent with those based on another, different sample of participants, it would provide further support for the notion that speech-language dissociations are one possible contributor to the difficulties some children have establishing normally fluent speech. Furthermore, it would be interesting to further assess, using a much larger sample size, whether the frequency of speech-language dissociations are related to various characteristics of CWS’s stuttering, for example, frequency of stuttering-like disfluencies, a relation that Anderson et al. found to be nonsignificant.
The finite, non-random distribution of the most common disfluency types of CWS (Pellowski & Conture, 2002; Yaruss, LaSalle, & Conture, 1998) suggests that different types of speech disfluency may relate to different linguistic processes (Anderson, 2007; Anderson & Byrd, 2008). Perhaps the relation between degree of dissociation among linguistic components and specific stuttering characteristics (e.g., frequency of stuttering-like disfluencies), a relation that Anderson et al. (2005) did not explore, may be more salient to stuttering than the mere number or frequency of dissociations. In other words, the greater the degree of dissociation–among linguistic components that are typically fairly congruent–renders the child more susceptible to break-downs in speech fluency, breakdowns that exhibit particular signatures. For example, perhaps a child with a minimal but statistically significant dissociation will be more apt to produce less stuttering-like disfluencies than a child with a greater degree of dissociation. These are, of course, empirical issues, issues that heretofore have not been addressed.
Therefore, the purpose of this study was two-fold: to replicate the methods of Anderson et al. using a different sample of children (Study 1) and extend the findings of Anderson et al. using a much larger sample of children (Study 2). It was hypothesized that CWS would exhibit more linguistic dissociations than CWNS in both Studies 1 and 2. For Study 2, however, it was further hypothesized, among other things, that certain characteristics of stuttering observed in CWS, such as most common disfluency type (e.g., stuttering-like disfluencies), would be related to the presence or magnitude of dissociations. Generally, it is believed that findings from this study may provide additional insights into how a possible unevenness or imbalance in the development of various components of speech-language planning and production may contribute to the difficulties that some children have in establishing normally fluent speech.
2. Study 1: Replication of Anderson et al. (2005)
2.1. Method
2.1.1. Participants
Participants included two groups of preschool-age children, with one group (n = 40) consisting of children who do (M = 47.6 months, SD = 9.7, Range = 36–67) and another (n = 40) who do not stutter (M = 48.1 months, SD = 9.4, Range = 36–68). None of these participants had participated in the Anderson et al (2005) study and all were native speakers of Standard American English with no hearing, neurological, speech-language (other than stuttering), developmental, intellectual or emotional problems based on parental report and examiner observation. Participants in both groups were matched by age (± 4 months), gender (25 males, 15 females in each group), and race (2 black or African American, 1 Hispanic, and 37 white in each group).
The Hollingshead Two-Factor Index of Social Position (Myers & Bean, 1968) was used to classify social-economic status (SES) based on parental report of the “head of household’s” occupation and education level (the child’s father in dual parent households, 97.5% of the sample, and the child’s mother in single parent households, 2.5% of the sample). Although participants were not matched by SES, no significant difference in SES, t(78) = 0.08, p = .94, was found between the CWS (M = 53.6, SD = 9.5) and CWNS (M = 53.4, SD = 7.8) groups. There was also no significant difference between the two groups of children in age, t(78) = −0.23, p = .82.
All participants were part of an ongoing series of empirical studies (e.g., Arnold, Conture & Ohde, 2005; Arnold, Conture, Key, & Walden, 2009; Pellowski & Conture, 2005; Karrass et al., 2006; Richels et al., 2009) examining the relationship between speech-language processes, emotional variables, and developmental stuttering in preschool-age children. Children for the present study were identified for participation by their parents who were informed about the aforementioned studies through an advertisement in a monthly Middle Tennessee parent-oriented magazine (i.e., the “Nashville Parent”; estimated monthly readership of 230,000), by referral from professionals in the Middle Tennessee community (e.g., speech-language pathologists, health care providers, etc.) or by referral from speech-language pathologists at the Vanderbilt Bill Wilkerson Hearing and Speech Center. The study protocol was approved by the Institutional Review Board at Vanderbilt University, Nashville, Tennessee. Informed consent was obtained from each of the parents and assent from the children for all 80 participants.
Measures of speech disfluency were based on the children’s conversational speech during an adult-child interaction (to be described below). A child was classified as a CWS if he/she (a) exhibited three or more stuttering-like disfluencies (part-word repetitions, single-syllable word repetitions, sound prolongation, blocks, and tense pauses) per 100 words of conversational speech (Pellowski & Conture, 2002), (b) received a total overall score of 11 or above (at least “mild” in severity) on the Stuttering Severity Instrument-3 (SSI-3; Riley, 1994), and (c) had parents who expressed concern about his/her speech fluency and believed that he/she stuttered. CWS had an average parent-reported time since stuttering onset (TSO), which was calculated using the “bracketing” procedure of Yairi and Ambrose (1992), of 14.03 months (SD = 10.35). None of the CWS had received treatment for their stuttering at the time of participation in the study.
A child was classified as CWNS if he/she (a) exhibited two or fewer stuttering-like disfluencies per 100 words of conversational speech (Pellowski & Conture, 2002), (b) received a total score of 10 or below (severity rating of less than “mild”) on the SSI-3, and (c) had no parents who expressed concern about his/her speech fluency and believed that he/she stuttered.
To be included in the present study, all participants were required to pass a bilateral pure tone hearing and tympanometric screening (ASHA, 1990). Children classified as CWNS were also required to receive a standard score of 85 or higher (not less than approximately 1 SD below the mean) for their age group on each of the five standardized speech-language (sub)tests (to be described below) to ensure that children with clinically significant speech and/or language delays were not included in the study. However, CWS were allowed to freely vary in their scores on the speech-language measures (only 12 [6%] of the 200 total test scores [40 CWS × 5 tests = 200] were below a standard score of 85). This participant exclusionary criterion was adopted, in part, because this was the approach used by the authors of the Anderson et al. (2005) study whose methods the present authors were attempting to replicate.
As noted by Anderson and her colleagues (2005), allowing CWS to freely vary in their scores on the speech-language measures has the advantage of making the findings generalizable to the entire population of CWS. However, the disadvantage of this approach is that it may increase the probability of finding dissociations in the CWS group and decrease the extent of dissociations in the CWNS group. Thus, to address this possibility, Anderson et al. performed a quantitative assessment of dissociations with CWS who scored below the 20th percentile (i.e., a standard score of approximately 85 or lower) and their matched controls removed from the sample. They found that allowing CWS to freely vary on the speech-language measures had a negligible effect on the results; CWS were still over 2.5 times more likely than CWNS to exhibit dissociations across speech and language measures.
2.1.3. Procedure
Five standardized speech-language (sub)tests were administered, in accordance with the procedures of Anderson et al. (2005), to assess participants’ receptive-expressive language, receptive-expressive vocabulary, and speech sound articulation abilities: (a) the Peabody Picture Vocabulary Test-III (PPVT-III; Dunn & Dunn, 1997), (b) the Expressive Vocabulary Test (EVT; Williams, 1997), (c) the “Expressive” and “Receptive” subtests of the Test of Early Language Development-3 (TELD-3; Hresko, Reid, & Hamill, 1999), and (d) the “Sounds in Words” subtest of the Goldman-Fristoe Test of Articulation-2 (GFTA-2; Goldman & Fristoe, 2000). All of these speech-language measures have good to excellent published split-half and test-retest reliabilities, ranging from .84 to .98. The age-based standard scores obtained from these measures served as the main dependent variables in the analyses of the present study.
Stuttering and speech disfluencies were analyzed using an informal conversational interaction between the child and an adult (i.e., child’s parent or a clinician). From this interaction, a 300-word speech sample (lasting approximately 15–30 minutes) was obtained while the child and adult informally played with and talked about several toys. Speech samples obtained for each participant were analyzed for mean frequency of stuttering-like disfluencies (i.e., part-word repetitions, single-syllable word repetitions, sound prolongations, blocks, and tense pauses), other disfluencies (i.e., polysyllabic word repetitions, interjections, phrase repetitions, and revisions), total disfluencies (stuttering-like plus other disfluencies) per 100 words, and stuttering severity based on the SSI-3.
2.1.4. Data Analysis
The Mann-Whitney U test was used to assess between-group differences in speech disfluency measures (i.e., stuttering-like disfluencies and total disfluencies). This nonparametric test was used for the statistical analysis of these measures because the data were not normally distributed. Multivariate and univariate analyses of variance (MANOVA and ANOVA, respectively) were used to compare performance on the five standardized speech-language measures (TELD-3 Receptive and Expressive, PPVT-III, EVT, and GFTA-2) between groups. Bonferroni corrections were applied (based on an alpha level of .05), as needed, in determining statistical significance.
A correlation-based analysis of the main dependent variables (GFTA-2, PPVT-III, EVT, TELD-3 Expressive and Receptive) was conducted to examine relationships in performance across the five speech-language measures. Standard scores on these measures were converted to z-scores. Therefore, the individual scores represented the number of standard deviations from the mean, with each variable having a mean score of zero.
Density ellipses (e.g., Figure 1) with a confidence interval of 95% (after Bates et al., 2003) were used to identify any potential dissociations among the various standardized speech-language measures (see Anderson et al., 2005, for more information). These density ellipses represented the extent of the data, the center of mass, the linear fit, and the correlation between two variables (Sall, Creighton, & Lehman, 2004). Those cases that fell within the density ellipse represent 95% of the normal population, while the 5% that fell outside of this density ellipse represent the outliers.
Figure 1.
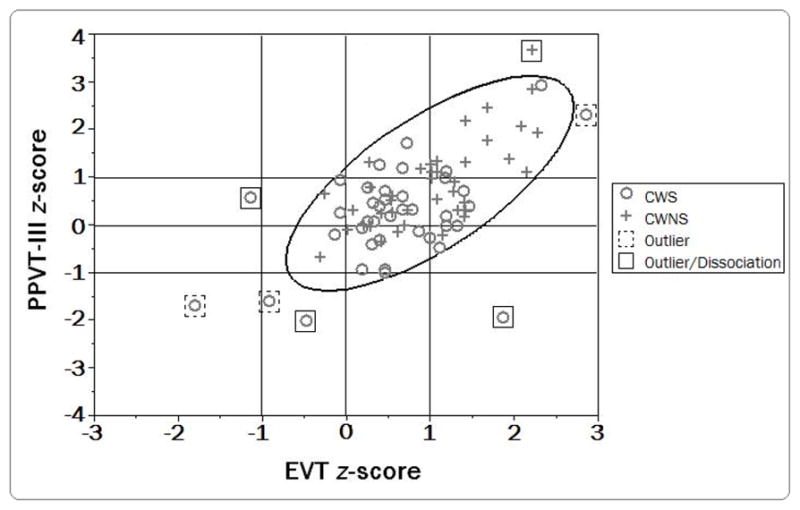
Study 1. Example of a correlation between receptive (PPVT-III) and expressive (EVT) vocabulary for children between the ages of 3;0 and 5;11 (years; months) who do (CWS; N = 40) and do not stutter (CWNS; N = 40) with density ellipse (CI=95%) shown.
It is important to note, as Anderson et al. (2005) suggested, that not all of these outliers should be characterized as exhibiting a dissociation in the true sense of the word. For example, a child who scores two standard deviations below the mean on both of two different speech-language measures would clearly fall outside the density ellipse. However, this pattern of low performance does not represent a true dissociation in that the two measures are not dissociated in any meaningful way (although it may still indicate a clinically significant concern for both such speech-language abilities).
Therefore, for the purposes of the present study, to be classified as a true dissociation, children’s scores that fell outside the density ellipse in the space occupied by 5% of the population were required to also exhibit a one standard deviation difference between the two measures. Density ellipses were initially created for the group of CWNS and served as the basis for evaluating the probability of dissociations in CWS. These ellipses were then applied to the data for both groups of children. All analyses were performed using JMP (Sall et al., 2004) and SPSS version 12.0 (SPSS, 2003) statistical programs.
2.2. Results
2.2.1. Between-Group Analyses of Speech Disfluency and Speech-Language Measures
Not surprisingly, given this study’s participant classification criteria, the Bonferroni corrected Mann-Whitney test (the new alpha level needed for significance was 0.025) revealed that CWS (n = 40), when compared to CWNS (n = 40), exhibited significantly more stuttering-like disfluencies (z = −7.71, p < 0.01) and total disfluencies (z = −7.57, p < 0.01).
Using Pillai’s trace, the omnibus MANOVA test revealed a significant multivariate main effect of group on standardized speech-language measures, V = .15, F (5, 74) = 2.51, p = .04 (Figure 2). Separate univariate ANOVAs, with Bonferroni correction (alpha level = .01), further revealed that CWS scored significantly lower than CWNS on the PPVT-III, F(1,78) = 11.23, p = .001. CWS also scored lower than CWNS on the EVT, but after Bonferroni correction, this difference was no longer statistically significant, F(1,78) = 5.38, p = .02. Although CWS scored lower than CWNS on all other speech-language measures, these differences failed to achieve statistical significance (TELD-3 Receptive, F[1,78] = 3.37, p = .07, TELD-3 Expressive, F[1,78] = 0.82, p = .39, and GFTA-2, F[1,78] = 3.59, p = .06). Mean standard scores on the speech-language measures ranged from 102.1 to 109.4 (SD = 9.7 to 16.6) for CWS and 106.3 to 115.5 (SD = 9.4 to 13.8) for CWNS.
Figure 2.

Study 1. Mean (standard error of the mean) standard scores on standardized speech-language measures (TELD-3 Expressive and Receptive subtests, PPVT-III, EVT, and GFTA-2) for children who do (CWS; n = 40) and do not (CWNS; n = 40) stutter.
In essence, even though both CWS and CWNS performed, on average, within normal limits on the standardized speech and language (sub)tests, the receptive vocabulary skills of CWS were significantly lower than that of CWNS. Furthermore, CWS scored consistently lower than CWNS on a measure of expressive vocabulary, as well as overall language and speech sound development, although these differences did not reach statistical significance.
2.2.2. Dissociations in Performance Across Speech-Language Measures
Correlation-based analyses (Bates et al., 2003) were employed to examine relationships across speech-language measures in the domains of vocabulary, language (oral communication and comprehension), and speech sound development. Furthermore, ancillary analyses, assessing performance across domains (language and vocabulary) and modalities (expressive versus receptive), were performed in order to ensure identification of all possible dissociations. Detailed results of these analyses are depicted in Table 1.
Table 1.
Study 1. Associations/Dissociations in Performance Across Speech-Language Domains for 40 Children Who Stutter (CWS) and 40 Children Who Do Not Stutter (CWNS)
| Associations |
Number of Outliers |
Number of Dissociations |
Dissociation Pattern |
|||||
|---|---|---|---|---|---|---|---|---|
| Speech-Language Domains | CWS | CWNS | CWS | CWNS | CWS | CWNS | CWS | CWNS |
| Vocabulary | ||||||||
| PPVT-III vs. EVT | .57* | .71* | 6 | 1 | 3 | 1 | PPVT-III < EVT | PPVT-III > EVT |
| Language | ||||||||
| TELD-3 Receptive vs. Expressive | .47* | .47* | 6 | 1 | 4 | 0 | TELD-3 R < TELD-3 E | n/a |
| Oral Communication | ||||||||
| TELD-3 Expressive vs. EVT | .68* | .41* | 5 | 1 | 1 | 0 | TELD-3 E < EVT | n/a |
| Comprehension | ||||||||
| TELD-3 Receptive vs. PPVT-III | .65* | .36* | 6 | 1 | 2 | 1 | TELD-3 R > PPVT-III | TELD-3 R < PPVT-III |
| Articulation & Vocabulary | ||||||||
| GFTA-2 vs. PPVT-III | .19 | .40* | 5 | 1 | 3 | 1 | GFTA-2 > PPVT-III | GFTA-2 < PPVT-III |
| GFTA-2 vs. EVT | .29 | .40* | 4 | 1 | 3 | 1 | GFTA-2 < EVT | GFTA-2 < EVT |
| Articulation & Language | ||||||||
| GFTA-2 vs. TELD-3 Receptive | .23 | .05 | 4 | 0 | 2 | 0 | GFTA-2 > TELD-3 R | n/a |
| GFTA-2 vs. TELD-3 Expressive | .32* | .10 | 3 | 1 | 2 | 1 | GFTA-2 </> TELD-3 E | GFTA-2 < TELD-3 E |
| Language & Vocabulary | ||||||||
| TELD-3 Receptive vs. EVT | .68* | .46* | 5 | 1 | 2 | 1 | TELD-3 R</> EVT | TELD-3 R < EVT |
| TELD-3 Expressive vs. PPVT-III | .62* | .25 | 8 | 3 | 3 | 2 | TELD-3 E > PPVT-III | TELD-3 E < PPVT-III |
| Sum | 52 | 11 | 25 | 8 | ||||
Note. Associations = Pearson Product-Moment Correlation Coefficients; PPVT-III = Peabody Picture Vocabulary Test-III; EVT = Expressive Vocabulary Test; TELD-3 = Test of Early Language Development-3 (Receptive [R] and Expressive [E]); GFTA-2 = Goldman-Fristoe Test of Articulation-2;
p ≤ .05.
In general, results revealed that of the 52 cases that fell outside the density ellipse for CWS, 25 (48.1%) met the criteria for dissociation, while 8 (72.7%) of the 11 cases of outliers for CWNS met the criteria for dissociation. Of the 25 cases of dissociation identified among 10 different CWS, 8 (32%) were below the mean on both measures, 13 (52%) were below the mean on one measure, and 4 (16%) were at or above the mean on both measures. On the other hand, among the 8 cases of dissociation among 5 different CWNS, none were below the mean on both measures, while 3 (37.5 %) cases were below the mean on one measure and 5 (62.5%) were above the mean on both measures.
2.2.3. Dissociations in Performance in Vocabulary-Matched Children
To determine whether the significant between-group differences in vocabulary measures (i.e., PPVT-III and possibly the EVT) could have influenced the aforementioned findings, correlation-based analyses were again conducted using a subset of children matched by vocabulary abilities, age (± 4 months), gender (6 females, 17 males per group), and race (1 black or African American, 22 white per group). Children in each group were matched by their mean standard scores on the PPVT-III and EVT (± 10 points), reducing the sample size to 23 in each group (N = 46). The group of CWS included two children who had exhibited dissociations from the non-vocabulary-matched analyses, while the group of CWNS included one child who had previously been identified as exhibiting dissociations. An independent-samples t-test revealed no significant difference between the two vocabulary-matched groups of children in age, t(44) = −0.35, p = .73.
The omnibus MANOVA test, using Pillai’s trace, revealed no significant difference between vocabulary-matched CWS and CWNS in their performance on the five standardized speech-language measures, V = .06, F (5, 40) = 0.54, p = .75. Mean standard scores on these measures ranged from 105.5 to 111.6 (SD = 6.1 to 13.0) for CWS and 105.6 to 114.5 (SD = 7.7 to 10.8) for CWNS (univariate ANOVA p-values ranged from .28 to .95).
Most importantly, the correlation-based analyses revealed that the vocabulary-matched group of CWS exhibited 15 cases that fell outside the density ellipse, with 13 (86.7%) of these cases meeting the criteria for dissociation. In contrast, the vocabulary-matched group of CWNS exhibited 7 outliers, 3 (42.9%) of which qualified as dissociations. Thus, whether vocabulary-matched or not, CWS exhibit appreciably more dissociations that meet this study’s operational definition of dissociation.
2.3. Discussion
The main goal of Study 1 was to replicate the methods of Anderson et al. (2005) by examining the possible presence of dissociations in the speech and language skills of a different sample of preschool-aged CWS and CWNS, a goal that was seemingly met. That is, based on the correlation-based statistical analyses of Bates et al. (2003), results of Study 1 indicated that CWS were over four times more likely than CWNS to fall outside the density ellipse (CWS = 52 cases; CWNS = 11 cases) and three times more likely than CWNS to exhibit dissociations across speech-language domains (CWS = 25 cases; CWNS = 8 cases), findings consistent with those of Anderson et al. Furthermore, analyses of the vocabulary-matched children indicated that the preceding results did not result from the lower performance of CWS, compared to CWNS, on receptive and expressive vocabulary measures. Consistent with the initial findings, based on non-vocabulary-matched samples of CWS and CWNS, the vocabulary-matched CWS were over two times more likely than their vocabulary-matched CWNS peers to fall outside the density ellipse (CWS = 15 cases; CWNS = 7 cases) and over four times more likely than CWNS to exhibit dissociations across speech-language domains (CWS = 13 cases; CWNS = 3 cases).
2.3.1. Speech-Language Abilities of CWS vs. CWNS
As a group, CWS scored lower than CWNS on all measures of speech and language, a finding consistent with Anderson et al. (2005). However, unlike Anderson et al., statistical significance was achieved only for receptive vocabulary in the present sample of children. Both Anderson et al and Study 1 reported that CWS consistently scored lower than CWNS on speech and language measures; however, both studies reported that CWS and CWNS exhibited standard scores within the average to slightly above average range relative to normative data, with means ranging from 102 to 115. Therefore, as Anderson et al. suggested, the congruence among speech and language skills may be more important that merely assessing mean differences between CWS and CWNS on measures of speech and language.
2.3.2. CWS are More Likely to Exhibit Dissociations than CWNS
Anderson et al.’s (2005) finding that CWS are just over three times more likely to exhibit dissociations across speech-language domains was replicated in the present investigation. However, although Anderson et al. reported that CWS exhibited the greatest number of dissociations in speech sound development and overall language (receptive and expressive), Study 1 found that the greatest number of dissociations were in the domain of receptive and expressive language (i.e., receptive language < expressive language; see row labeled “TELD-3 Receptive vs. Expressive” in Table 1). Furthermore, not all CWS exhibited dissociations among their speech and language abilities. Only 10 (25%) of this study’s 40 CWS and only 16 (36%) of Anderson et al’s 45 CWS actually exhibited dissociations. Therefore, there may only be a portion of CWS who possess a greater susceptibility to exhibit these linguistic dissociations, a finding consistent with the notion that subtypes exist among children who stutter (e.g., Schwartz & Conture, 1988; Yairi, 1997, 2007).
In the meantime, as Anderson et al. (2005) suggested, perhaps the nature of the dissociation is not as important as the mere presence of a dissociation across domains. It may be the child’s attempt to reconcile these asynchronies or this incongruence among speech-language systems that contribute to disruptions in the forward flow of speech and thus, the development of stuttering (Hall, 2004). Anderson et al. proposed that within-group variability among CWS in terms of the presence of dissociations as well as the type, direction, and degree of dissociation suggests that dissociation is not necessary for the development of stuttering, but rather a sufficient aspect for it to emerge for at least some CWS.
2.3.3. Dissociations Result from Lack of “Goodness of Fit”
Findings from the current study as well as those of Anderson et al. (2005) lend support for a “goodness-of-fit” model which suggests that when a child’s skills in one component of the speech-language system is not congruent with his/her skills in another component of this system, a strain may be placed on the speech-language planning and production system. In turn, less fluent speech comes about as more resources are devoted to “rectifying” or “reconciling” various subcomponents of linguistic formulation processes.
One theory similar to this notion of “goodness-of-fit” involves Just and Carpenter’s (1992) capacity theory of comprehension, a theory that explores the way in which working memory capacity constrains comprehension. According to this theory, individual differences in working memory capacity and processing efficiency for language may account for differences in language comprehension. Anderson et al. (2005) suggested that some CWS may possess more limited resources for linguistic functions when compared to CWNS and speculates that in the presence of a dissociation, some aspect of their conversational output, possibly speech fluency, may become less consistent.
3. Study 2: Extension of Anderson et al. (2005)
3.1. Method
3.1.1. Participants
The purpose of Study 2 was to extend the findings of Anderson et al. (2005) by further examining the nature of specific dissociations in a much larger sample of children, as well as possible relations between these dissociations and measures of speech disfluency. Participants included in Study 2 were those individuals used in the aforementioned analyses (N = 80) for Study 1 plus those employed by Anderson et al. (N = 90) for a total of 170 participants. One obvious advantage of combining the two data sets into one large sample is that it increases statistical power. To illustrate, a two-sample t-test power analysis (Hintze, 2005) was conducted for Study 1 and 2. In essence, when each group had 40 participants (Study 1) the statistical power was 60%, but when each group had 85 participants (Study 2) the power was 90%. This reflects the well-known result that power improves as sample size increases (Cohen, 1992). A power of 60%, which is below the conventional standard of 80% minimum power, means that if there are any real differences, we are only 60% sure of detecting it. Thus, with the sample size of 40 participants per group in Study 1, it is quite possible that real difference(s) may have gone undetected. With the increase in sample size in Study 2, however, smaller effects can be detected with 90% power, making it less likely that real differences, if present, will be missed.
The 170 children who participated in Study 2 were between the ages of 3;0 and 5;11 (years;months), with one group of children who do (n = 85; M = 48.4 months, SD = 9.6 ) and another who do not stutter (n = 85; M = 48.6 months, SD = 9.1). The CWNS who participated in Study 2 were again required to receive a standard score of 85 or higher (not less than approximately 1 SD below the mean) on each of the five standardized speech-language (sub)tests, whereas CWS were allowed to freely vary in their scores (only 22 [5%] of the 425 total test scores [85 CWS × 5 tests = 425] were below a standard score of 85). Children in both groups were matched by age (± 4 months), gender (54 males, 31 females in each group), and race (1 Asian, 6 Black or African American, 1 Hispanic, and 77 White in each group). There were no significant differences between the two groups of children in age, t(168) = −0.18, p = .86, or SES, t(168) = 0.17, p = .87, as measured using Hollingshead’s Two-Factor Index of Social Position (Myers & Bean, 1968). Children in the CWS group had an average parent-reported TSO of 13.38 months (SD = 9.17).
3.1.2. Procedures
The procedures used for the standardized speech-language testing and the collection/analysis of the speech disfluency data (i.e., total and stuttering-like disfluencies, SSI-3, and TSO) were, for the most part, identical to those used in Study 1 (see Section 2.1.3).
However, unlike Study 1, children’s speech samples were also analyzed for most common disfluency type and the frequency of disfluency clusters. Children’s most common disfluency types were classified into two main categories: stuttering-like and other disfluencies. Disfluency clusters were defined as two or more consecutive disfluencies that occur within the same word, on adjacent words, or on a word and an adjacent point between words (Hubbard & Yairi, 1988; LaSalle & Conture, 1995; Yairi & Ambrose, 2005).
3.1.3. Data Analysis
Between-group differences in speech disfluency measures and disfluency cluster data were analyzed using Mann-Whitney U tests, whereas differences in most common disfluency types were analyzed using a 2 × 2 Fisher’s exact test (two-tailed). Multivariate and univariate analyses of variance (MANOVA and ANOVA, respectively) were used to compare performance between groups on the five standardized speech-language measures (TELD-3 Receptive and Expressive, PPVT-III, EVT, and GFTA-2). Bonferroni corrections were again used, as needed, in determining significance.
As with Study 1, correlation-based analyses of the main dependent variables (TELD-3 Expressive and Receptive, PPVT-III, EVT, and GFTA-2) were conducted to examine relationships across performance on the five speech-language measures (see section 2.1.4 for further details pertaining to this analysis). Density ellipses (e.g., Figure 1) with a confidence interval of 95% (after Bates et al., 2003) were used to identify potential dissociations among the various standardized speech-language scores.
In addition to the analyses employed to assess the presence and characteristics of dissociations in CWS and CWNS, Spearman’s correlation coefficients were used to analyze the relationship between the degree of dissociation among speech-language abilities and the speech disfluency measures for CWS. In other words, we wanted to know the extent to which the degree of dissociation, not merely its presence, correlates with the degree or frequency of total as well as stuttered disfluencies for CWS who exhibit dissociations.
3.2. Results
3.2.1. Between-Group Analyses of Speech Disfluency and Speech-Language Measures
Again, as would be expected based on participant classification criteria, the Bonferroni corrected Mann-Whitney test (alpha level = .025) indicated that CWS (n = 85) exhibited significantly more stuttering-like disfluencies (z = 11.12, p < .001; M = 7.94, SD = 4.77) and total disfluencies (z = 10.47, p < .001; M = 11.00, SD = 5.23) than CWNS (n = 85; M = .94 and 3.21, SD = .73 and 1.80, respectively). Using Pillai’s trace, the omnibus MANOVA test revealed a significant multivariate main effect of group on the standardized speech-language tests, V = .13, F (5,164) = 5.02, p < .001 (Figure 3). Employing this considerably larger participant sample (N = 170) than Study 1, as well as Anderson et al. (2005), and even with Bonferroni correction (alpha level = .01), subsequent ANOVA tests indicated that CWS scored significantly lower than CWNS on the TELD-3 Receptive, F(1,168) = 17.9, p < .001, TELD-3 Expressive, F(1,168) = 8.1, p = .005, PPVT-III, F(1,168) = 16.3, p < .001, EVT, F(1,168) = 6.7, p = .01, and the GFTA-2, F(1,168) = 6.7, p = .01. Standard scores on these measures ranged from 104.3 to 110.3 (SD = 11.5 to 16.4) for CWS and 111.5 to 117.0 (SD = 10.4 to 13.4) for CWNS, average to above average scores that fall within normal limits. Additional analyses revealed no significant omnibus multivariate main effect of sample group (i.e., Study 1 vs. Anderson et al., 2005) on the standardized speech-language tests for CWS, V = .99, F (5,79) = 5.02, p = .17, or CWNS, V = .06, F (5,79) = 1.04, p = .39.
Figure 3.

Study 2. Mean (standard error of the mean) standard scores on standardized speech-language measures (TELD-3 Expressive and Receptive subtests, PPVT-III, EVT, and GFTA-2) for children who do (CWS; n = 85) and do not (CWNS; n = 85) stutter.
3.2.2. Dissociations in Performance Across Speech-Language Measures
Once again, when data from the present investigation and that of Anderson et al. (2005) were combined, results of the correlation-based statistical analyses indicated that CWS were more likely than CWNS to exhibit statistically significant dissociations across speech-language domains. Detailed results of these analyses are depicted in Table 2.
Table 2.
Study 2. Associations/Dissociations in Performance Across Speech-Language Domains for 85 Children Who Stutter (CWS) and 85 Children Who Do Not Stutter (CWNS)
| Associations |
Number of Outliers |
Number of Dissociations |
Dissociation Pattern |
|||||
|---|---|---|---|---|---|---|---|---|
| Speech-Language Domains | CWS | CWNS | CWS | CWNS | CWS | CWNS | CWS | CWNS |
| Vocabulary | ||||||||
| PPVT-III vs. EVT | .59* | .65* | 10 | 2 | 6 | 2 | PPVT-III < EVT | PPVT-III > EVT |
| Language | ||||||||
| TELD-3 Receptive vs. Expressive | .52* | .50* | 13 | 2 | 7 | 1 | TELD-3 R < TELD-3 E | TELD-3 R < TELD-3 E |
| Oral Communication | ||||||||
| TELD-3 Expressive vs. EVT | .61* | .39* | 10 | 4 | 4 | 3 | TELD-3 E</> EVT | TELD-3 E > EVT |
| Comprehension | ||||||||
| TELD-3 Receptive vs. PPVT-III | .59* | .39* | 17 | 4 | 7 | 3 | TELD-3 R < PPVT-III | TELD-3 R < PPVT-III |
| Articulation & Vocabulary | ||||||||
| GFTA-2 vs. PPVT-III | .30* | .23* | 10 | 4 | 5 | 4 | GFTA-2 > PPVT-III | GFTA-2 < PPVT-III |
| GFTA-2 vs. EVT | .31* | .31* | 9 | 2 | 8 | 2 | GFTA-2 < EVT | GFTA-2 </> EVT |
| Articulation & Language | ||||||||
| GFTA-2 vs. TELD-3 Receptive | .26* | .17 | 15 | 5 | 10 | 4 | GFTA-2 > TELD-3 R | GFTA-2 > TELD-3 R |
| GFTA-2 vs. TELD-3 Expressive | .37* | .19 | 7 | 2 | 4 | 1 | GFTA-2 < TELD-3 E | GFTA-2 < TELD-3 E |
| Language & Vocabulary | ||||||||
| TELD-3 Receptive vs. EVT | .57* | .51* | 15 | 5 | 7 | 3 | TELD-3 R < EVT | TELD-3 R < EVT |
| TELD-3 Expressive vs. PPVT-III | .56* | .26* | 10 | 5 | 2 | 5 | TELD-3 E > PPVT-III | TELD-3 E < PPVT-III |
| Sum | 116 | 35 | 60 | 28 | ||||
Note. Pearson Product-Moment Correlation Coefficients; PPVT-III = Peabody Picture Vocabulary Test-III; EVT = Expressive Vocabulary Test; TELD-3 = Test of Early Language Development-3 (Receptive [R] and Expressive [E]); GFTA-2 = Goldman-Fristoe Test of Articulation-2;
p ≤ .05.
Of the 116 outliers identified among CWS, 60 (51.7%) met the criteria for dissociation, while 28 (80%) of the 35 outliers for CWNS were considered dissociations. Thus, CWS were just over 3 times more likely than CWNS to fall outside the density ellipse (CWS = 116 cases; CWNS = 35 cases) and just over 2 times more likely than CWNS to exhibit dissociations across speech-language domains (CWS = 60 cases; CWNS = 28 cases). Results of the following analyses were performed and reported to insure that the sample upon with Study 2 is based is similar to that reported in Study 1, as well as Anderson et al (2005).
Of the 60 cases of dissociation identified among 24 different CWS, 12 (20.0%) instances were below the mean on both measures, 41 (68.3%) were below the mean on at least one measure, and 7 (11.7%) were at or above the mean on both measures. On the other hand, of the 28 cases of dissociation among 13 different CWNS, none (0%) were below the mean on both measures, 10 (35.7%) instances below the mean on at least one measure, and 18 (64.3%) instances above the mean on both measures. A Pearson’s chi-square analysis, whose findings were consistent with those of Anderson et al. (2005), revealed a significant association between group (CWS with dissociations [CWS-D] versus CWNS with dissociations [CWNS-D]) and performance distribution, χ2(2, N = 88) = 27.7, p < .001. In essence, CWS-D were significantly more likely to perform below the mean on one or more of the dissociated measures, while CWNS-D were significantly more likely to perform above the mean on both dissociated measures.
Also consistent with Anderson et al. (2005) is the finding that CWS-D tended to have the greatest number of dissociations in the domain of speech sound development and receptive language (10/60 = 16.7%), with most of these children (8/10 = 80%) demonstrating patterns of greater speech sound development than receptive language. CWS-D also had a considerable number of dissociations in the domains of expressive and receptive language (7/60 = 11.7%), speech sound development and expressive vocabulary (8/60 = 13.3%), receptive language and receptive vocabulary (7/60 = 11.7%), and receptive language and expressive vocabulary (7/60 = 11.7%).
Unlike CWS-D, however, CWNS-D tended to have the greatest number of dissociation in the domain of expressive language and receptive vocabulary (5/28 = 17.9%), with most of these children (3/5 = 60%) exhibiting patterns of expressive language lower than receptive vocabulary. CWNS-D also exhibited more dissociations in the domains of receptive vocabulary and speech sound development (4/28 = 14%), and speech sound development and receptive language (4/28 = 14%). With respect to the latter, like CWS-D, CWNS-D were most apt (3/4 = 75%) to exhibit profiles of greater speech sound development than receptive language.
3.2.3. Dissociations in Performance in Language-Matched Children
Between-group analyses revealed that CWS performed significantly lower than CWNS on all five standardized speech-language measures (see above). To determine whether these differences between CWS and CWNS in speech and language abilities could have contributed to the aforementioned findings, correlation-based analyses were again conducted using a subset of children matched by their TELD-3 Spoken Language quotients (± 7 points), a composite of the Expressive and Receptive subtests, as well as age (± 4 months), gender (8 females, 18 males per group), and race (26 white per group). An independent-samples t-test revealed no significant difference between these two language-matched groups of children in age, t(50) = −0.28, p = .78.
The matching procedure reduced the sample size to 26 children in each group (N = 52), with CWS having a mean TELD-3 Spoken Language quotient of 112.3 (SD = 12.1) and CWNS a mean of 112.7 (SD = 11.5). The mean standard score difference between these two groups of children on the TELD-3 Spoken Language subtest was 3.15 (SD = 2.07), with 15 of the 26 (58%) CWS scoring higher than their language-matched peers (M difference = 2.40, SD = 1.55) and 11 (42%) CWS scoring lower (M difference = 4.18, SD = 2.32). There were 5 participants in the subset of CWS and 3 participants in the subset of CWNS who had dissociations from the initial, non-language-matched analyses (N = 170). Following the matching procedure, an omnibus MANOVA, using Pillai’s trace, revealed no significant differences between the two language-matched groups of children in performance on the five standardized speech-language measures, V = .10, F(5,46) = 1.07, p = .39. Standard scores on the speech-language measures ranged from 106.4 to 112.3 (SD = 9.8 to 13.2) for CWS and 106.3 to 114.3 (SD = 9.6 to 13.1) for CWNS (univariate ANOVA p-values ranged from .22 to .79).
Comparison of the two language-matched talker groups indicated that of the 38 cases that fell outside the density ellipse for CWS, 27 (71.1%) met the criteria for dissociation. On the other hand, of the 11 outliers identified among CWNS, only 5 (45.5%) were considered dissociations. Thus, for Study 2, the language-matched CWS were over 3 times more likely than CWNS to fall outside the density ellipse (CWS = 38 cases; CWNS = 11 cases) and over 5 times more likely than CWNS to exhibit dissociations across speech-language domains (CWS = 27 cases; CWNS = 5 cases).
Findings from this subset of (Study 2’s) language-matched children are consistent with findings from the larger non-language-matched samples of children included in Study 2, as well as Anderson et al. (2005). That is, preschool-age CWS are 2 to 5 times more likely than CWNS to exhibit both outliers and dissociations across speech-language domains. Most importantly, as Anderson et al. (2005) pointed out with their findings, for Study 2 of the present report, the greater likelihood of dissociations among CWS compared to language-matched CWNS cannot be readily explained by the fact that CWS had scored significantly lower than CWNS on all five speech and language measures.
3.2.4. Degree of Dissociation and Speech Disfluency Measures
Examination of the degree of dissociation (i.e., the difference, in standard deviations, between two dissociated speech-language measures) among the 60 cases of dissociation produced by the 24 CWS-D revealed that there were 30 instances of dissociation with 2 or more standard deviations between the dissociated measures and 30 instances of dissociation with 1 to 1.9 standard deviations between dissociated measures (M = 1.94, SD = 0.63). Since many (67%) of the CWS-D exhibited more than one instance of dissociation, only the dissociation with the largest discrepancy between measures was chosen for inclusion in analysis.
Among the 24 CWS-D, Spearman’s correlation coefficients, with Bonferroni correction (alpha value = .0125), between the largest magnitude dissociation and total disfluencies (rs = .36, p = .08), stuttering-like disfluencies (rs = .24, p = .26), SSI-3 (rs = −.05, p = .83), and TSO (rs = −.16, p = .45) were not statistically significant. Thus, findings failed to provide appreciable support for the notion that speech disfluency measures are related to the magnitude of the dissociations.
3.2.5. Within-Group Analyses of Speech Disfluency and Speech-Language Measures
To assess whether speech disfluency and speech-language measures differed between CWS who do (CWS-D) and do not (CWS-ND) exhibit dissociations, it was necessary to ensure that the two groups were comparable in age and gender. To accomplish this goal, CWS-D (n = 24) and 24 members from the larger group of 61 CWS-ND were matched by age (± 2 months) and gender (9 females, 15 males per group). There was no significant difference in age between the group of CWS-D (M = 45.9, SD = 7.8) and CWS-ND (M = 46.0, SD = 7.7), t(46) = −0.02, p = .98.
A Mann-Whitney test revealed no significant difference between comparable groups of CWS-D and CWS-ND in stuttering-like disfluencies (z = −1.36, p = .17), total disfluencies (z = −0.29, p = .77), and the SSI-3 (z = −0.4, p = .69), consistent with the findings of Anderson et al. (2005; Table 3). Likewise, a Bonferroni-corrected Mann-Whitney test (alpha level = .0125) revealed that although the difference in TSO between CWS-D and CWS-ND approached, it did not reach significance (z = −2.06, p = .04). Thus, the frequency with which disfluencies are produced, the severity of stuttering, and the length of time in which a child has been stuttering do not appear to differentiate CWS-D from CWS-ND.
Table 3.
Study 2. Means (M) and Standard Deviations (SD) on Speech Disfluency Measures for Comparable Groups of Children who Stutter With and Without Dissociations
| CWS-D (n = 24) |
CWS-ND (n = 24) |
|||
|---|---|---|---|---|
| Speech Disfluency Measures | M | SD | M | SD |
| SLD | 7.87 | 6.85 | 8.64 | 3.76 |
| TD | 11.43 | 7.18 | 11.17 | 4.48 |
| SSI-3 | 15.23 | 8.23 | 13.71 | 5.71 |
| TSO | 5.35 | 5.55 | 14.17 | 13.32 |
Note. CWS-D = children who stutter with dissociations; CWS-ND = children who stutter without dissociations; SLD = mean frequency of stuttering-like disfluencies per 100 words (percent); TD = total frequency of disfluencies (stuttering-like plus other disfluencies) per 100 words (percent); SSI-3 = Stuttering Severity Instrument-3 (total score); TSO = time since stuttering onset (months).
There were 3 CWS-D and 1 CWS-ND who had more than one most common disfluency type. Thus, the data from these children were not included in the analysis, resulting in a total sample size of 44 children. The Fisher’s exact test revealed that the association between most common disfluency type (stuttering-like vs. other disfluencies) and group (CWS-D vs. CWS-ND) was significant (p = .04). Specifically, CWS-ND (95.7%) were more apt to exhibit a stuttering-like disfluency as their most common disfluency type (CWS-D = 71.4%), while CWS-D (28.6%) exhibited non-stuttered (other) disfluency types as their most common disfluency (CWS-ND = 4.3%). Although CWS-D produced more disfluency clusters (M = 4.9, SD = 6.3) per 300 word conversation speech sample than CWS-ND (M = 3.3, SD = 2.5), a Mann-Whitney test revealed that this difference was not statistically significant (z = −0.41, p = .69).
The omnibus MANOVA test revealed a significant multivariate effect of group on speech-language test performance, V = .26, F(5,42) = 2.99, p = .02 (Figure 4). Subsequent Bonferroni corrected univariate ANOVA tests (alpha level = .01) indicated that the 24 CWS-D scored significantly lower than the 24 CWS-ND on the TELD-3 Receptive subtest, F(1,46) = 6.04, p = .01, and the PPVT-III, F(1,47) = 8.12, p = .01. There were no significant differences between CWS-D and CWS-ND on the TELD-3 Expressive subtest, F(1,46) = 0.61, p = .44, EVT, F(1,46) = 2.69, p = .12, and the GFTA-2, F(1,46) = 3.71, p = .06.
Figure 4.

Study 2. Mean (standard error of the mean) standard scores on standardized speech-language measures (TELD-3 Expressive and Receptive subtests, PPVT-III, EVT, and GFTA-2) for comparable groups of children who stutter who do (CWS-D; n = 24) and do not (CWS-ND; n = 24) exhibit dissociations across speech-language domains.
3.3. Discussion
The purpose of Study 2 was to explore, using a much larger sample size, the presence and nature of dissociations in CWS versus CWNS and, within the CWS talker group, the relations these dissociations may have with various salient measures of speech disfluency and speech-language. In general, findings from Study 2 highlight important differences between groups of CWS and CWNS, as well as differences among CWS-D and CWS-ND. Results of this study offer further insight into the characteristics of these dissociations.
3.3.1. Some CWS are More Vulnerable to Dissociations
As with Study 1 and Anderson et al. (2005), findings from Study 2 revealed that CWS were more likely to exhibit dissociations across speech-language domains. Furthermore, results of Study 2 indicate that even when CWS are matched with CWNS in overall language abilities, CWS still exhibited, proportionally, more dissociations than CWNS. In fact, the proportion of dissociations in CWS versus CWNS actually increased from 2:1 to 5:1 in the language matched group of children. The reason for this increase is not clear. However, it would seem to provide further support for the contention that there may be subgroups of CWS who are more susceptible to exhibiting dissociations across domains of speech and language.
3.3.2. Some CWS are More Apt to Exhibit Dissociations in Certain Domains
CWS exhibited the most dissociations in the domains of receptive language (31 cases) and speech sound development (27 cases), but dissociations were also present in expressive vocabulary (25 cases), receptive vocabulary (20 cases), and expressive language (17 cases; see Table 2). In particular, CWS-D were more likely to exhibit receptive language abilities below speech sound development, expressive language, and expressive/receptive vocabulary skills. The relation of speech sound development to other speech-language components was more variable, with speech sound development tending to be below expressive vocabulary and language skills, but above receptive vocabulary and language skills. These findings, with respect to the increased frequency of dissociations associated with the domains of receptive language and sound development, as well as the direction of the dissociations, are not only consistent with those of Anderson et al. (2005), but also comparable to those of Study 1.
With respect to the latter, while most of the dissociations in Study 1 involved receptive vocabulary (11 cases), there were also an equally large number of dissociations involving receptive and expressive language (10 cases each), speech sound development (10 cases), and expressive vocabulary (9 cases; see Table 1). Thus, even though the frequency of dissociations were more equally distributed across domains in Study 1, 40% of the dissociations were still associated with receptive language and/or speech sound development, which is similar to the 48% in Study 2. Findings from Study 2 further revealed, consistent with Anderson et al., that CWS-D exhibited lower overall receptive language and receptive vocabulary abilities compared to CWS-ND. Taken together, these findings suggest that some CWS not only exhibit “unevenness” among speech-language components, but may also possess subtle “inefficiencies” in receptive language abilities and/or speech sound development.
3.3.3. Speech Fluency
The larger sample size in Study 2 (N = 170), relative to Study 1 and Anderson et al. (2005), increases the accuracy of statistical parameter estimates and power, thereby increasing the ability to reject the null hypothesis. Nevertheless, even with these sample size advantages, like Anderson et al., findings from Study 2 failed to reveal any significant differences between CWS-D and CWS-ND in the speech disfluency measures (stuttering-like disfluencies, total disfluencies, SSI-3, and TSO). Study 2 findings also extended our understanding of the nature of dissociations in CWS beyond what was reported in Study 1 and Anderson et al. (2005). In particular, CWS-ND were found to be more likely to produce a stuttering-like disfluency as their most common disfluency type, whereas CWS-D were more apt to produce a non-stuttered disfluency (see section 4.3). Furthermore, although the two groups of CWS could not be distinguished by virtue of their frequency of disfluency clusters, there is some suggestion, albeit not statistically significant, that CWS who have larger magnitude dissociations tend to produce more speech disfluencies.
4. General Discussion
The overall intent of the two studies described above was to (a) replicate the methods of Anderson et al. (2005) using a different sample of 40 CWS and 40 CWNS (Study 1) and (b) extend the findings of Anderson et al. using a larger, combined sample of 85 CWS and 85 CWNS, as well as analyze relations between dissociations and speech disfluency measures that had previously not been conducted (Study 2). In general, present findings indicated that CWS were 2 to 3 times more likely than CWNS to exhibit dissociations across speech-language domains and that the largest proportion of dissociations in CWS involved the domains of receptive language and speech sound development. Findings from Study 2 further revealed that CWS who exhibited dissociations were more likely to exhibit, as their most common disfluency type, other disfluencies (e.g., phrase repetitions, interjections, etc.), whereas CWS who did not exhibit dissociations were more likely to exhibit stuttering-like disfluencies (e.g., part-word repetitions, single-syllable word repetitions, etc.) as their most common type of disfluency.
4.1. Receptive Language
Findings from both studies indicate that CWS-D exhibited a considerable number of dissociations involving receptive language, with most patterns of dissociations involving lower receptive language abilities. Of these findings, the pattern of lower receptive than expressive language scores, in particular, warrants further consideration, as it represents a rather unique pattern of performance. In essence, this finding would seem to suggest that some CWS are producing language at a level beyond their receptive language capabilities–an idea that seems somewhat consistent with the commonly expressed parental view that CWS are “talking faster than they can think.” This inefficiency or incongruence within the speech-language processing system may, in turn, contribute to the likelihood of disruptions in the forward flow of fluent speech, taking the form of frequent repetitions, interjections, etc. Consistent with this notion, recent empirical studies examining the development of language and fluency in children with normally fluent speech (i.e., Hall & Burgess, 2000; Rispoli, 2003) indicate that among CWNS, the fluency of speech production may be sacrificed when producing increasingly complex language (again, an issue of dealing with language “processes” rather than exhibiting language “disorder”).
Furthermore, CWS-D exhibited significantly lower overall receptive language and receptive vocabulary abilities than CWS-ND. These findings are consistent with a longitudinal study of CWS (Yairi & Ambrose, 2005) that showed that CWS who continued to stutter exhibited lower receptive and expressive language scores, as measured by the Preschool Language Scale (Zimmerman, Steiner, & Pond, 1979), when compared to CWS whose stuttering recovered. Present results may be taken to suggest that a lag in receptive language skills observed in some CWS may contribute to the greater likelihood these children have to exhibit speech-language dissociations. Furthermore, the period in development when stuttering typically develops, as well as the time in which some CWS may be experiencing these language difficulties, coincides with a period of significant language growth (Hall et al., 2007). Discrepancies in language production that come about as a result of this increased linguistic complexity relative to language proficiency may play a role in the breakdown in speech fluency of CWS (Zackheim & Conture, 2003).
4.2. Articulation/Phonology
Both studies and Anderson et al (2005) found that a large proportion of dissociations among CWS were in the domain of speech sound development and other components of the speech-language system (for further discussion of the role of articulation/phonology in stuttering, see Byrd, Wolk & Davis, 2007; cf., Nippold 2001, 2002). If these findings are consistent with that of future replications, it may be the case that a “mismatch” among speech and language processing skills functions as a constraint on phonological processing capacity, which in turn, may have an impact on the ability of CWS to efficiently acquire the phonological components of new words. Baddeley, Gathercole and Papagno’s (1998) review of the empirical research examining word learning of adults and children indicates that the “phonological loop” (i.e., phonological working memory capacity) functions as an important aspect in the process of learning new words. For example, typically-developing children who score higher on measures of receptive vocabulary tend to repeat nonwords, a commonly used measure of phonological working memory, more accurately than children who score lower on measures of receptive vocabulary (see Coady & Evans, 2008, for review). Similarly, it has been consistently shown that children with specific language impairment have deficits in both phonological working memory and lexical development, the co-occurrence of which has been attributed to the suggestion that a reduction in capacity for phonological working memory may restrict the addition of new items into the lexicon (see Coady & Evans). There is evidence to suggest that CWS may also have difficulties with phonological working memory (Anderson, Wagovich, & Hall, 2006; Hakim & Ratner, 2004). Therefore, difficulties with phonological working memory may have some influence on the language abilities of CWS and in conjunction with a possible unevenness in development within the speech-language system, may contribute to disruptions in the forward flow of fluent speech, at least for some of these children.
Taken as a whole, present and related findings of others suggest that CWS, when compared to CWNS, may exhibit (1) generally lower articulation/phonological abilities (Blood, Ridenour, Qualls, & Hammer, 2003; Månsson, 2007; Pellowski, Conture, Anderson, & Ohde, 2001; Yairi & Ambrose, 2005), (2) less apparent organization between accuracy and speed of articulatory performance (Melnick, Conture, & Ohde, 2003), and (3) less mature method of phonological processing for a longer period of time during early childhood (see Byrd, Wolk & Davis, 2007, for general review; cf., Nippold, 2001, 2002). When these challenges–(1), (2), and/or (3)–interact with other speech-language processes (i.e., lexical retrieval, morphosyntactic construction), quick, efficient, and fluent initiation and/or maintenance of speech-language planning and processing may be compromised. Perhaps these challenges contribute to the length of time a child will continue to stutter as well as the divergent rate of development of their articulatory/phonological skills and other sub-components of speech and language. It is tempting to speculate that these relatively, subtle inefficiencies in speech sound development in relation to other speech-language processes creates an imbalance within the system that may lead to disruptions in the forward flow of fluent speech, at least for a non-trivial number of CWS.
4.3. Relation of Dissociation to Disfluency Characteristics
Although findings of Study 2 revealed no significant relationships between the degree of dissociation and speech disfluency measures (stuttering-like and total disfluencies, SSI-3, and TSO), there was a significant difference in most common disfluency type between CWS-D and CWS-ND. Specifically, CWS-D were most apt to exhibit non-stuttered disfluencies and CWS-ND stuttering-like disfluencies. These findings appear to be somewhat inexplicable, but may be rendered more comprehensible when considered in the context of the psycholinguistic literature on normal disfluencies.
Accordingly, it has been suggested that filled pauses (i.e., interjections) may represent an attempt by the speaker to give him- or herself more time to plan an utterance, whereas revisions correspond to errors that speakers make in response to insufficient planning (e.g., Clark & Wasow, 1998). Thus, perhaps CWS-D experience developmental lags in aspects of their language growth, wherein one speech-language domain is slower to develop than another, which leads to delays or difficulties in planning that are subsequently expressed to listeners as disfluencies. In other words, that CWS-D produce more disfluencies of the “normal” or non-stuttered variety suggests that this subgroup of children may have an additional linguistic component to their disfluencies. Furthermore, the fact that CWS-ND were more apt to exhibit stuttering-like disfluencies in their speech, compared to CWS-D, implies that dissociations in and of themselves cannot adequately explain stuttering.
In summary, the presence and, to some degree, magnitude of dissociations within the CWS talker group seems to influence the type and, perhaps, frequency of disfluencies exhibited. Nonetheless, it is also interesting to consider that dissociations may render the speech-language systems of at least some CWS vulnerable to manifold overlapping or concurrent processing demands (i.e., communicative, cognitive, emotional) that occur during conversational speech, as will be discussed below.
4.4. Interaction Between Dissociations and Increased Processing Demands
Perhaps asynchrony among the various linguistic domains–occurring within an otherwise “normal” speech-language planning and production system–may not impact the speaker’s speech fluency until the speaker’s system is under increased external/internal processing demands. For example, Caruso, Chodzko-Zajko, Bidinger, and Sommers (1994) studied the effects of increasing temporal and cognitive demands on the speech and language processing of adults who do (AWS) and do not stutter (AWNS). Caruso et al. reported that increased cognitive demands or “cognitive stress” on the speech and language processes of adults resulted in increased disfluencies and greater temporal disruptions in the speech of AWS compared to AWNS.
In addition to increased disfluencies, AWS also appear to exhibit decreased efficiency in phonological encoding processing in response to cognitive stress. Weber-Fox, Spencer, Spruill, and Smith (2004) indicate that AWS and AWNS have similar phonological encoding systems during tasks in which overt speech production is not required. In contrast, when compared to AWNS under conditions of increased cognitive requirements, AWS exhibited increased vulnerability to this cognitive loading and decreased efficiency in phonological coding processes. Weber-Fox et al.’s findings are taken to suggest that it may not necessarily be an underlying phonological processing deficit that contributes to the development of stuttering as much as that system’s vulnerability interacting with increased cognitive loads. Likewise, when compared to AWNS, increases in time constraints and syntactic complexity may be associated with less efficient syntactic processing among AWS (Cuadrado & Weber-Fox, 2003), a finding similar to that of Anderson and Conture (2004) who reported that CWS do not seem to be operating at the upper end of their morpho-syntactic processing system. And these concurrent “loads” need not be restricted to cognitive, speech-language, and/or temporal domains but also be added to or even replaced by other domains such as emotional and/or social processes–for example, speaking in front of the class about a Halloween costume that one is very excited about wearing on Halloween night.
5. Conclusions
Findings from Studies 1 and 2 indicate that the speech and language processing systems of CWS, when compared to CWNS, are more apt to contain dissociations among subcomponents of that system. Furthermore, such dissociations, at least for those who exhibit them, are significantly related to the type of (non)stuttered speech disfluencies produced. Speech-language dissociations, therefore, do not merely distinguish between the diagnostic classification of CWS versus CWNS, but also seems to impact the type of behavior that serves the basis for this diagnostic classification, a finding neither typically found nor reported upon in the empirical literature pertaining to stuttering in young children.
When considering some of the theoretical implications of the present findings, speech-language dissociations may render the speech-language processing systems of CWS more vulnerable to interference from concurrent processing demands, whether those are temporal (e.g., pressure to respond quickly), emotional (e.g., emotional arousal during speech-language planning and production), or cognitive (e.g., formulation of complex utterance) (see Bosshardt, 2006, for further discussion and empirical support for these notions) in nature. Thus, some preschool-age CWS may exhibit such subtle deficits in their speech and language abilities during a period of development involving considerable language growth, which in turn, leads to tradeoffs between linguistic requirements and speech fluency. Perhaps then, for a subgroup of CWS who exhibit dissociations across speech-language domains, such asynchrony among speech-language abilities could make it difficult for these children to easily and efficiently establish and/or maintain normally-fluent speech-language planning and production.
For example, these dissociations may represent markers or proxies for less coordinated or synchronous subcomponents of speech-language planning and production systems, a possibility Bosshardt’s (2006) findings and speculations suggest would render these systems vulnerable to concurrent processing demands. Whether these speculations are supported by future empirical findings, the presence and frequency of speech-language dissociations in the population of CWS appears to warrant further empirical consideration. Likewise, such findings pose a challenge to any theory or model of stuttering solely based on the notion that a frank “deficiency” of or deficit in speech-language causes stuttering due to the fact that speech-language dissociations can be observed in CWS whose speech-language abilities are well within normal limits. Taken together present empirical findings and related speculation there would appear to be a need to develop more formal theoretical models to account for this phenomenon as well as its possible influence on childhood stuttering.
Acknowledgments
Research was supported by NIH/NIDCD research grants R01DC000523-14, R01DC00647-01A2, and 2R56DC00053-14A1, as well as a Vanderbilt University Discovery Grant. The authors would like to express their sincere appreciation for the many children and parents who gave of their time and energy to participate in this study and without whose cooperation this work would not have been possible.
Footnotes
Publisher's Disclaimer: This is a PDF file of an unedited manuscript that has been accepted for publication. As a service to our customers we are providing this early version of the manuscript. The manuscript will undergo copyediting, typesetting, and review of the resulting proof before it is published in its final citable form. Please note that during the production process errors may be discovered which could affect the content, and all legal disclaimers that apply to the journal pertain.
Contributor Information
Christine E. Coulter, Department of Hearing and Speech Sciences, Vanderbilt University
Julie D. Anderson, Department of Speech and Hearing Science, Indiana University
Edward G. Conture, Department of Hearing and Speech Sciences, Vanderbilt University.
References
- American Speech-Language-Hearing Association. Guidelines for screening for hearing impairment and middle ear disorders. ASHA. 1990;32(Suppl 2):17–24. [PubMed] [Google Scholar]
- Anderson JD. Phonological neighborhood and word frequency effects in the stuttered disfluencies of children who stutter. Journal of Speech, Language, and Hearing Research. 2007;50:229–247. doi: 10.1044/1092-4388(2007/018). [DOI] [PMC free article] [PubMed] [Google Scholar]
- Anderson JD, Byrd CT. Phonotactic probability effects in children who stutter. Journal of Speech, Language, and Hearing Research. 2008;51:851–866. doi: 10.1044/1092-4388(2008/062). [DOI] [PMC free article] [PubMed] [Google Scholar]
- Anderson JD, Conture EG. Language abilities of children who stutter: A preliminary study. Journal of Fluency Disorders. 2000;25:283–304. [Google Scholar]
- Anderson JD, Conture EG. Sentence-structure priming in young children who do and do not stutter. Journal of Speech, Language, and Hearing Research. 2004;47:552–571. doi: 10.1044/1092-4388(2004/043). [DOI] [PMC free article] [PubMed] [Google Scholar]
- Anderson JD, Pellowski MW, Conture EG. Childhood stuttering and dissociations across linguistic domains. Journal of Fluency Disorders. 2005;30:219–253. doi: 10.1016/j.jfludis.2005.05.006. [DOI] [PubMed] [Google Scholar]
- Anderson JD, Wagovich SA, Hall NE. Nonword repetition skills in young children who do and do not stutter. Journal of Fluency Disorders. 2006;31:177–199. doi: 10.1016/j.jfludis.2006.05.001. [DOI] [PMC free article] [PubMed] [Google Scholar]
- Arnold H, Conture E, Key A, Walden T. Emotional reactivity, regulation and childhood stuttering: A behavioral, electrophysiological study. 2009 doi: 10.1016/j.jcomdis.2010.12.003. Manuscript submitted for publication. [DOI] [PMC free article] [PubMed] [Google Scholar]
- Arnold HS, Conture EG, Ohde RN. Phonological neighborhood density in the picture naming of young children who stutter: Preliminary study. Journal of Fluency Disorders. 2005;30:125–148. doi: 10.1016/j.jfludis.2005.01.001. [DOI] [PubMed] [Google Scholar]
- Baddeley A, Gathercole S, Papagno C. The phonological loop as a language learning device. Psychological Review. 1998;105:158–173. doi: 10.1037/0033-295x.105.1.158. [DOI] [PubMed] [Google Scholar]
- Bajaj A, Hodson B, Schommer-Aiken M. Performance on phonological and grammatical awareness metalinguistic tasks by children who stutter and their fluent peers. Journal of Fluency Disorders. 2004;29:63–77. doi: 10.1016/j.jfludis.2004.01.001. [DOI] [PubMed] [Google Scholar]
- Bates E, Applebaum M, Sacedo J, Saygin AP, Pizzamiglio L. Quantifying dissociations in neuropsychological research. Journal of Clinical and Experimental Neuropsychology. 2003;25:1128–1153. doi: 10.1076/jcen.25.8.1128.16724. [DOI] [PubMed] [Google Scholar]
- Blood GW, Ridenour VJ, Qualls CD, Hammer CS. Co-occurring disorders in children who stutter. Journal of Communication Disorders. 2003;36:427–448. doi: 10.1016/s0021-9924(03)00023-6. [DOI] [PubMed] [Google Scholar]
- Bosshardt HG. Cognitive processing load as a determinant of stuttering: Summary of a research programme. Clinical Linguistics & Phonetics. 2006;20:371–385. doi: 10.1080/02699200500074321. [DOI] [PubMed] [Google Scholar]
- Byrd C, Wolk L, Davis B. Role of phonology in childhood stuttering and its treatment. In: Conture E, Curlee R, editors. Stuttering and Related Fluency Disorders. NY, NY: Thieme Medical; 2007. [Google Scholar]
- Caruso AJ, Chodzko-Zajko WJ, Bidinger DA, Sommers RK. Adults who stutter: Responses to cognitive stress. Journal of Speech and Hearing Research. 1994;37:746–754. doi: 10.1044/jshr.3704.746. [DOI] [PubMed] [Google Scholar]
- Clark HH, Wasow T. Repeating words in spontaneous speech. Cognitive Psychology. 1998;37:201–242. doi: 10.1006/cogp.1998.0693. [DOI] [PubMed] [Google Scholar]
- Coady JA, Evans JL. Uses and interpretations of non-word repetition tasks in children with and without specific language impairments (SLI) International Journal of Language and Communication Disorders. 2008;43:1–40. doi: 10.1080/13682820601116485. [DOI] [PMC free article] [PubMed] [Google Scholar]
- Cohen J. A power primer. Psychological Bulletin. 1992;112:155–159. doi: 10.1037//0033-2909.112.1.155. [DOI] [PubMed] [Google Scholar]
- Cuadrado EM, Weber-Fox CM. Atypical syntactic processing in individuals who stutter: Evidence from event-related brain potentials and behavioral measures. Journal of Speech, Language, and Hearing Research. 2003;46:960–976. doi: 10.1044/1092-4388(2003/075). [DOI] [PubMed] [Google Scholar]
- Dunn L, Dunn L. Peabody Picture Vocabulary Test-III (PPVT-III) 3. Circle Pines, MN: American Guidance Service, Inc; 1997. [Google Scholar]
- Goldman R, Fristoe M. Goldman-Fristoe Test of Articulation-2 (GFTA-2) Circle Pines, MN: American Guidance Services, Inc; 2000. [Google Scholar]
- Häge A. In: Bosshardt HG, Yaruss JS, Peters HFM, editors. Is there a link between the development of cognitive-linguistic abilities in children and the course of stuttering?; Proceedings of the Third World Congress on Fluency Disorders: Theory, Research, Treatment, and Self-help; Nijmegen, The Netherlands: University of Nijmegen Press; 2001. pp. 192–194. [Google Scholar]
- Hakim HB, Ratner NB. Nonword repetition abilities of children who stutter: An exploratory study. Journal of Fluency Disorders. 2004;29:179–199. doi: 10.1016/j.jfludis.2004.06.001. [DOI] [PubMed] [Google Scholar]
- Hall NE. Language and fluency in child language disorders: Changes over time. Journal of Fluency Disorders. 1996;21:1–32. [Google Scholar]
- Hall NE. Lexical development and retrieval in treating children who stutter. Language, Speech, and Hearing Services in Schools. 2004;35:57–69. doi: 10.1044/0161-1461(2004/007). [DOI] [PubMed] [Google Scholar]
- Hall NE, Burgess SD. Exploring developmental changes in fluency as related to language acquisition: A case study. Journal of Fluency Disorders. 2000;25:119–141. [Google Scholar]
- Hall NE, Wagovich SA, Bernstein Ratner N. Language considerations in developmental stuttering. In: Conture E, Curlee R, editors. Stuttering and related disorders of fluency. 3. New York: Thieme; 2007. pp. 153–167. [Google Scholar]
- Hall NE, Yamashita TS, Aram DM. Relationship between language and fluency in children with developmental language disorders. Journal of Speech and Hearing Research. 1993;36:568–579. doi: 10.1044/jshr.3603.568. [DOI] [PubMed] [Google Scholar]
- Hintze JL. PASS User’s Guide: Pass 2005 Power Analysis and Sample Size for Windows. Kaysville Utah: NCSS; 2005. 2005 Version. [Google Scholar]
- Howell P, Au-Yeung J. Syntactic determinants of stuttering in the spontaneous speech of normally fluent and stuttering children. Journal of Fluency Disorders. 1995;20:317–330. [Google Scholar]
- Howell P, Au-Yeung J, Sackin S. Exchange of stuttering from function words to content words with age. Journal of Speech, Language, and Hearing Research. 1999;42:345–354. doi: 10.1044/jslhr.4202.345. [DOI] [PMC free article] [PubMed] [Google Scholar]
- Hresko W, Reid D, Hamill D. Test of Early Language Development-3 (TELD-3) Austin, TX: Pro-Ed; 1999. [Google Scholar]
- Hubbard CP, Yairi E. Clustering of disfluencies in the speech of stuttering and nonstuttering preschool children. Journal of Speech and Hearing Research. 1988;31:228–233. doi: 10.1044/jshr.3102.228. [DOI] [PubMed] [Google Scholar]
- Just MA, Carpenter PA. A capacity theory of comprehension: Individual differences in working memory. Psychological Review. 1992;99:122–149. doi: 10.1037/0033-295x.99.1.122. [DOI] [PubMed] [Google Scholar]
- Karrass J, Walden T, Conture EG, Graham C, Arnold HS, Hartfield KN, et al. Relation of emotional reactivity and regulation to childhood stuttering. Journal of Communication Disorders. 2006;39:402–423. doi: 10.1016/j.jcomdis.2005.12.004. [DOI] [PMC free article] [PubMed] [Google Scholar]
- Kloth S, Kraaimaat F, Janssen P, Brutten G. Persistence and remission of incipient stuttering among high-risk children. Journal of Fluency Disorders. 1999;24:253–265. [Google Scholar]
- LaSalle LR, Conture EG. Disfluency clusters of children who stutter: Relation of stutterings to self-repairs. Journal of Speech and Hearing Research. 1995;38:965–977. doi: 10.1044/jshr.3805.965. [DOI] [PubMed] [Google Scholar]
- Logan KJ, Conture EG. Length, grammatical complexity, and rate differences in stuttered and fluent conversational utterances of children who stutter. Journal of Fluency Disorders. 1995;20:35–61. [Google Scholar]
- Månsson H. In: Au-Yeung J, Leahy M, editors. Complexity and diversity in early childhood stuttering; Proceedings of the Fifth World Congress on Fluency Disorders; Dublin, Ireland: The International Fluency Association; 2007. pp. 98–101. [Google Scholar]
- Melnick KS, Conture EG. Relationship of length and grammatical complexity to the systematic and nonsystematic speech errors and stuttering of children who stutter. Journal of Fluency Disorders. 2000;25:21–45. [Google Scholar]
- Melnick KS, Conture EG, Ohde RN. Phonological priming in picture naming of young children who stutter. Journal of Speech, Language, and Hearing Research. 2003;46:1428–1443. doi: 10.1044/1092-4388(2003/111). [DOI] [PubMed] [Google Scholar]
- Murray HL, Reed CG. Language abilities of preschool stuttering children. Journal of Fluency Disorders. 1977;2:171–176. [Google Scholar]
- Myers JK, Bean LL. A decade later: A follow-up of social class and mental illness. New York: John Wiley & Sons Inc; 1968. [Google Scholar]
- Nippold M. Phonological disorders and stuttering: What is the frequency of co-occurrence? Clinical and Linguistic Phonetics. 2001;15:219–228. [Google Scholar]
- Nippold M. Stuttering and phonology: Is there an interaction? American Journal of Speech-Language Pathology. 2002;11:99–110. [Google Scholar]
- Palen C, Peterson JM. Word frequency and children’s stuttering: The relationship to sentence structure. Journal of Fluency Disorders. 1982;7:55–62. [Google Scholar]
- Pellowski MW, Conture EG. Characteristics of speech disfluency and stuttering behaviors in 3- and 4-year-old children. Journal of Speech, Language, and Hearing Research. 2002;45:20–34. doi: 10.1044/1092-4388(2002/002). [DOI] [PubMed] [Google Scholar]
- Pellowski MW, Conture EG. Lexical priming in picture naming of young children who stutter. Journal of Speech, Language, and Hearing Research. 2005;48:278–294. doi: 10.1044/1092-4388(2005/019). [DOI] [PubMed] [Google Scholar]
- Pellowski MW, Conture EG, Anderson JD, Ohde RN. In: Bosshardt HG, Yaruss JS, Peters HFM, editors. Articulatory and phonological assessment of children who stutter; Proceedings of the Third World Congress on Fluency Disorders: Theory, Research, Treatment, and Self-help; Nijmegen, The Netherlands: University of Nijmegen Press; 2001. pp. 248–252. [Google Scholar]
- Reilly S, Onslow M, Packman A, Wake M, Bavin E, Prior M, et al. Predicting stuttering onset by the age of 3 years: A prospective, community cohort study. Pediatrics. 2009;123:270–277. doi: 10.1542/peds.2007-3219. [DOI] [PMC free article] [PubMed] [Google Scholar]
- Richels C, Buhr A, Conture E, Ntourou K. How do utterance complexity, position and word class influence children’s loci of stuttering? 2009 Manuscript submitted for publication. [Google Scholar]
- Riley GD. Stuttering Severity Instrument for Children and Adults-3 (SSI-3) 3. Austin, TX: Pro-Ed; 1994. [DOI] [PubMed] [Google Scholar]
- Rispoli M. Changes in the nature of sentence production during the period of grammatical development. Journal of Speech, Language, and Hearing Research. 2003;46:818–830. doi: 10.1044/1092-4388(2003/064). [DOI] [PubMed] [Google Scholar]
- Ryan BP. Articulation, language, rate, and fluency characteristics of stuttering and nonstuttering preschool children. Journal of Speech and Hearing Research. 1992;35:333–342. doi: 10.1044/jshr.3502.333. [DOI] [PubMed] [Google Scholar]
- Sall J, Creighton L, Lehman A. JMP start statistics: A guide to statistics and data analysis using JMP and JMP IN software. 3. Belmont, CA: Thomson Learning; 2004. [Google Scholar]
- Schwartz HD, Conture EG. Subgrouping young stutterers: Preliminary behavioral observations. Journal of Speech and Hearing Research. 1988;31:62–71. doi: 10.1044/jshr.3101.62. [DOI] [PubMed] [Google Scholar]
- Soderberg GA. The relations of stuttering to word length and word frequency. Journal of Speech and Hearing Research. 1966;9:584–589. [Google Scholar]
- SPSS Inc. SPSS Base 12.0 for Windows User’s Guide. Chicago, IL: SPSS Inc; 2003. [Google Scholar]
- Watkins R, Yairi E. Language productions abilities of children whose stuttering persisted or recovered. Journal of Speech, Language, and Hearing Research. 1997;40:385–399. doi: 10.1044/jslhr.4002.385. [DOI] [PubMed] [Google Scholar]
- Watkins R, Yairi E, Ambrose N. Early childhood stuttering III: Initial status of expressive language abilities. Journal of Speech, Language and Hearing Research. 1999;42:1125–1135. doi: 10.1044/jslhr.4205.1125. [DOI] [PubMed] [Google Scholar]
- Weber-Fox C, Spencer RM, Spruill JE, Smith A. Phonologic processing in adults who stutter: Electrophysiological and behavioral evidence. Journal of Speech, Language, and Hearing Research. 2004;47:1244–1258. doi: 10.1044/1092-4388(2004/094). [DOI] [PubMed] [Google Scholar]
- Westby CE. Language performance of stuttering and nonstuttering children. Journal of Communications Disorders. 1974;12:133–145. doi: 10.1016/0021-9924(79)90036-4. [DOI] [PubMed] [Google Scholar]
- Williams KT. Expressive Vocabulary Test (EVT) Circle Pines, MN: American Guidance Service, Inc; 1997. [Google Scholar]
- Yairi E. Disfluency characteristics of childhood stuttering. In: Curlee RF, Siegel GM, editors. Nature and treatment of stuttering: New directions. 2. Boston, MA: Allyn and Bacon; 1997. pp. 49–78. [Google Scholar]
- Yairi E. Subtyping stuttering I: A review. Journal of Fluency Disorders. 2007;32:165–196. doi: 10.1016/j.jfludis.2007.04.001. [DOI] [PubMed] [Google Scholar]
- Yairi E, Ambrose N. A longitudinal study of stuttering in children: a preliminary report. Journal of Speech and hearing Research. 1992;35:755–760. doi: 10.1044/jshr.3504.755. [DOI] [PubMed] [Google Scholar]
- Yairi E, Ambrose N. Early childhood stuttering: For clinicians, by clinicians. Austin, TX: Pro-Ed; 2005. [Google Scholar]
- Yaruss JS. Utterance length, syntactic complexity, and childhood stuttering. Journal of Speech, Language, and Hearing Research. 1999;42:329–344. doi: 10.1044/jslhr.4202.329. [DOI] [PubMed] [Google Scholar]
- Yaruss JS, LaSalle LR, Conture EG. Evaluating stuttering in young children: Diagnostic data. American Journal of Speech-Language Pathology. 1998;7:62–76. [Google Scholar]
- Zackheim CT, Conture EG. Childhood stuttering and speech disfluencies in relation to children’s mean length of utterance: A preliminary study. Journal of Fluency Disorders. 2003;28:115–142. doi: 10.1016/s0094-730x(03)00007-x. [DOI] [PubMed] [Google Scholar]
- Zimmerman I, Steiner V, Pond R. Preschool Language Scale. San Antonio, TX: Psychological Corporation; 1979. [Google Scholar]