Abstract
Molecular dynamics simulations are used to calculate the time dependent Stokes shift following photoexcitation of Trp-7 (W7) in myoglobin. In agreement with experiment, a long time (~60ps) component is observed. Since the long time Stokes shift component is absent when we repeat the calculation with protein frozen at the instant of photoexcitation, we firmly establish that protein flexibility is required to observe slow Stokes shift dynamics in this case. A transition between sub-states near the middle of a 30ns ground state trajectory gave us an opportunity to compare solvation dynamics in two different environments. While some of the superficial features are different, we find that the underlying dynamics are shared by the two isomers. It is necessary to look beyond a decomposition of the Stokes shift into protein and water contributions, and probe the underlying dynamics of protein side groups, backbone, and water dynamics to obtain a full picture of the relaxation process. We analyze water residence times, diffusion, and reorientation dynamics in the hydration layer. We find slow components in each of these quantities, and critically examine their origin and how they affect the observed Stokes shift.
1 Introduction
Time-dependent fluorescence Stokes shift experiments reveal the dynamics with which the environment of a chromophore relaxes following photoexcitation. In these experiments, the relaxation dynamics of small molecules in water is complete on a time scale of several picoseconds, while near proteins the dynamics can take tens of picoseconds or even much longer.1–6 Two very different explanations for the long time scale dynamics near proteins have been advanced. Nandi and Bagchi developed a model for water near biological molecules involving a dynamic equilibrium between “bound” water molecules incapable of independent reorientation, and “free” waters capable of rapid reorientation.7 Based on this model, Bagchi, Zewail and coworkers propose that the observed slow dynamics near proteins as monitored in time-dependent fluorescence experiments is an inherent feature of water in the potential field of a protein.5–12 In their analysis, the potential field of the protein is sufficiently strong to inhibit rotation of nearby water molecules. In their model, the observed long time scale for relaxation dynamics is set by the time for exchange of waters between a bound state near the protein and a “quasi-free” state. In contrast, Halle and Nilsson13, 14 work on the assumption that water-protein interactions are comparable to water-water interactions. Hence the local dynamics of water close to a protein, while not identical to bulk water, should also not be on a vastly different time scale. Instead, Halle and Nilsson propose that interactions between protein and chromophore play an active role in solvation, and that it is the slow dynamics of the protein in aqueous solvent that leads to the observed long time scale in time-dependent Stokes shift experiments. Nilsson and Halle simulated the fluorescence Stokes shift of monellin,14 and found that when the theoretical Stokes shift was broken into chromophore-protein and chromophore-water contributions, only the former exhibited slow dynamics.
In this work we theoretically examine the relaxation dynamics of myoglobin following photoexcitation in aqueous solvent. To deepen the analysis of the relaxation dynamics, we track the evolution of an ensemble in which the protein degrees of freedom are constrained after photoexcitation and only the water molecules evolve in time, as well as an ensemble in which all degrees of freedom are active. By freezing the protein, we isolate and quantify the inherent dynamics of the aqueous solvent. Molecular dynamics with frozen degrees of freedom or with degrees of freedom separately thermostatted into hot and cold groups have been previously used to determine the types of motion that enable the protein glass transition.15–17 Senapati and Berkowitz have frozen the surfactant molecules in a simulation of a reverse micelle to determine the contribution of membrane fluctuations to the rotational dynamics within the hydration layer.18, 19
By comparison with studies where both protein and water are allowed to move, we can test the assumptions of the Nandi-Bagchi-Zewail and Halle-Nilsson models. If slow dynamics is an inherent feature of water trapped in the strong potential field of a protein, one should still observe slow dynamics when the protein is frozen. Alternatively, if protein motion is essential for observation of slow evolution of the Stokes shift, then the slow components should be absent in the frozen protein studies. For the case study of tryptophan 7 (W7) in myoglobin presented here, we find that the evidence confirms Nilsson and Halle’s emphasis on the importance of protein motion. However, we find that Nilsson and Halle14 come to their conclusion for the wrong reason. They base their conclusion on the fact that the water contribution to the fluorescence Stokes shift exhibited no slow (~50–100ps) component, while the protein contribution did have a long-time component. Because protein and water dynamics are intimately coupled, we find that slow dynamics of the total Stokes shift may apparently originate with either the water or protein component, or both. One of those components may appear flat at long time because of competing effects, even though underlying dynamics involving that component are taking place. Nevertheless, Halle and Nilsson’s basic idea that protein flexibility is essential for the slow component of the Stokes shift seems to hold for the case of W7 in myoglobin we study here. We have investigated the effect of protein flexibilty on the dynamics of nearby water. Freezing the protein does not make a qualitative difference in the dynamics of water in the hydration layer, although slowing of some features is noted. Even when water dynamics is slowed by freezing the protein, we have documented that slow water dynamics near a frozen protein, if present, would be well within the detection limits of our simulations.
We do not take this as proof that a single explanation holds for chromophore relaxation dynamics in all proteins, although it is replicated in two other systems currently under study.20 Furthermore, even though protein flexibility is essential, two other points deserve emphasis: First, it is coupled protein-water motion that sets the time scale for the relaxation process. Freezing water, like freezing the protein, eliminates the slow component of the Stokes shift.21 Second, we confirm that orientational and diffusive motion of water in the layer directly hydrating the protein exhibit dynamics that are orders of magnitude slower than bulk water, as has been emphasized by Bagchi and co-workers.5, 7–12, 22 However, inherent slow dynamics of the hydration layer cannot produce a slow component in the Stokes shift for W7 in myoglobin without protein flexibility. Eventually, as more cases are examined in detail, a comprehensive picture of protein solvation dynamics will emerge. Here, we take the term “solvation” in a broad sense that encompasses solvation via interactions with water and with protein.
A brief account of the effect of freezing the protein on the Stokes shift has appeared earlier.21 This work provides a full analysis, and a detailed study of the dynamics of the hydration layer. In section 2 we describe the molecular dynamics methods employed in our study. Then in section 3 we describe a long 30ns molecular dynamics trajectory for myoglobin in its ground state. There we find that dynamical events in myoglobin occur on time scales extending out to at least 10ns. In section 4 the dynamics of myoglobin following photo-excitation is examined. Freezing the protein coordinates following photo-excitation allows us to unambiguously tease out the contribution of protein motion, and the strong coupling of water with the protein motion, to the relaxation process. In section 5 we analyze the residence reorientation times of water in the hydration shell. Indeed there are fast and slow processes observed, but care must be taken before the slow dynamics are linked to the slow component of the fluorescence Stokes shift. Finally, in section 6 we draw conclusions from our results.
2 Simulation methods
Simulations for the 154-residue protein myoglobin were conducted using a double precision version of the GROMACS package23–25 and GROMOS96 force field.26 Since we were interested in solvent dynamics, we used the SPC/E water model because the dynamical properties like the diffusion constant are in good agreement with experiment for this model. We note that even though the GROMOS96 force field was parametrized with the SPC water model, van Gunsteren and co-workers obtained better agreement with experimental reorientation times for the tryptophan monopeptide using GROMOS96 in combination with the SPC/E model.27 In our study of the Lys-Trp-Lys tripeptide, we found that using the choice of SPC versus SPC/E did not make a qualitative difference in the results.28 The non-bonded pair list was produced using a cut-off of 9Å. Long range electrostatic interactions were handled using the smoothed particle mesh Ewald (SPME) algorithm29, 30 with a real space cutoff length of 9Å. The cutoff length for the Lennard-Jones potential was set at 14Å. All bond lengths were constrained using the LINCS algorithm,31 allowing a 2fs time step in the simulation. Periodic boundary conditions were implemented using a truncated triclinic box of side length 60Å and solvated with 4537 water molecules. In order to make the whole system neutral, two sodium ions were introduced into the system. The Nosé-Hoover thermostat32– 34 was used to maintain the the system at 295K. The initial configuration of myoglobin is taken from the crystal structure with Protein Data Bank35 ID code 1MBD.
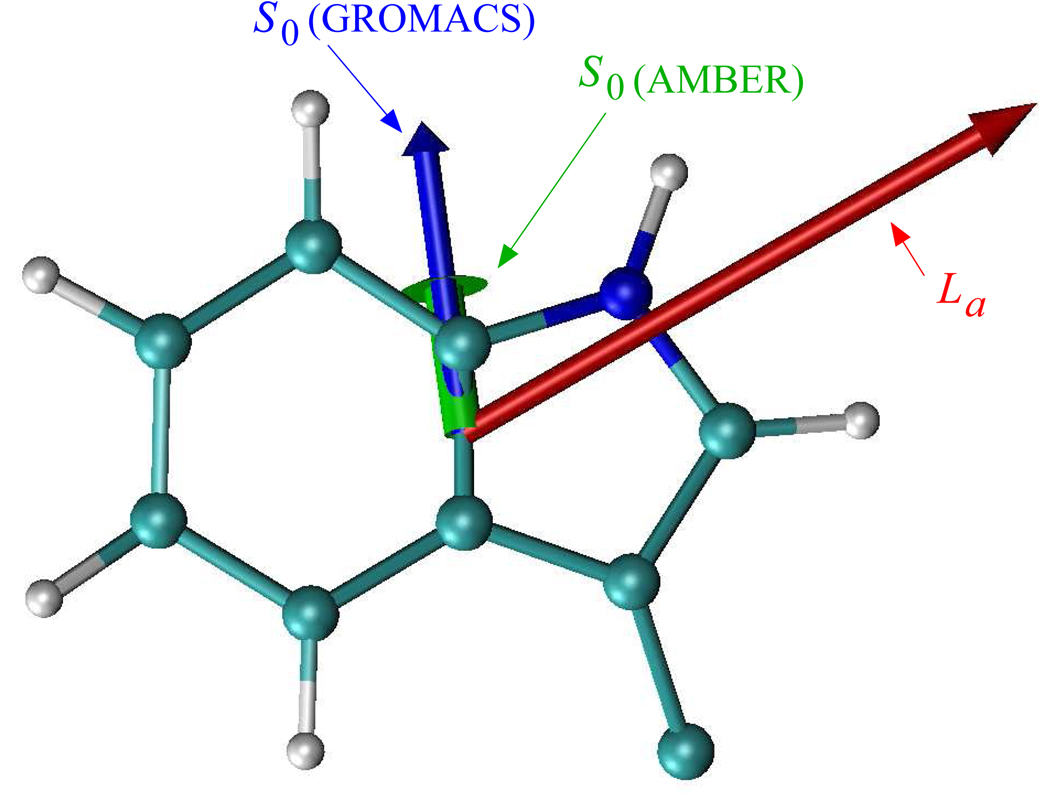
The partial charges of the indole chromophore in the S0 state came from the GROMOS96 force field. For the La excited state of indole ring, which is the fluorescing state of Trp in protein, we modified the partial charges of the indole chromophore by applying the ab initio charge density differences calculated by Sobolewski and Domcke36 to the ground state partial charges of the GROMOS96 force field. Fig. 1 shows the dipole moment of the indole chromophore in both ground state and our model of the La state, which is 2.4 and 4.9 Debye, respectively. The scheme described here is approximate in several ways. Most significantly, it neglects polarization of the chromophore in response to fluctuations of its protein and solvent environment. Despite its limitations, when applied to the Lys-Trp-Lys tripeptide,28 this model gave total Stokes shifts in near quantitative agreement with experiment.37 Similar agreement with experiment38 was obtained with this model for tryptophan in bulk water.20
Figure 1.
The ground state dipole moment of the indole chromophore from the partial charges of the Amber-7 and GROMACS force fields (1.30 and 2.41 Debye, respectively) and the La excited state dipole moment (4.96 Debye) constructed for our simulations as described in the text are depicted on the left.
3 Analysis of a structural transition
Myoglobin has been studied many times using molecular dynamics simulations.39–63 Most of these studies involve trajectories of much less than 1ns, although a few stand out as significantly longer with trajectories of 1ns,59 1.1ns,49 1–2ns,50 80ns,60 and 90ns.61 After equilibration for 800ps, we sampled a trajectory of ground state myoglobin extending over 30ns and found structural fluctuations occurring on a time scale of several nanoseconds. Therefore, significantly shorter trajectories will miss dynamics on this time scale.
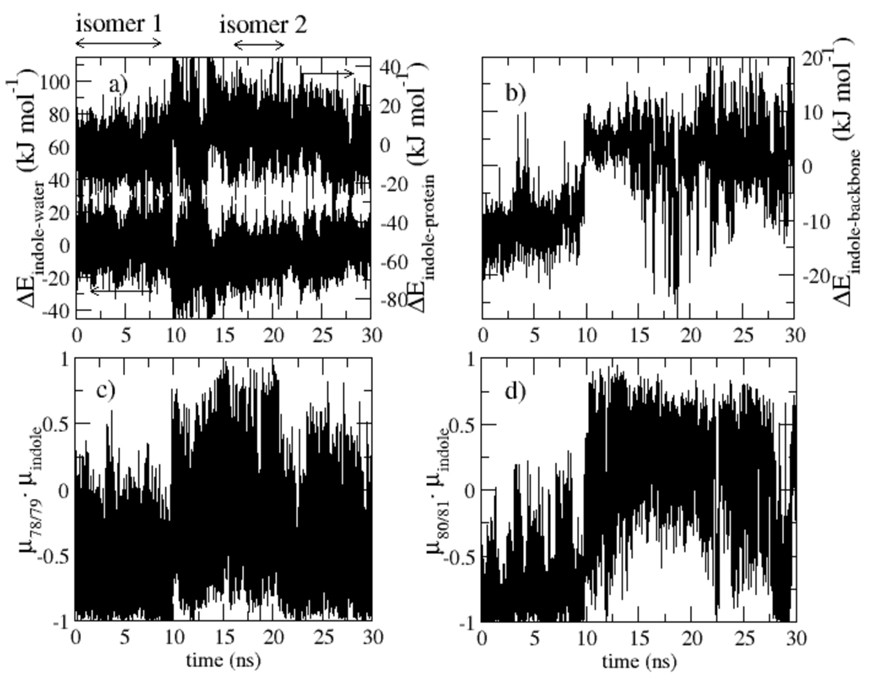
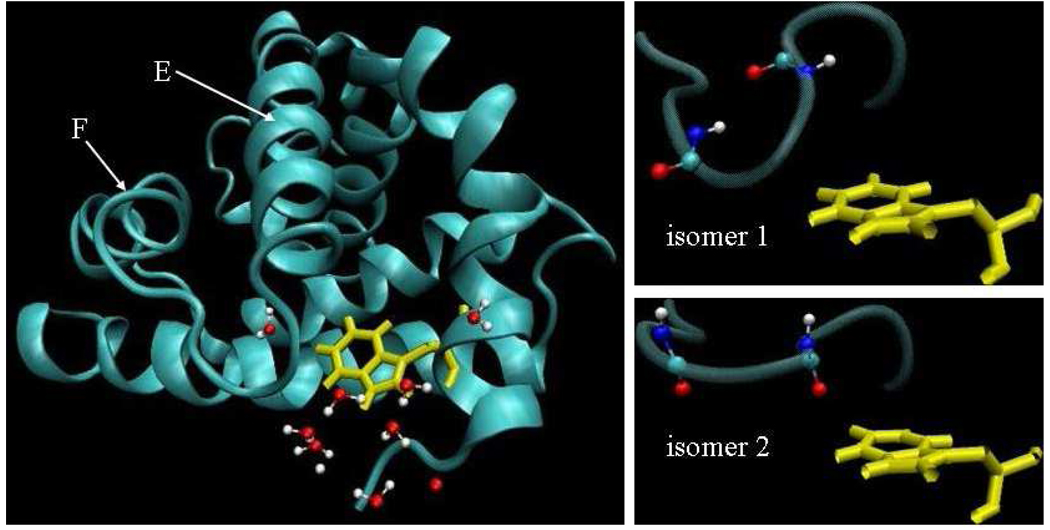
Evidence presented in Fig. 2 indicates that a structural transition occurring after 10ns in our molecular dynamics trajectory sampling the S0 state affects the S0-La energy gap. A signature of the transition appears in S0-La energy differences (Figs. 2a and b), and in structure parameters (Figs. 2c and d). Although the transition occurs on the ground state potential energy surface, it is clearly exhibited when tracking energy differences between La and S0 states, as one would calculate for the Stokes shift (section 4.1). The transition is signaled by a clear jump of roughly 20kJmol−1 in the indole-protein and indole-water La-S0 interaction energies differences (Fig. 2a). Examination of the structures before and after the transition point indicate that the structure transition at 10ns is associated with the loop region between α-helices E and F, residues 77–86, as shown in Fig. 3. The loop is closer to the indole during the first 10ns of the molecular dynamics run. After the transition, the loop residues fluctuate more, and α-helix E is more disordered near the loop. We refer to the structure of the first 10ns of our trajectory as isomer 1, and the remainder of the trajectory as isomer 2. Fig. 2b demonstrates that the jump in indole-protein energy is accounted for by the change in interaction between the indole and the protein backbone. Backbone interactions have been previously implicated in the determination of peptide conformational stability.64–67 We searched for a clear signal of the transition in the interaction between the indole and the several nearby charged residues and found none. The implications of this observation are discussed in the concluding section.
Figure 2.
Various energetic and structural features related to the indole group of tryptophan residue 7 during a 30ns trajectory in which the indole charges were that of the S0 ground state. Properties were calculated every 200fs. a) Indole-protein and indole-water interaction energy differences, upper and lower curves, respectively, between the excited La and ground state S0 potential energy surfaces. The indole-protein and indole-water energies were close to each other during the first 10ns, but are shifted and referred to different axis (note left- and right-hand scales) in the plot for clarity. b) Most of the jump of the indole-protein La-S0 interaction energy difference is accounted for by the interaction between the indole and the protein backbone between residues 77 and 86. c) Dot product of a unit vector along the dipole moment of the peptide bond between residues 78 and 79 with that of the indole group. d) Similar to previous plot for the peptide bond between residues 80 and 81.
Figure 3.
Representative snapshots of tryptophan W7 and the loop region consisting of residues 77–86 that portray the structural transition quantified in Fig. 2. On the left, the E and F helices, the tryptophan W7, and some waters of hydration are shown. The proximity of the loop joining helices E and F is evident. On the right, snapshots from the isomer 1 and 2 sub-states are shown. The atoms of the peptide bonds connecting residues 78 and 79, and 80 and 81 are explicitly shown, reflecting the shift in angles relative to W7 which is quantified in Figs. 2c and d.
In isomer 1, the backbone dipoles tend to be anti-parallel to the indole dipole. Figs. 2c and 2d depict the dot product of a unit vector along the dipole of a particular peptide bond with the unit vector along the indole group dipole. The peptide bonds joining residues 78 and 79, and 80 and 81 are considered in Figs. 2c and 2d, respectively. In both cases, the dot product is negative during the first 10ns, reflecting the anti-parallel orientation of isomer 1. After the transition to isomer 2, the dot product is either near zero or positive. The change in orientation of the backbone dipoles relative to W7 is evident in the snapshots of isomer 1 and 2 presented in Fig. 3 Our 30ns sampling does not establish whether isomer 1 is a metastable state visited before the system finally reached equilibrium after 10ns, or whether the system will fluctuate between isomers 1 and 2 indefinitely. There is a slight indication that the system is returning to isomer 1 after 30ns. Simulations an order of magnitude longer than the ones we performed might be needed to firmly establish the true status of these structures. Simulations of this length are not feasible, so instead we present relaxation dynamics calculated separately for isomer 1 and isomer 2.
If isomer 1 and isomer 2 are truly locally stable states between which myoglobin fluctuates in equilibrium, this behavior certainly has precedence in the literature. In trajectories of 1ns duration, Tournier and Smith found evidence of modes in which myoglobin that were governed by bistable potential energy surfaces, and which would lead to infrequent transitions between two configurations.59 We believe that the set of bistable modes they discovered was limited by the time scale of their simulations, and that longer simulations would have revealed still more modes with dynamics on still longer time scales. The motion leading to infrequent transitions between isomer 1 and isomer 2 is probably just one example of many such bi- or multiply-stable conformations which myoglobin accesses in equilibrium. Local sub-states of myoglobin revealed by vibrational spectroscopy of a bound CO molecule have been discussed by Frauenfelder et al.68
Fig. 2a provides evidence of a negative correlation between the protein and water interactions. There is actually a competition between water and protein to stabilize the indole chromophore. Evidence for a negative correlation between protein and water interactions has also been reported by Bandyopadhyay et al. in their simulations of the HP-36 fragment.11 Nilsson and Halle14 have explained this behavior in terms of a simple dielectric model. We have previously detailed competitive stabilization in simulation studies of the indole chromophore in the Lys-Trp-Lys tripeptide.28 Our current findings are consistent with these earlier results. Similar effects are seen below when W7 is in an excited electronic state.
4 Dynamics of flexible and frozen myoglobin following photoexcitation
In this section we report calculations of dynamical quantities, the fluorescence Stokes shift and fluorescence anisotropy, following photo-excitation. Non-equilibrium trajectories of an ensemble sampled from an equilibrium simulation of the ground S0 state are propagated on the excited La state surface. These results are also compared with a linear response theory approximation to the dynamics. The dynamics are calculated with full dynamics of myoglobin and solvent, and also with the protein frozen at the moment of photo-excitation. The purpose of the frozen protein (FP) studies is to establish how protein motion contributes the the relaxation following photo-excitation. In the FP studies, the initial ensemble of water and protein configurations is sampled from the ground state, and hence there is static disorder of the protein configurations among the non-equilibrium FP trajectories. However, there is no protein motion within each FP trajectory. Since the protein is incapable of absorbing energy during the FP trajectories, the solvent is not cooled by the frozen protein despite the name.
4.1 Fluorescence Stokes shift
An important point of comparison between experiment and theory for protein dynamics is the time-dependent fluorescence stokes shift (FSS), the energy difference between the photon absorbed upon photo-excitation and the fluorescence photon later emitted from the excited state. The Stokes shift is calculated as a double energy difference. The first difference is the energy difference of indole chromophore between excited state and ground state, which is the function of time after the photon excitation.
| (1) |
Here, Eindole,La (t) is the time dependent energy of indole in the excited La state, which can be decomposed into the gas-phase energy of the chromophore plus the interaction between La state indole and its environment. The interactions with the environment can be further decomposed into indole-protein and indole-water interactions, and . In our model, only the Coulomb interaction changes from ground to excited state. The definition of Eindole,S0 follows in the same way as the La state, but with the ground state indole charge distribution. The Stokes shift is the change in ΔEindole (t) from the instant of photo-excitation to time t, averaged over an ensemble of initial configurations sampled from the ground state potential energy surface.
| (2) |
If Δ Eindole (t) is regarded as a gas phase chromophore value modified by solvent and protein interactions, as it is in our simple model, then it should be noted that the gas phase transition energy is canceled in the second difference taken in Eq. (2). Like ΔEindole (t), ΔEStokes (t) can be decomposed into protein and water contributions by replacing ΔEindole (t) in two places on the right side of Eq. (2) by , where x can be p or w. ΔEStokes (t) can also be estimated from linear response theory.1, 70
| (3) |
Unlike Eq. (2), the average in Eq. (3) is taken over equilibrium trajectories. In the linear response approximation, the average may be taken in either the ground or excited state.70 Nilsson and Halle have emphasized recently14 that the correct formula for decomposing the linear response estimate into protein and water contributions is
| (4) |
We analyzed the Stokes shift obtained from simulations by fitting to the following functional form.
| (5) |
| (6) |
The first term describes the fast inertial response which is Gaussian within classical statistical mechanics. 1, 2, 70, 71 The first term is followed by two phenomenological exponential decay terms. The first, associated with time scale τ1, is on the order of picoseconds and describes rapid orientational response to the excited state dipole. (Actually, the non-equilibrium data was sufficiently detailed as to require two terms of this order for an adequate fit. They are labeled τ1 and τ1′ in Table 1.) The second exponential component is on the order of tens of picoseconds. The origin of the relaxation with time scale τ2 is the main focus of this work. Finally, is the infinite-time Stokes shift.
Table 1.
Stokes shift data. All energies (S∞’s and c’s) are in units of kJmol−1 and all times (τ’s) in unit of ps.
| isomer 1 | isomer 2 | ||||||||
|---|---|---|---|---|---|---|---|---|---|
| linear response | non-equilibrium | linear response | non-equilibrium | ||||||
| cg, τg | 9.9 | 0.12 | 4.0 | .018 | 12.5 | 0.13 | 2.9 | .015 | |
| c1, τ1 | 3.6 | 1.4 | 6.1 | .080 | 2.7 | 2.2 | 8.2 | .075 | |
| c1′, τ1′ | 4.9 | 1.6 | 4.7 | 1.4 | |||||
| c2, τ2 | 2.0 | 23 | 2.7 | 56.3 | 7.9 | 67 | 6.7 | 58.1 | |
| S∞ | −15.5 | −17.7 | −23.3 | −22.5 | |||||
| −4.1 | −5.3 | −14.6 | −14.3 | ||||||
| −11.4 | −12.2 | −8.7 | −8.2 | ||||||
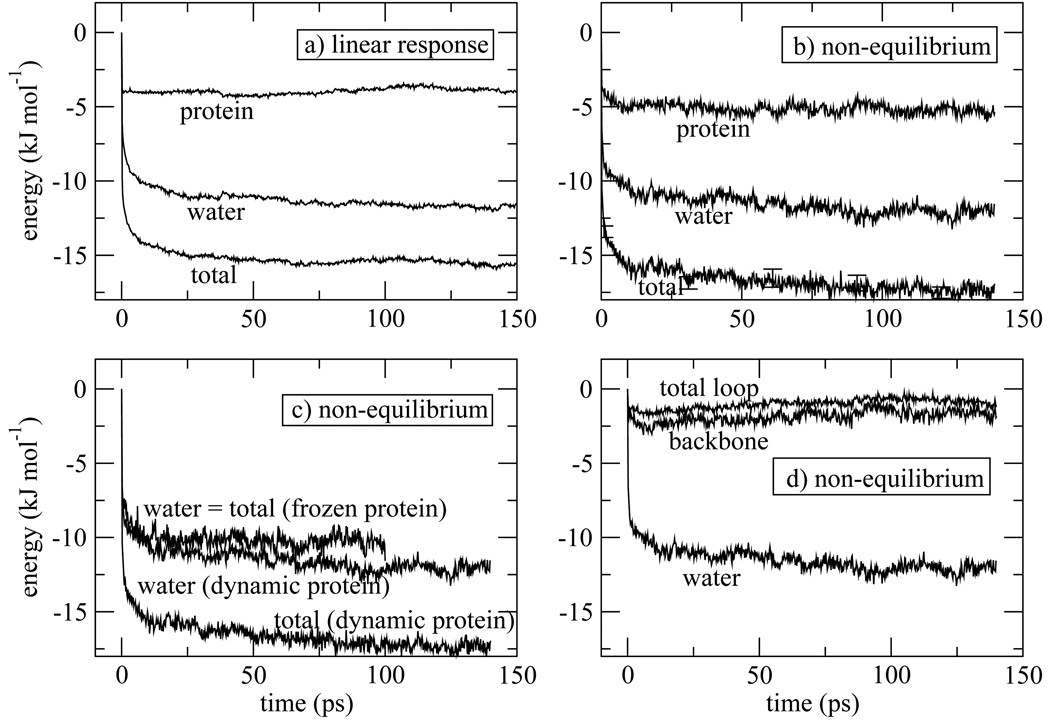
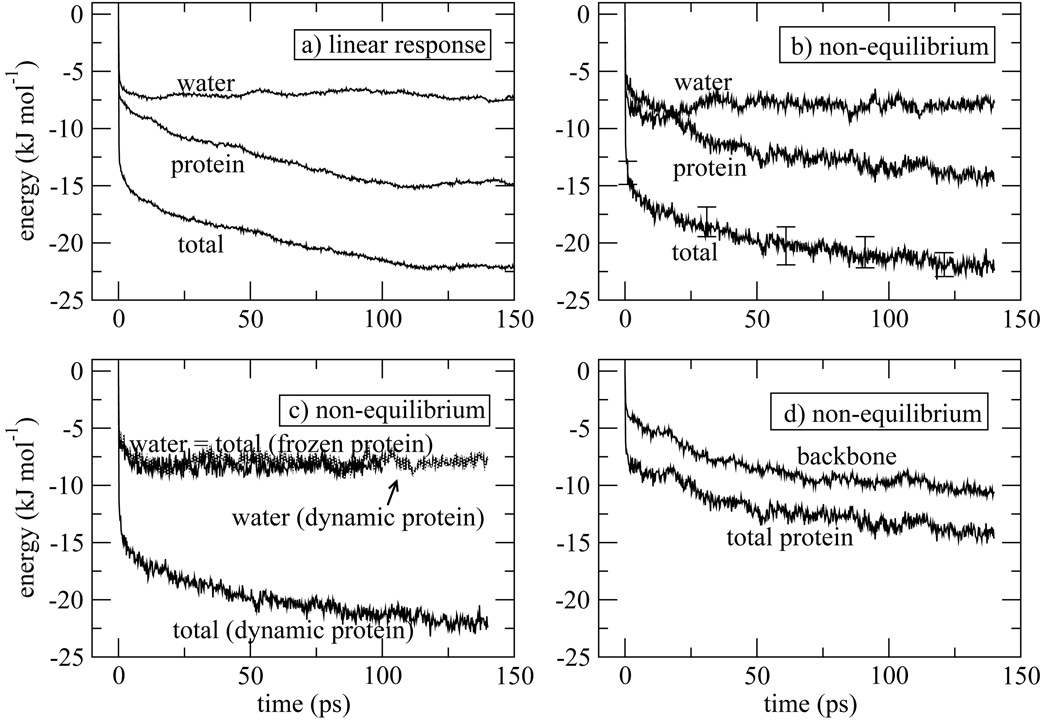
The Stokes shift calculated for isomer 1 (Fig. 4) and isomer 2 (Fig. 5) exhibit apparently different dynamics, although we will see that the underlying processes are actually quite similar. For isomer 1, the protein response shows little time-dependence beyond ~ 20ps while the water response is responsible for the slowest τ2 = 56ps component present in the overall response. These features are seen in the linear response approximation (Fig. 4a) and in the response calculated from non-equilibrium molecular dynamics trajectories (Fig. 4b). In contrast, for isomer 2 the water shows no apparent long time component, and the longest time component in the full response (τ2 = 58ps) arises from the protein contribution. Again, these features are seen in the linear response approximation (Fig. 5a) and the full non-equilibrium molecular dynamics results (Fig. 5b). The contributions from water and protein to the ultrafast inertial drop have roughly equal magnitude in isomers 1 and 2. Then the water contribution steadily increases for isomer 1, making it the majority contributor to the total Stokes shift. In contrast, it is the protein contribution that increases beyond the inertial drop in the data for isomer 2, and the protein contribution is the major contribution to the infinite-time Stokes shift for the second isomer.
Figure 4.
Fluorescence Stokes shift for isomer 1. a) Linear response theory estimate for the total Stokes shift, and the contributions from indole-water and indole-protein interactions. The time interval used to calculate the linear response correlation functions, Eqs. (3) and(4), and sampled for initial conditions of the non-equilibrium trajectories is indicated in Fig. 2a. b) Total Stokes shift, and the contributions from indole-water and indole-protein interactions calculated from 360 non-equilibrium molecular dynamics trajectories. Error bars represent one standard deviation as estimated from block averages obtained by breaking the total data set into three parts.69 c) Comparison of the Stokes shift calculated with full protein dynamics, as in (b), or from 120 trajectories propagated with the protein coordinates frozen following photo-excitation. When the protein is frozen, the water response is the total response. d) Contribution of the loop region (residues 77–86) to the Stokes shift, and the contribution that arises from the backbone atoms of the loop.
Figure 5.
Same as Fig. 4 but for isomer 2. The time interval used to calculate the the linear response correlation functions for isomer 2 and sampled for initial conditions of the non-equilibrium trajectories is indicated in Fig. 2a. 100 trajectories were used to calculate non-equilibrium response with full protein dynamics, and 200 trajectories with the protein frozen. In panel (d), the protein backbone response is compared with the total protein response, indicating that backbone dynamics dominates the protein response.
Despite the seeming divergence in the dynamics of isomer 1 and 2, we will show that the underlying processes in the two cases are very similar. The fact that the protein response in isomer 1 and water response in isomer 2 appear flat at long times is the result of fortuitous cancellations. (We believe that the long time protein response for isomer 1 and water response for isomer 2 are close to flat, and there is no theoretical reason why they would be exactly flat.) In fact, similar coupled water-protein dynamics is occurring on the time scale of τ2 in both cases. Freezing the protein dynamics eliminates this coupled motion and removes the slow time component from the dynamics. Hence, the slow dynamics arises from coupled water-protein dynamics, and is not an intrinsic feature of water in the potential field of the protein. We now discuss specific features of the data.
As can be seen from Fig. 4 and Fig.5, for this system the linear response approximation (panel a) in this system, evaluated using the ground state trajectory that gave rise to the data in Fig. 2, provides a qualitatively correct picture of the relaxation dynamics following photo-excitation for both isomers, although there are statistical errors. The linear response approximation appears particularly good for isomer 2 because the slope of the Stokes shift curve and weight of the slow component are relatively large. Hence statistical errors in the linear response Stokes shift are masked. These statistical errors arise because there are limited regions of time, 9 and 15ns for isomer 1 and 2, respectively, indicated at the top of in Fig. 2a, which we can designate the system as clearly being in either isomer 1 or isomer 2. Hence there is a limited time over which we can accumulate linear response correlation functions, Eqs. (3) and (4). Even though less time was available for isomer 2, as mentioned above the larger slope made it less problematic than isomer 1. For isomer 1, the slopes of the total Stokes shift, and the individual protein and water contributions, are all rather small. Even though the magnitudes and general shape of the linear response curves match the non-equilibrium calculation, the slopes are so small that the linear response result is obscured by statistical error. The linear response weights and time constants for isomer 1 reported in Table 1 are not meaningful.
Despite apparently different dynamics with respect to their protein and water contributions to the Stokes shift, freezing both isomers 1 and isomer 2 at the instant of photo-excitation removes all long time dynamics (panel (c) of Fig. 4 and Fig.5). Therefore, for the case of W7 in myoglobin, protein motion is essential for observation of slow dynamics of the Stokes shift, and the latter is not an inherent feature of water trapped in a strong interaction potential emanating from the protein. Of course, when protein motion is said to be required, it is always understood that the protein is solvated and moves in a bath of water molecules. It has been well established that cooperative water motion, especially translational motion, accompanies protein motion beyond harmonic fluctuations.15–17, 72–74 Even though long time correlations are present in the hydration layer, as reported by others and as analyzed in section 5, inherently slow water motion, and in particular, slow rotational motion, in the absence of protein motion does not lead to the long-time component in the Stokes shift for W7 of myoglobin.
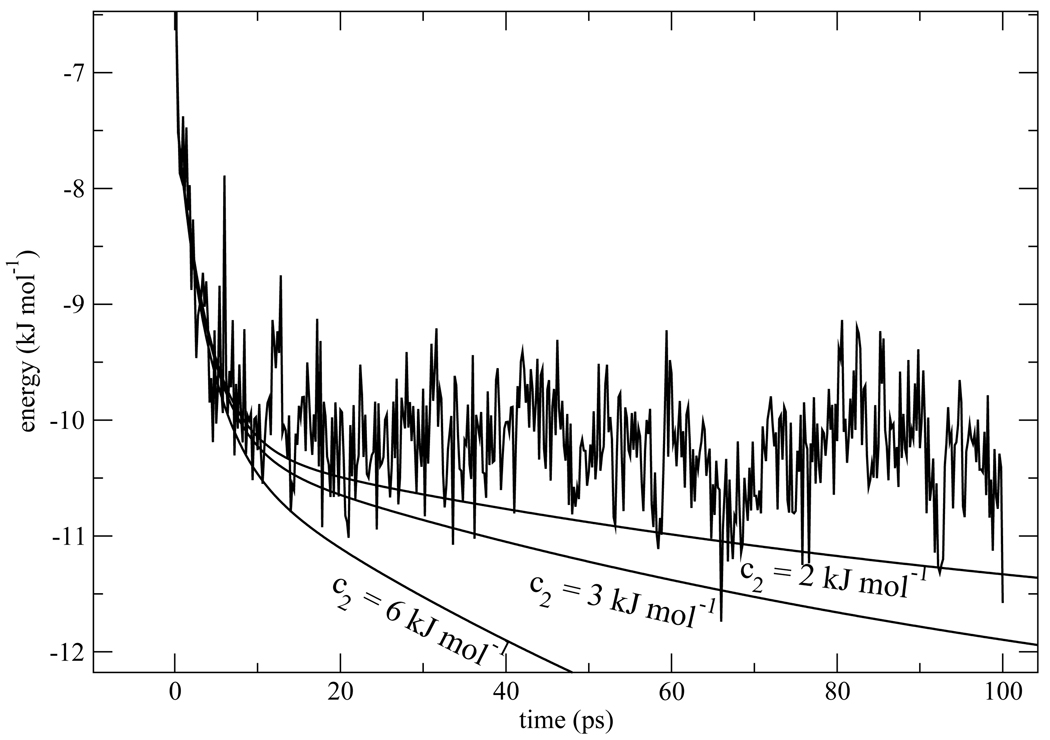
One may legitimately ask whether freezing the protein makes the water slower, and as a result the slow component is not visible when the non-equilibrium trajectories are carried out to only 100ps. In section 5 we find that water residence times increase by a factor of 1.8–1.9 when the protein is frozen. Since exchange of waters between the hydration layer and the bulk sets the time scale for solvent response in the Nandi-Bagchi-Zewail model, if their mechanism was operative we might expect a slow component of τ2 ≈ 120ps instead of 56 or 58ps, as found for isomers 1 and 2 respectively in Table 1. In Fig. 6 we explore the effects of having a very slow component c2e−t/τ2 present in the Stokes shift for the frozen protein simulations. We examined the analytic fit to the Stokes shift of isomer 1 and doubled the value of τ2 to 120ps. The contribution of the slow component for isomer 1 in the flexible protein case was c2 = 2.4kJmol−1. We considered the possibility that this component was present in the frozen protein simulations but with a time constant increased by a factor close to 2. We examined values of c2 equal to 2 and 3kJmol−1, which bracket this value, in Fig. 6. From Fig. 6, we see that the presence of a slow component with τ2 = 120ps would be clearly visible. In the flexible protein simulations for isomer 2 the weight of the slow component is 6.5kJmol−1. Therefore, we also considered c2 = 6kJmol−1 in Fig. 6. If a slow component with this weight was present in the frozen protein simulations, it would be quite obvious.
Figure 6.
The actual Stokes shift calculated from non-equilibrium trajectories for isomer 1 with the protein frozen at the moment of photo-excitation is compared with curves that contain a slow component c2e−t/τ2 where τ2 = 120ps. Several different values of c2 are explored: c2 = 2, 3 and 6kJmol−1.
For the FP dynamics of both isomer 1 and 2, the total response, which is the response of the water, only has a Gaussian inertial feature and a 2–4ps time component. It is significant that this qualitative feature of the dynamics occurs whether the protein response has no apparent slow component, as for isomer 1, or whether it exhibits a slow component, as for isomer 2. Hence, the presence or absence of a slow component in the protein response is not a signal that the slow dynamics of the total Stokes shift requires protein motion. The frozen protein test is a more reliable indicator. We also note that the magnitude of the water contribution to the total Stokes shift depends very little on whether the protein is frozen or not. Therefore, water in the hydration shell surrounding the protein is equally able to respond to the charge redistribution of the chromophore with and without protein flexibility.
Many locations on the protein respond to the charge redistribution following photo-excitation. Beyond the inertial component, many of these responses cancel each other, as discussed below. In isomer 2, the interaction of the chromophore with the protein backbone of the loop joining helices E and F does not cancel with any other interactions, and characterizes the overall protein response. The carbonyl and amide groups of the backbone carry substantial dipole moments, about 3.5 Debye in the force field we are using. The loop joining helices E and F containing residues 77–86 is more flexible in isomer 2 than in isomer 1. In Fig. 5d, it is shown that the overall protein response past the inertial component largely arises from the interaction of backbone dipoles of this loop with the chromophore. In isomer 1, there is indeed some response from backbone (Fig. 4d). However, the loop is less flexible in isomer 1 and the response is smaller. Fig. 4d and Fig.5d show that even though the loop contains charged residues, their contribution to the long time Stokes shift is minor, and the overall response after a few picoseconds is that of the backbone dipoles.
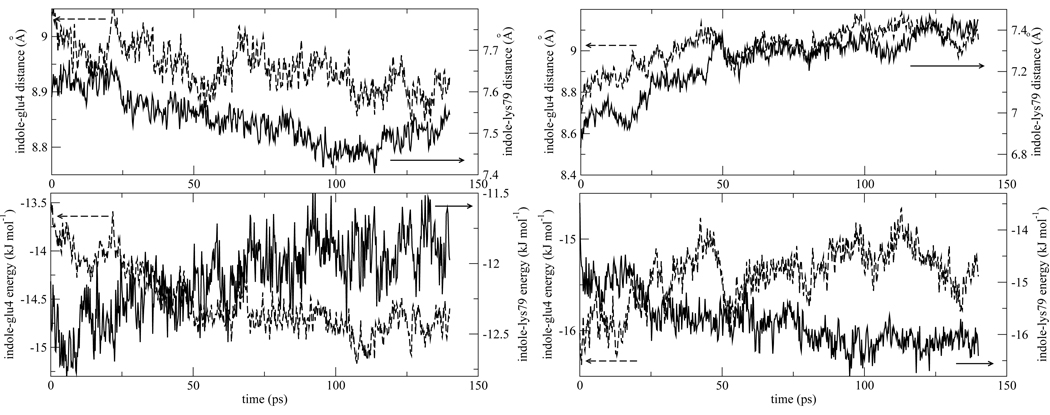
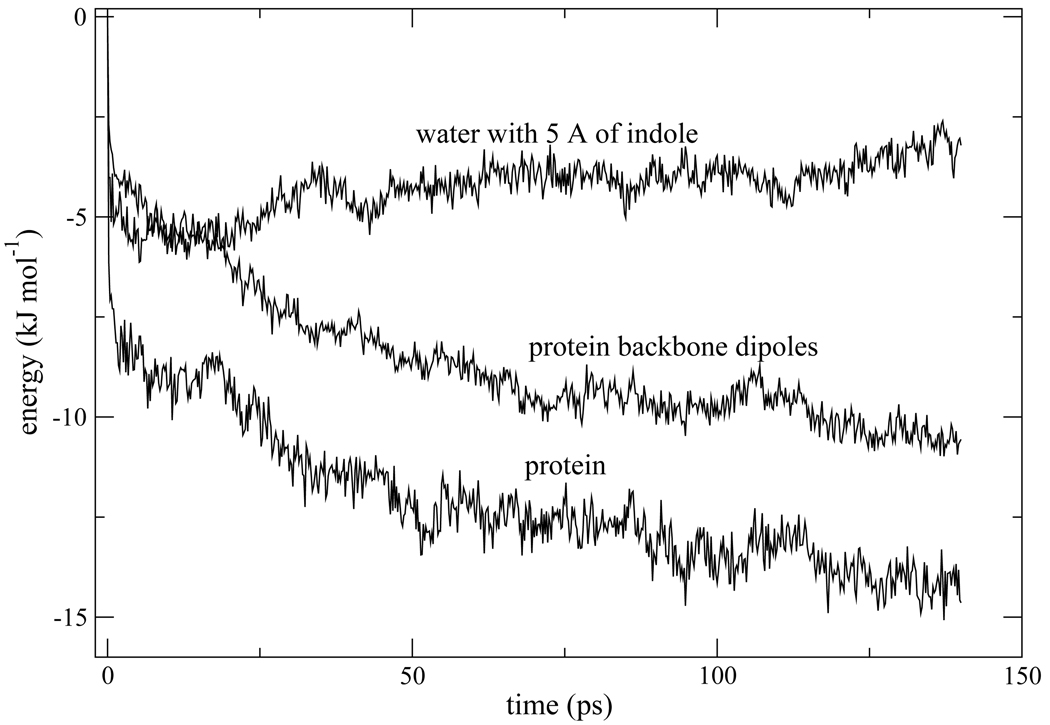
An examples of canceling interactions for both isomer 1 and 2 is shown in Fig. 7. Lys79 and Glu4 are nearby charged residues. Following photo-excitation, they both become closer to the indole chromophore in isomer 1, and farther from the chromophore in isomer 2. While their spatial response is similar, these positively and negatively charged group contribute oppositely to the stabilization of the chromophore. As seen in Fig. 7, when one interaction becomes more favorable, the other becomes less favorable. Hence their contributions roughly cancel. Besides showing how cancellations arise, this example is important because it demonstrates that protein dynamics on the ~ 60ps time scale occurs for both isomer 1 and 2, despite the fact that the total protein response on this time scale (panel b of Fig. 4 and Fig. 5) is flat at long times for isomer 1, but the major contributor to the overall long time dynamics for isomer 2. Fig. 8 furnishes another example of coupled water-protein dynamics occurring on a ~ 60ps time scale for isomer 2, even though the overall water response appears flat in this time range in Fig. 5b. Solvation by the hydration layer surrounding the indole chromophore is seen in Fig. 8 to overshoot its eventual asymptotic value. Water and protein tend to compete to stabilize the chromophore.11, 14, 28 Hence, it is expected that water solvation in the hydration layer surrounding the indole moves opposite to protein stabilization in Fig. 8.
Figure 7.
Top panels: Time evolution of the distance of two nearby charged residues, Lys79 and Glu4, the indole chromophore in isomer 1 (left) and isomer 2 (right) following photo-excitation. Distances are measured from the center of mass of the indole chromophore to the center of masses of the side chain amino and carboxylic acid groups of the lysine and glutamic acid, respectively. In isomer 1 the distance both become smaller, while in isomer 2 they become larger. Bottom panels: The energetic response of the positively and negatively charged residues shows opposite trends for both isomer 1 and 2, and they roughly cancel. For comparison with data in Fig. 4 and Fig.5 the interaction energy difference between La and S0 states are plotted in the bottom panels.
Figure 8.
Interaction energy of the indole chromophore with water within 5Å of the indole, backbone dipoles of the loop connecting helices E and F, and the interaction with the total protein. The average was accumulated for non-equilibrium trajectories sampled for isomer 2.
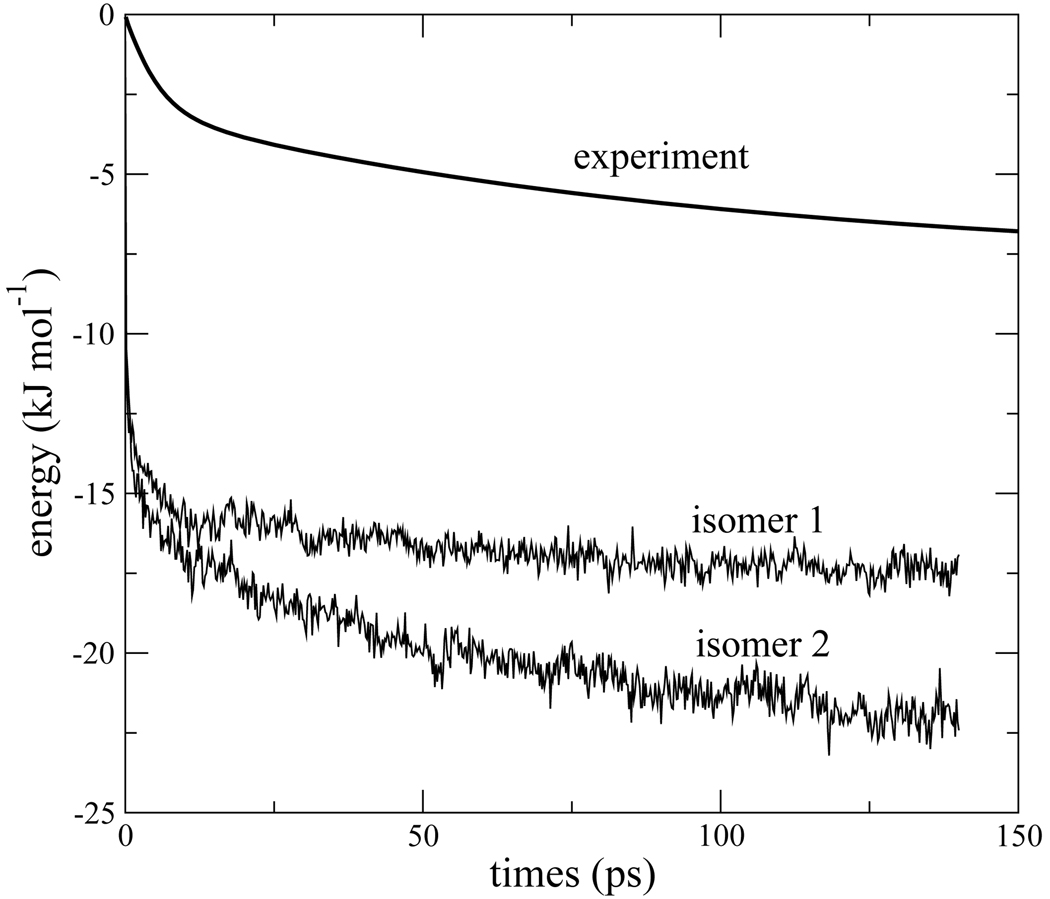
The calculated and experimental21 Stokes shifts, compared in Fig. 9, are in qualitative agreement at long times, especially for isomer 2. However, there exists a sharp disagreement concerning the sub-picosecond, ultrafast behavior. Evidently, either the calculations insert an inertial drop of ~ −20kJmol−1 that should not be present, or the experiments miss it. At this point we have not established the origin of the disagreement. It is conceivable that some ultrafast solvation is missed either because of limited experimental time resolution or the estimation of the zero-time Stokes shift. It is also possible that the theoretical model is lacking some essential features. The focus of this work is the long time behavior of the Stokes shift, which seems to be qualitatively reproduced by our simple model.
Figure 9.
Comparison of calculated and experimental Stokes shift.
4.2 Fluorescence anisotropy
The fluorescence anisotropy provides information on the rotational dynamics of the chromophore following photo-excitation. The anisotropy is calculated according to the following expression.76
| (7) |
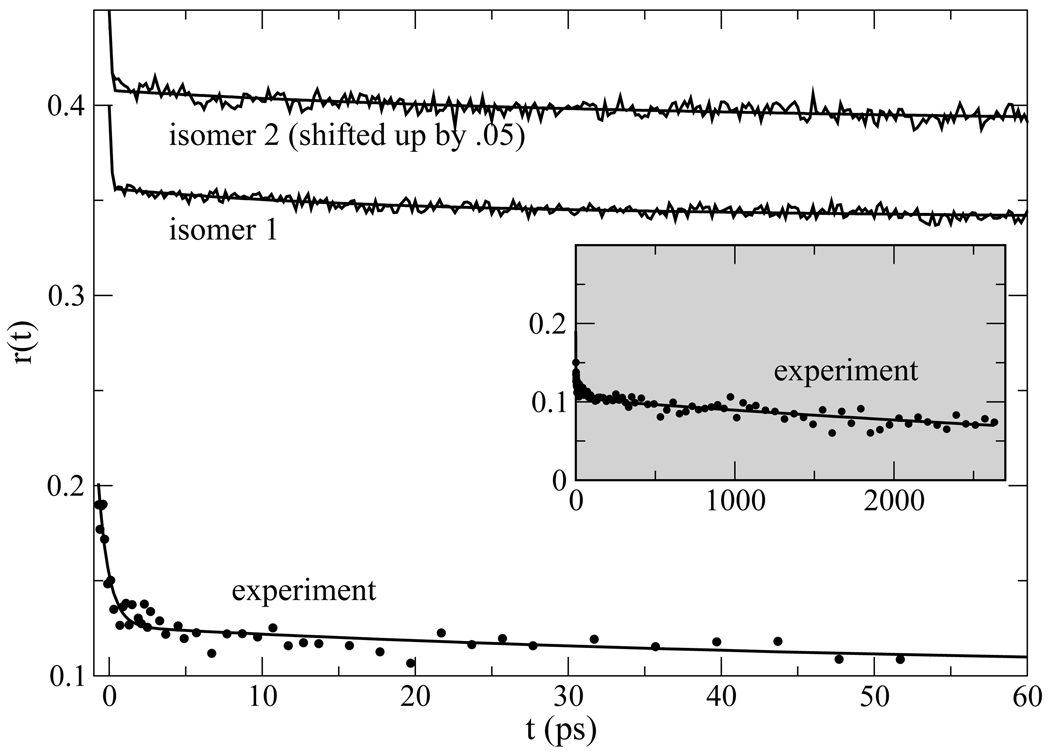
Here, μ(t) is time dependent dipole of the indole chromophore after photon excitation. The brackets represents the ensemble averaging over initial conditions after excitation, as described by 360 non-equilibrium trajectories. The anisotropy r(t) can be fitted by one Gaussian and two exponentials,
| (8) |
where cg + c1 + c2 = 0.4. The parameters cg, τg, c1, τ1 and c2 are determined from the non-equilibrium trajectories for isomer 1 and 2. In Fig. 10 the fits are compared with simulation data. The length of those trajectories does not permit an accurate determination of the longest time component. However, we ascribe that longest component to the overall protein tumbling motion which we can extract from the long ground state simulations, from which we determine τ2. Our calculated value of τ2 = 5.8–5.9ns is in reasonable agreement with previously reported values of 6.43–6.56ns,77 5ns78 7–9ns,,56 and 6.6ns recently measured75 for native apomyoglobin from a variety of species. Since the anisotropy decay at this scale is controlled by the shape of the protein globule and the viscosity of water, agreement of the long time constant between simulation and experiment is a good indicator that GROMACS96 force field and SPC/E water model gives us reasonable description of the protein shape and solvent viscosity.
Figure 10.
Anisotropy [Eq. (7)] calculated from non-equilibrium molecular dynamics simulations and from experiment.75 Least-squared fits are shown in addition to the simulation and experimental data. The parameters extracted from the fit to simulation data are given in Table 2. The long-time behavior of the experimental data, characterized by a time constant of 6.6ns, is shown in the inset.
The simulation results are dominated by the overall rotation component, and to a lesser extent the inertial regime, the longest and shortest components. The 15ps (isomer 1) and 25ps (isomer 2) components that reflect the local wobbling of the indole within the protein have very small weights. The fact that the second component has such small weight indicates that the local structure around Trp7 is rather rigid, and the amplitude of indole wobbling is small. Unlike the simulation results, the experimentally measured anisotropy does not have an initial value of 0.4, and the overall amplitude of the experiments cannot be compared with theory because the rapid internal conversion between La and Lb during the first ~ 100fs following photoexcitation.79, 80 It is only valid to compare the experimental and theoretical time scales. The long component of the experimental results75 has a time scale of 6.6ns, in good agreement with the simulations and in rough agreement with previous measurements.56, 78 The early behavior of r(t) from experiments is dominated by the Lb → La relaxation dynamics and cannot be used to extract shorter time scale dynamics for comparison with theory.
5 Residence, diffusion and reorientation of water in the hydration shell
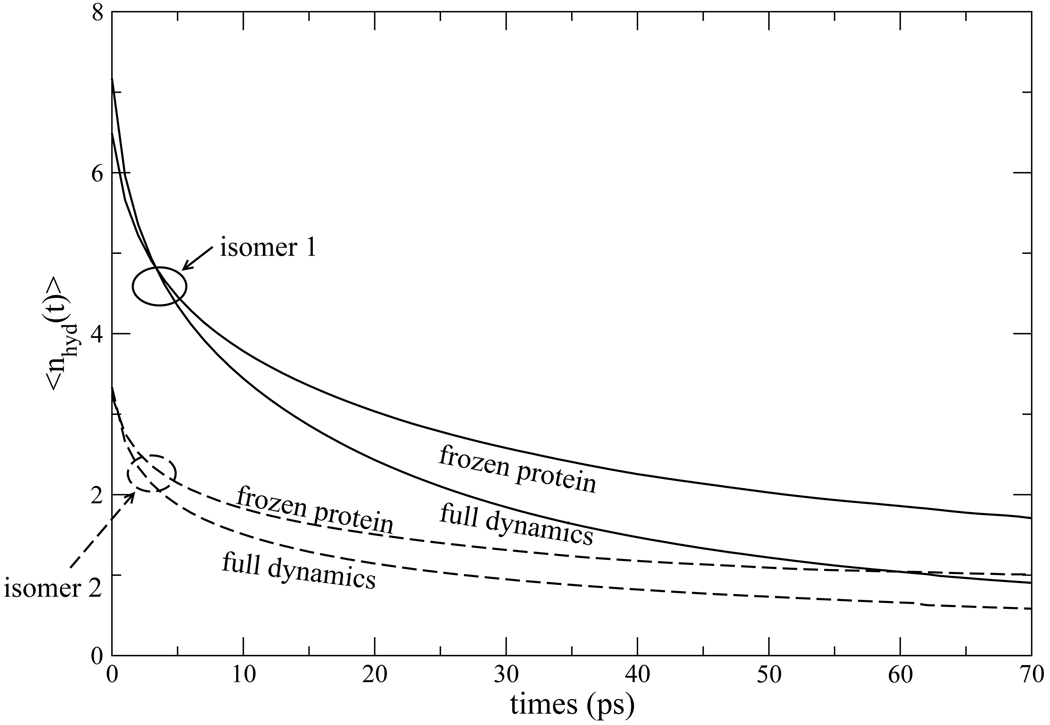
We calculated residence time correlation functions for water molecules with 5Å of Trp7 in a manner proposed by Brunne et al.,81 and applied by Makarov et al.55 to myoglobin. The residence time correlation function 〈nhyd (t)〉 is the average number of waters at time t0 + t that were continuously present in the hydration shell since time t0. As pointed out by Brunne et al.,81 the words “continuously present” must be quantified by the frequency with which the waters were monitored to determine whether they were still in the hydration later. It is always conceivable that some water molecules might have strayed outside the hydration layer between times at which distances from the proteins were calculated. We used a time interval of 1ps for assessing distances of waters from Trp7. The data was sampled from the last 110ps of 140ps trajectories in the excited La state following photoexcitation. In the frozen protein trajectories, all relaxation has concluded by this point, and the residence time correlation functions of Fig. 11 represent equilibrium in the excited La state. During this same time period, a residual portion of the slow protein dynamics is still occurring during the 110ps over which the data of Fig. 11 is accumulated. In the non-frozen case, the residence times represent an average over this phase of the motion in which the protein, and water coupled to it, are slowly relaxing. We do not anticipate that this slow relaxation has a significant effect on residence time dynamics.
Figure 11.
Residence time correlation function for waters within 5Å of Trp7 in the excited La electronic state for isomer 1 (solid curves) and isomer 2 (dashed curves). The correlation functions for frozen protein simulations lie above those with full dynamics.
From the initial value of 〈nhyd (t)〉 at time shown in Fig. 11, there are, on average, almost 7 waters in the hydration shell of Trp7 in isomer 1, and about 3 waters for isomer 2. As discussed below, this difference arises because our criterion for membership in the hydration shell, a distance of 5Å or less from the protein, happens to include a few labile waters in the case of isomer 1. As found by Makarov et al.,55 a sum of several exponentials are needed to fit 〈nhyd (t)〉. We found that a double exponential fit was accurate, and the residence times we report are the time constant for the slower component. Isomer 1 exhibits a faster turnover of water molecules, with a residence time of 45ps compared to the residence time 67ps of isomer 2. In part, this reflects the larger number of waters for isomer 1 within the 5Å envelope we use to define the hydration shell. These extra waters are more labile. The numbers of waters still in residence after 100ps is similar, much closer than the initial values, for isomers 1 and 2.
While isomer 1 can “shake off” the extra labile waters when it is not frozen, it is significant that the frozen and full dynamics plots of 〈nhyd (t)〉 in Fig. 11 run approximately parallel to each other for both isomer 1 and 2. Fixing the protein coordinates at the moment of photo-excitation makes some difference in the exchange of labile waters on a time scale of ≲ 10ps, but makes less difference in the longer time scale dynamics that sets the residence time. For both isomer 1 and 2, the residence time of water in the hydration layer of the unconstrained is roughly 1.8 times shorter than that of the frozen protein. In the Nandi-Bagchi-Zewail model the residence time sets the time scale for the slow component of the Stokes shift. Therefore, it is important to verify, as we have done here, that the dynamics of water exchange between the protein hydration layer and bulk water is not so strongly affected by freezing the protein that it would eliminate this mechanism. In section 4.1, we have already explored the possible effect of a longer residence time on the Stokes shift if the residence time did indeed coincide with the slow component of the Stokes shift.
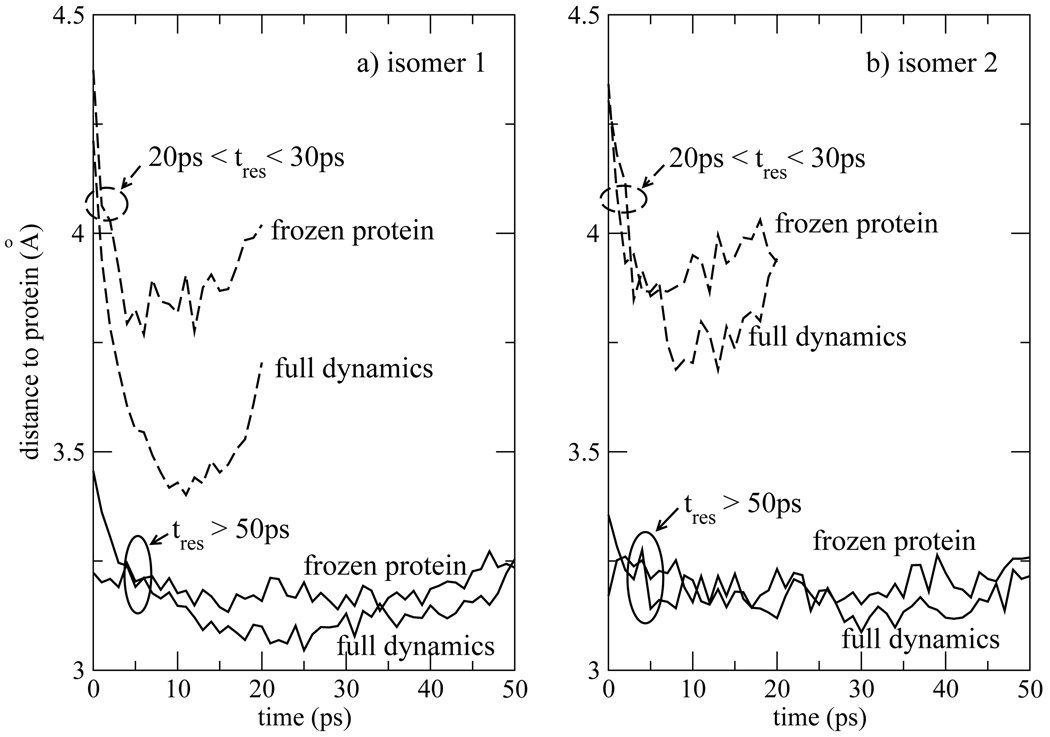
In general, longer residence time of waters of hydration correlates with close proximity to the protein. The subset of waters with residence times 20ps < tres < 30ps are further away from the protein than those of the tres > 50ps group. This is quantified in Fig. 12, where the the average distance from water molecules in the hydration shell to the closest atom of the protein is shown. The average distance is plotted as a function of time elapsed from entry into the hydration layer in Fig. 12. The curves have a characteristic minimum near the midpoint, most pronounced for the 20ps < tres < 30ps group. For this group, t = 0ps in Fig. 12 corresponds to entry into the hydration layer and t = 30ps correspond to the exit from the hydration layer. Therefore, the initial drop of the average distance following by a rise near 20ps reflects that all waters within this group are on trajectories crossing into the hydration layer at t = 0ps, and recrossing the same boundary within the next 20 to 30ps. The t > 50ps group was accumulated in a different manner. Since it contains waters that were resident in the hydration layer at the start of taking data, this behavior is not as pronounced for this group.
Figure 12.
Average closest distance from the protein accumulated among waters within 5Å of the indole chromophore for a) isomer 1 and b) isomer 2. The average distance is collected as a function of time elapsed since entry into the hydration shell among two sets of waters within the hydration shell, those that have a total time of residence (tres) between 20ps and 30ps (dashed curves), and those that stayed within the hydration shell for a time longer than 50ps (solid curves).
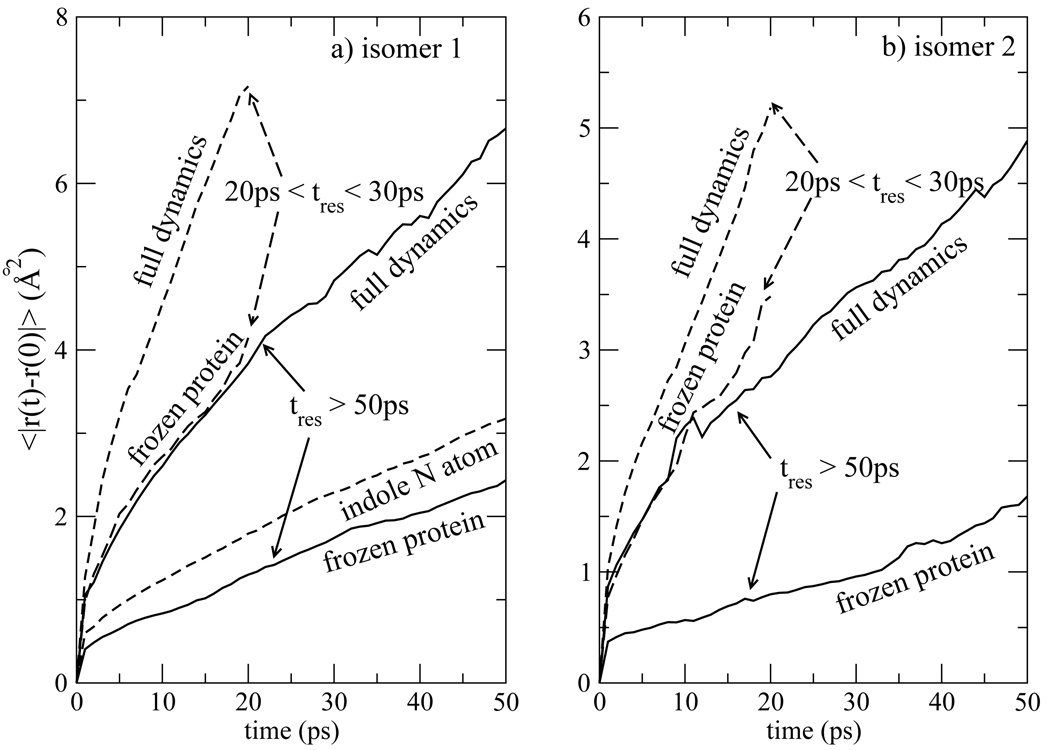
The average squared displacement of water molecules within the hydration layer is analyzed in Fig. 13. It can be seen that waters with short residence time, those shown to be further from the protein in Fig. 12, are the ones with the largest rate of diffusion within the hydration layer. These curves in Fig. 13 for this population indicate that their diffusion constant is about one order of magnitude smaller than that of bulk water molecules. Even waters with long residence times, the tres > 50ps group, exhibit diffusion within the layer. The difference between frozen and flexible protein is most significant for these long-residence time waters within the first few picoseconds, reflecting a difference in the way waters settle into their niches next to a frozen or flexible protein. However, after ~ 10ps, the slopes of the squared displacement curves for waters near frozen and flexible protein remain distinct, indicating that lateral diffusion of water in the hydration layer is enhanced by protein flexibility.
Figure 13.
Average squared displacement of waters from their initial position accumulated among waters within 5Å of the indole chromophore for a) isomer 1 and b) isomer 2. The average distance is collected among two sets of waters within the hydration shell, those that have a total time of residence (tres) between 20ps and 30ps (dashed curves), and those that stayed within the hydration shell for a time longer than 50ps (solid curves). The reported distance is an average of |r(t0 +t)− r(t0)| over all initial times t0 consistent with the residence time restrictions and water molecules within the hydration shell of Trp7.
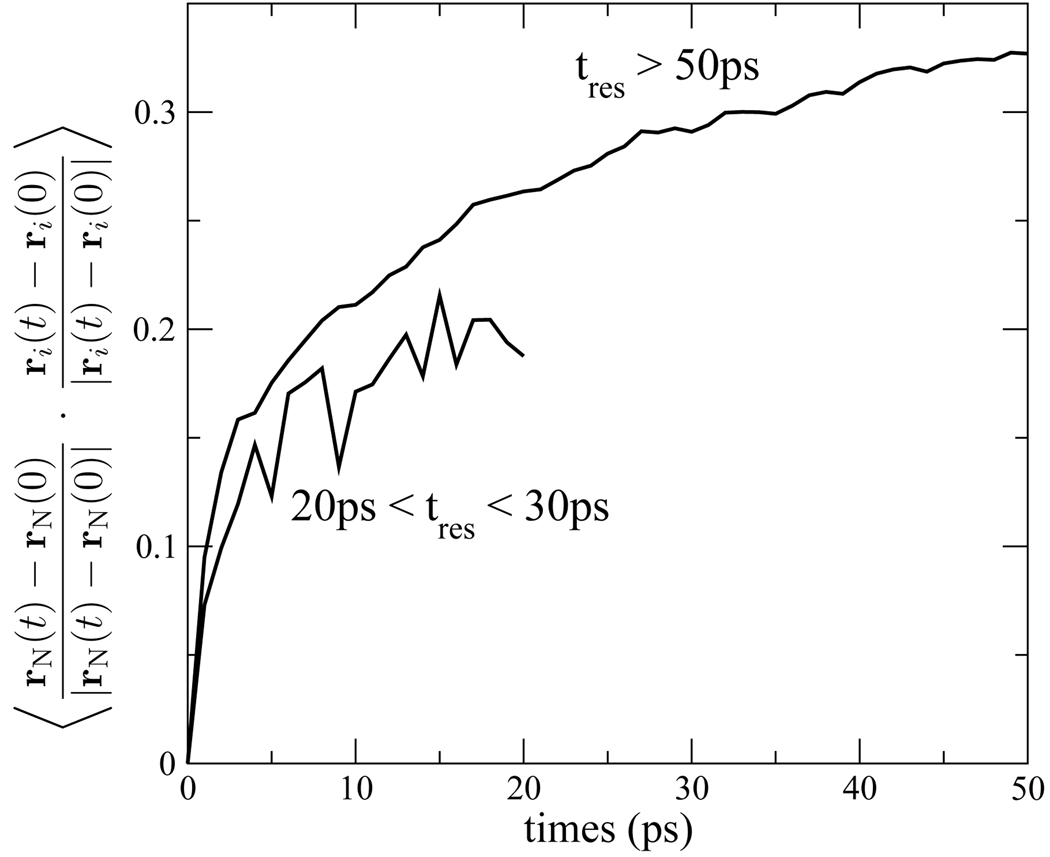
Pizzitutti et al.82 have also noted that diffusion of water is slower near a frozen protein. The origin of this effect is suggested in Fig. 13a, where the mean squared displacement of the nitrogen atom of the indole group is plotted for isomer 1. The magnitude of the indole mean squared displacement is comparable to the difference between the water mean squared displacements near frozen and unfrozen protein. This is suggestive that the water and indole side chain are fluctuating in concert, and that water is more mobile near flexible protein because it is trapped near a moving surface. This is confirmed in Fig. 14 where the displacement cross-correlation of indole and its waters of solvation are plotted. The cross-correlation is positive for both the tightly bound waters with residence time tres > 50ps and the more labile waters with 20ps < tres < 30ps, indicating that the locking of water and side group translations extends to at least 5Å into the solvent. Pizzitutti et al. ascribe the difference in water diffusion near frozen and unfrozen protein to water jumps into sites previously occupied by protein groups, a mechanism which is blocked when the protein is frozen. While not necessarily in opposition to this explanation, we regard the difference in diffusion near frozen and unfrozen protein as a manifestation of the general phenomena that lead to friction in a fluid and at interfaces. Diffusion is slow at the protein surface for the same reason that hydrodynamic stick (non-slip) boundary conditions arise near either a stationary or moving surface.
Figure 14.
Cross-correlation of the normalized displacements of the indole nitrogen atom with those of the waters hydrating the indole group. The correlation is accumulated separately for waters with residence times 20ps < tres < 30ps and tres > 50.
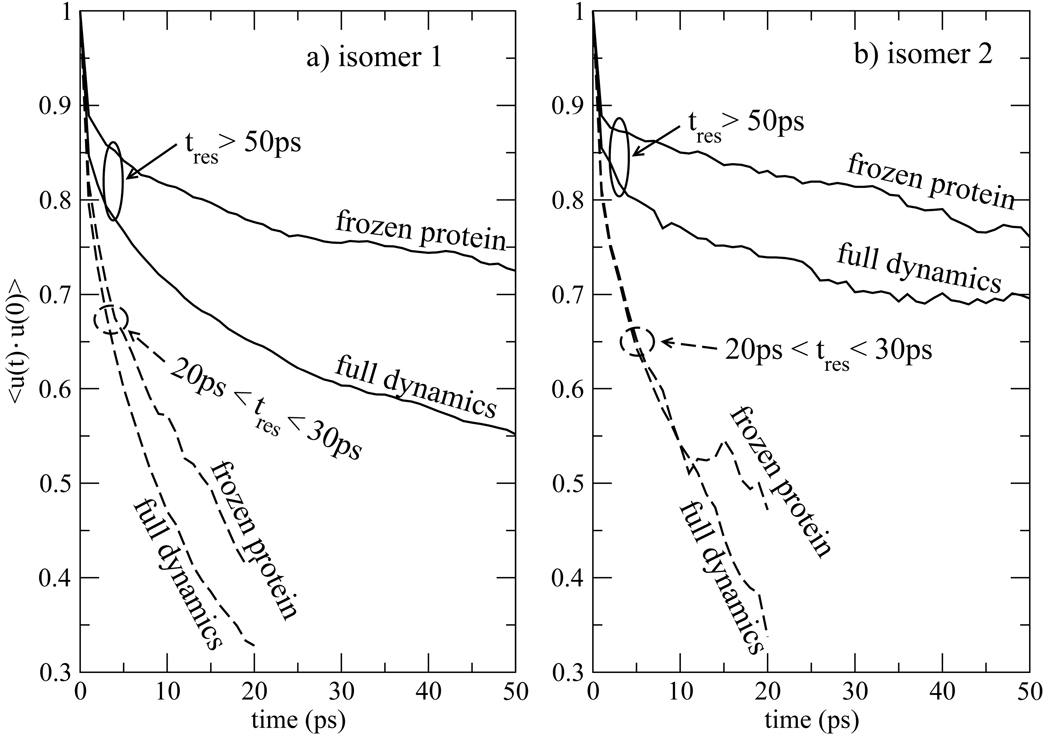
We next turn to analyze 〈u(t) · u(0) 〉, the single molecule orientational correlation function among water molecules within the hydration shell of the indole chromophore. Here u is a unit vector along the symmetry axis of a water molecule. This correlation function is shown for isomers 1 and 2 in Fig. 15. To distinguish the behavior of waters with short and longer residence times, we separately accumulate two groups, those with residence times tres between 20 and 30ps, and those with residence times greater than 50ps. Water molecules were included in the population with residence times between 20 and 30ps only when they entered the hydration layer. Molecules that were already present in the hydration layer at the start of taking data were not included in this sample, since these waters could have been long-lived waters. The same restriction was not applied to the population of waters with residence times greater than 50ps.
Figure 15.
Single-molecule orientational correlation function accumulated among waters within 5Å of the indole chromophore for a) isomer 1 and b) isomer 2. The correlation function is collected among two sets of waters within the hydration shell, those that have a total time of residence (tres) between 20ps and 30ps (dashed curves), and those that stayed within the hydration shell for a time longer than 50ps (solid curves). The reported correlation function is an average of u(t0 +t) ·u(t0) over all initial times t0 consistent with the residence time restrictions and water molecules within the hydration shell of Trp7.
It is essential that 〈u(t) ·u(0) 〉 be accumulated for populations with similar residence times. If this correlation function was constructed among all water molecules that survive in the hydration layer for a time t, then it would interrogate different sub-populations at different times. At long times 〈u(t) ·u(0)〉 would only sample tightly bound waters which, as confirmed by the tres > 50 curves in Fig. 15, is a population with a relatively large value of u(t) ·u(0). However, if all waters in the hydration layer were included at earlier times, the population of tightly bound waters just mentioned would be mixed with a group of labile waters for which u(t) ·u(0) is much smaller. As a result, accumulating 〈u(t) · u(0)〉 over all waters that survive to a time t gives correlation functions with a characteristic minimum. The correlation function decreases as the more labile waters reorient, but then starts to increase because the surviving waters comprise a tightly bound population. This feature, present when the waters are not sorted according to residence time, would be misleading because it does not signify a re-focusing of water molecules to their orientation at time t = 0. Hence, the data in Fig. 15 is sorted by residence time.
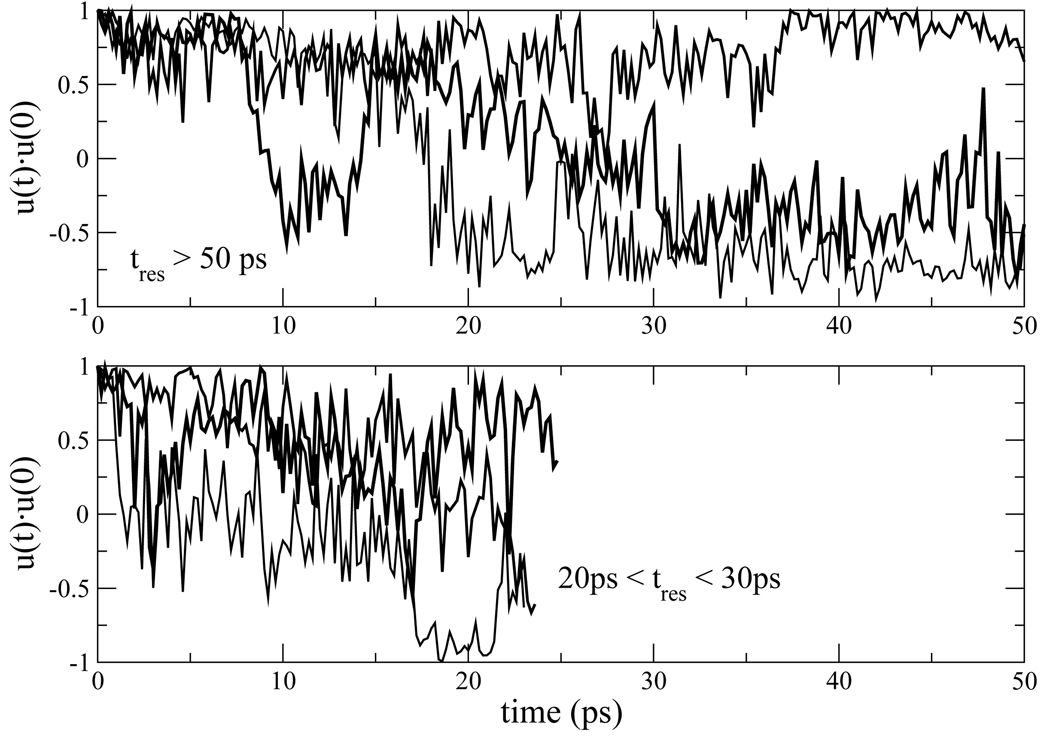
The data presented in Fig. 12– Fig. 15 confirms the existence of a sub-population of tightly bound waters close to protein atoms in the hydration layer. Other molecules within a hydration layer defined by the 5Å distance criterion, reorient more freely, although the correlation function 〈u(t) · u(0)〉 among this group decays much slower than for bulk water. For the 20ps < tres < 30ps group, the average value of u(t) · u(0) reflects a 60° rotation of the water symmetry axis from its initial value within 10ps. It is not surprising that the relaxation of water molecules in response to a charge redistribution on the chromophore is complete within this time scale. However, even the t > 50ps group in Fig. 15 undergoes substantial reorientation within a short time period. Within 1ps, 〈u(t) · u(0)〉 decays to ~ 0.9 for the frozen protein case, reflecting a 25° rotation of u from its initial value. Therefore, even though this population is tightly bound, it is still capable of solvating a chromophore without leaving the hydration layer. When the protein is flexible, 〈u(t) · u(0)〉 for the tres > 50ps population decays to ~ 0.8 within a picosecond, indicative of a 37° average rotation, because of additional reorientation mechanisms available when the protein is flexible that are discussed below. The rotational mobility of waters near the protein is evident in the behavior of u(t) ·u(0) plotted for several water in Fig. 16. It is not unusual for waters with the longest residence times to tip more than 90° from their original orientation within a few picoseconds.
Figure 16.
u(t) · u(0) is shown for several waters in the hydration layer near the indole group of W7. The top panel is taken from three trajectories from the tightly bound subset with residence time tres > 50ps. The bottom panel exhibits three trajectories for waters with residence time 20ps < tres < 30ps.
On the way to a value of zero, 〈u(t) ·u(0)〉 exhibits two different time scales in the correlation functions we have accumulated, and would expect more if the averages were extended to longer times. All of the correlation functions shown in Fig. 15 were fit to a linear combination of two exponential functions. The population of water molecules available to construct 〈u(t) · u(0)〉 was limited, so the precision of time constants deduced from the data is not high. All of the curves in Fig. 15 contain a fast component with a characteristic time of ~ 1–2ps. The 20ps < tres < 30ps population, for both full dynamics and frozen protein, exhibited a slower component with a time constant of ~ 20–30ps (except for frozen isomer 2 for which the data did not justify a biexponential fit). The tres > 50ps populations exhibited a slow component with a time constant that was considerably larger than the 20ps < tres < 30ps population. The tres > 50ps curve for isomer 1 in Fig. 15 has a slow component with a τ2 = 153ps. The frozen protein curve for isomer 1, and both curves for isomer 2 have a time constant between 300 and 350ps. As discussed below, if continued to longer times we would expect these curves to exhibit further slow components extended up to ~ 6ns, the time scale for overall rotation of the protein.
Considering the slow decay of 〈u(t) · u(0)〉, we first note that, in general, water molecules will exhibit some degree of polarization in the environment of the protein. On account of this polarization, 〈u〉 is not zero for a fixed protein orientation. Strictly speaking, 〈u(t) · u(0)〉 will not decay to zero until the orientation of the entire protein loses memory of its initial position, a time scale of several nanoseconds. Therefore, among the water molecules surrounding a particular chromophore, very long time components in 〈u(t) · u(0)〉 should be expected. The t > 50ps group would be expected to be most polarized by the protein. Compared to the 20ps < tres < 30ps group, the more tightly bound waters exhibit greater difference in their behavior when the protein is frozen. While part of the greater decay of 〈u(t) · u(0)〉 when the protein is not frozen may be attributed to a looser water structure resulting from protein flexibility, there is also a static contribution to this effect: When the protein is flexible, side chains will move and the electric field inducing polarization of nearby waters will fluctuate in time. Hence some fraction of the additional decay of 〈u(t) · u(0)〉 for waters near the flexible protein shown in Fig. 15 is the result of water polarization fluctuating in concert with side chain motion. Indeed, in Fig. 15 the correlation function 〈u(t) · u(0)〉 decays faster when the protein is flexible.
The slow components of the orientational correlation function 〈u(t) · u(0) 〉 are not reflected in the Stokes shift. As already discussed, some of the slow behavior of 〈u(t) · u(0)〉 describes the polarization of water fluctuating in concert with protein side groups. Besides protein side chain motion, only operative when the protein is flexible, there are other processes that contributes to the slow decay of 〈u(t) · u(0)〉 for both frozen and flexible protein. One, already mentioned, is overall protein reorientation. Another, which should be operative on the intermediate time scale of ~ 10–100ps, is diffusion of waters from one location to another during their residency in the hydration layer. The equilibrium local polarization of waters induced by the protein will change from location to location along the myoglobin surface. As a result, diffusion of waters will induce a change in their orientation as they travel between regions with different local polarizing fields, even for frozen protein.
6 Conclusions
Our studies reveal that slow (~ 60ps) time scale component of the Stokes shift of photoexcited W7 in myoglobin arises from coupled protein-water motion. When the total Stokes shift is broken into contributions from water and protein, the slow dynamics may apparently arise from either contribution. However, protein flexibility is required to observe the slow Stokes shift dynamics, regardless of whether the water or the protein contribution to the Stokes shift carries most of the slow component.
Analysis of the hydration layer and protein adjacent to the chromophore provides insight into the microscopic motions on different time scales that contribute to the Stokes shift, as well as dynamical components that have little effect on the Stokes shift. As in earlier studies,10, 82, 83 we find that the dynamics near the protein is significantly altered from the bulk, although our interpretation differs from those earlier studies in several respects, as discussed below. Taking the hydration layer to be the region within 5Å of a protein atom, as was done by previous workers,10, 83 we find that the waters can be classified into a more labile population that is typically further from the protein and a tightly bound, nearest neighbor layer within ~ 3.3Å of the protein. Orientational and translational motion is slowed considerably within the hydration layer, particularly for the tightly bound sub-population. Also, diffusion in the hydration layer is orders of magnitude slower than in bulk water.
The orientational correlation function 〈u(t) · u(0)〉 for both frozen and flexible protein is found to contain a ~ 2ps fast component, even for tightly bound waters close to the protein. Since the tightly bound waters reorient by a typical angle of 25° during this fast initial stage, even these waters can participate in solvating the chromophore. Moreover, individual trajectories of these tightly bound waters are quite variable. Some exhibit significant tumbling on a time scale of a few picoseconds (Fig. 16). The slow components of 〈u(t) · u(0)〉 exhibit time constants varying from ~ 150 to 350ps. Part of the slow behavior of 〈u(t) · u(0)〉 is not inherent to water strongly trapped in the force field of the protein, but arises because water polarization is responding adiabatically to protein motion during coupled protein-water fluctuations, as suggested by the difference between the frozen protein and full dynamics curves in Fig. 15. Lateral diffusion of water along the surface of the protein within the hydration layer, as shown in Fig. 13, is another source of slow dynamics in the orientational correlation function which is not a manifestation of orientational rigidity. As water molecules diffuse from site to site along the protein, they experience different polarizing fields. Hence diffusional motion within the hydration layer produces a slow component in 〈u(t) · u(0)〉. Further slow components in 〈u(t) · u(0)〉, extending all the way to one on the order of 6ns reflecting overall protein rotation would be detected if the correlation was accumulated at longer times. However, overall protein rotation does not contribute to slow dynamics of the Stokes shift either. We conclude that too much significance has been placed on the slow decay of 〈u(t) · u(0)〉 as evidence for a semi-rigid water layer that would be responsible for slow Stokes shift dynamics.7, 10, 83
The Stokes shift can be viewed as an alternative orientational correlation function in which, in the case studied in this work, the contribution of waters are mainly weighted by their relevance to the solvation process according to the r−3 form of the dipole-dipole electrostatic interaction. For the case of W7 in myoglobin, the Stokes shift does contain a slow component, but it reflects coupled protein-water dynamics, and not intrinsically slow water dynamics in the potential field of the protein. When the protein is frozen, the slow component of the Stokes shift disappears. The correlation function 〈u(t) · u(0)〉 has slow components due to protein flexibility, lateral diffusion of water along the protein surface and overall rotation of the protein. Some of these components are filtered out of the Stokes shift.
Our calculations of the Stokes shift via both linear response theory and non-equilibrium molecular dynamics, predict a slow ~ 60ps component to the Stokes shift, in agreement with experiment.21 The origin of such a slow component in the Stokes shift has been a matter of discussion and debate recently. Here we summarize previous arguments and our conclusions regarding these issues. Bagchi, Zewail and co-workers proposed that the slow dynamics is a manifestation of very tightly bound waters in the hydration layer surrounding the protein.5–12 In their model, the time for waters to exchange between the hydration layer, where they are rotationally frozen, and the surrounding bulk solvent dictates the slow time scale observed in the Stokes shift. Alternatively, Halle and Nilsson13, 14 propose that interactions between protein and chromophore play an active role in solvation, and that it is the slow dynamics of the protein that leads to the observed long time scale in time-dependent Stokes shift experiments. By repeating simulations of the same process with all protein motion frozen at the instant of photo-excitation, we establish that protein motion is essential for observation of the slow Stokes shift component for W7 in myoglobin. We took care to verify that freezing the protein does not shut down the exchange of water between hydration layer and the bulk. Hence, freezing the protein should not eliminate the slow dynamics according the the Nandi-Bagchi-Zewail mechanism, although quantitative, not qualitative, modifications as a consequence of freezing the protein will occur because waters near a rigid protein have a longer residence time than near a flexible protein. However, we observe that slow dynamics disappear when the protein is frozen.
Shaw et al. concluded that slow components in the fluorescence Stokes shift from dansyl chloride labels of α-chymotrypsin were exclusively due to slow dynamics of hydration water.84 Their interpretation of the Stokes shift was based on their previous observation of long components of a residence time correlation function in molecular dynamics studies.83 Our findings provide reasons to reevaluate the conclusions of Shaw et al.: While hydration water may exhibit slow dynamical features in orientational or residence time correlation functions or diffusion, this does not imply that the Stokes shift dynamics will have a slow component or that the slow components, even if they have similar time scales, have the same physical origin. The crucial role of protein dynamics, as revealed by our frozen protein studies, should be considered.
Even though we have emphasized protein motion in our analysis of the slow fluorescence Stokes shift dynamics of W7 in myoglobin, the role of solvent in this process should not be deprecated. Protein motion must taken to mean solvated protein motion. It is firmly established that protein motion, beyond local vibrational fluctuations, is facilitated by solvent motion, especially by translation of water molecules.15–17, 72–74 In fact, for W7 in myoglobin it is water translation, what is essential for exchange of bound and free water, that leads to slow Stokes shift dynamics in the Nandi-Bagchi-Zewail picture, that actually turns out to be a key factor in the Halle-Nilsson mechanism. Without coupled water-protein translation, the type of protein motion we find responsible for slow Stokes shift dynamics of W7 would not be possible. Indeed, we have previously established that freezing water instead of protein also eliminate slow components of the Stokes shift.21 Instead of directly setting the slowest time scale for the Stokes shift in the Nandi-Bagchi-Zewail picture, the properties of the residence time correlation function (Fig. 11) indirectly influence the slow Stokes shift dynamics through the effect of water translation on coupled protein-water motion. The coupling between protein and solvent fluctuations have been demonstrated experimentally in a study of lysozyme in trehalose and glycerol.85 In that work the temperature dependence of low-frequency protein vibrational dynamics was shown to track the corresponding low-frequency dynamics of the solvent.
Nilsson and Halle’s emphasis on protein motion is based on their observation that the protein contribution to the Stokes shift they calculated for monellin has a slow component, but the water component did not.14 One can only conclude that if they would have obtained Fig. 4b for isomer 1, Nilsson and Halle might have given up on their hypothesis since the protein contribution in that case has no slow component, or at most a very weak one. In this case, the total Stokes shift for isomer 1 contains a slow component that depends on protein flexibility, even though the protein contribution to the Stokes shift has no apparent slow component. The actual slow protein dynamics is masked by canceling contributions. Nevertheless, their influence is felt by the water contribution and the total Stokes shift. One should examine all components – protein, water, total, and, in fact, other dynamical variables as well – for a complete understanding of the relaxation process. The various components can cancel, and contribution from different parts of the protein to each component can also cancel.
Finally, there is a lesson to be learned from the apparent insensitivity of the Stokes shift to the interaction between the indole chromophore and neighboring charge groups. In Fig. 7 we see that the charged groups each contribute ~ 1kJmol−1 to the “solvation” of the excited chromophore in isomer 2, which is small compared to the 11.2kJmol−1 [Fig. 5] contributed by the protein backbone. Our calculations indicate that site-specific mutation experiments must be interpreted with caution. Insensitivity of the Stokes shift to site-specific mutation cannot be taken as evidence that the protein is not a key player in the relaxation process following photo-excitation of a chromophore. The protein contributes 30% of the total Stokes shift for isomer 1, and 64% for isomer 2. Yet, Fig. 4– Fig. 8 indicate that replacement of any of the neighboring charged residues with an uncharged, non-polar residue would likely have minor effect on the Stokes shift. In this regard, we also note that the transition between isomer 1 and isomer 2 is signaled by the interaction between the chromophore and the protein backbone, but not by the interaction between the chromophore and nearby charged side group.
Further studies are clearly needed. We find that protein flexibility is required for observation of a slow Stokes shift component for W7 in myoglobin and several other cases.20 However, we would be surprised if nature did not exhibit some cases, perhaps water trapped in a surface pocket, where slow Stokes shift dynamics was attributable to inherently slow water dynamics near a protein, even without coupling to protein motions (i.e. near a frozen protein).
Table 2.
Parameters obtained by fitting the calculated fluorescence anisotropy, Eq. (7), using the functional form specified in Eq. (8). The weights (c’s) are dimensionless) and the time constants are in units of ps.
| isomer 1 | isomer 2 | |
|---|---|---|
| (τg, cg) | (.12, .042) | (.16, .05) |
| (τ1, c1) | ( 15, .008) | (26, .01) |
| (τ2, c2) | (5863, .35) | (5863, .34) |
Acknowledgment
This work was supported in part by the National Science Foundation (CH-0517334) and National Institutes of Health (GM074813-01A1). The calculations reported here were made possible by a grant of resources from the Ohio Supercomputer Center.
References
- 1.Maroncelli M, Fleming GR. J. Chem. Phys. 1988;89(8):5044. [Google Scholar]
- 2.Stratt RM, Maroncelli M. J. Phys. Chem. 1996;100(31):12981. [Google Scholar]
- 3.Baskin JS, Chachisvilis M, Gupta M, Zewail AH. J. Phys. Chem. 1998;A102(23):4158. [Google Scholar]
- 4.Pal SK, Peon J, Zewail AH. PNAS. 2002;99(4):1763. doi: 10.1073/pnas.042697899. [DOI] [PMC free article] [PubMed] [Google Scholar]
- 5.Pal SK, Peon J, Bagchi B, Zewail AH. J. Phys. Chem. 2002;B106(48):12376. [Google Scholar]
- 6.Pal S, Zewail A. Chem. Rev. 2004;104(4):2099. doi: 10.1021/cr020689l. [DOI] [PubMed] [Google Scholar]
- 7.Nandi N, Bagchi B. J. Phys. Chem. 1997;B101(50):10954. [Google Scholar]
- 8.Nandi N, Bagchi B. J. Phys. Chem. 1998;102(43):8217. [Google Scholar]
- 9.Nandi N, Bhattacharyya K, Bagchi B. Chem. Rev. 2000;100(6):2013. doi: 10.1021/cr980127v. [DOI] [PubMed] [Google Scholar]
- 10.Bandyopadhyay S, Chakraborty S, Balasubramanian S, Pal S, Bagchi B. J. Phys. Chem. 2004;B108(33):12608. [Google Scholar]
- 11.Bandyopadhyay S, Chakraborty S, Balasubramanian S, Bagchi B. J. Am. Chem. Soc. 2005;127(11):4071. doi: 10.1021/ja042847r. [DOI] [PubMed] [Google Scholar]
- 12.Bagchi B. Chemical Reviews. 2005;105(9):3197. doi: 10.1021/cr020661+. [DOI] [PubMed] [Google Scholar]
- 13.Halle B. Phil. Trans. R. Soc. Lond. 2004;B359(1448):1207. doi: 10.1098/rstb.2004.1499. [DOI] [PMC free article] [PubMed] [Google Scholar]
- 14.Nilsson L, Halle B. Proc. Nat. Acad Sci. USA. 2005;102(39):13867. doi: 10.1073/pnas.0504181102. [DOI] [PMC free article] [PubMed] [Google Scholar]
- 15.Vitkup D, Ringe D, Petsko GA, Karplus M. Nature Struct. Biol. 2000;7(1):34. doi: 10.1038/71231. [DOI] [PubMed] [Google Scholar]
- 16.Tarek M, Tobias DJ. Phys. Rev. Lett. 2002;88(13):138101. doi: 10.1103/PhysRevLett.88.138101. [DOI] [PubMed] [Google Scholar]
- 17.Tournier AL, Xu J, Smith JC. Biophys. J. 2003;85(3):1871. doi: 10.1016/S0006-3495(03)74614-1. [DOI] [PMC free article] [PubMed] [Google Scholar]
- 18.Senapati S, Berkowitz ML. J. Chem. Phys. 2003;118(4):1937. [Google Scholar]
- 19.Bhide SY, Berkowitz ML. J. Chem. Phys. 2006;125(9):094713. doi: 10.1063/1.2337623. [DOI] [PubMed] [Google Scholar]
- 20.Li T, Hassanali AA, Singer SJ. [Google Scholar]
- 21.Li T, Hassanali AA, Kao Y-T, Zhong D, Singer SJ. J. Amer. Chem. Soc. 2007;129(11):3376–3382. doi: 10.1021/ja0685957. [DOI] [PubMed] [Google Scholar]
- 22.Pal S, Balasubramanian S, Bagchi B. Phys. Rev. 2003;E67(6):061502. doi: 10.1103/PhysRevE.67.061502. [DOI] [PubMed] [Google Scholar]
- 23.Berendsen HJC, van der Spoel D, van Drunen R. Comp. Phys. Comm. 1995;91(1–3):43. [Google Scholar]
- 24.Lindahl E, Hess B, van der Spoel D. J. Mol. Mod. 2001;7(8):306. [Google Scholar]
- 25.van der Spoel D, Lindahl E, Hess B, van Buuren AR, Apol E, Meulenhoff PJ, Tieleman DP, Sijbers ALTM, Feenstra KA, van Drunen R, Berendsen HJC. Gromacs user manual version 3.2. 2004 [Google Scholar]
- 26.van Gunsteren WF, Billeter SR, Eising AA, Hünenberger PH, Krüger P, Mark AE, Scott WRP, Tironi IG. Biomolecular simulation: The gromos96 manual and user guide. 1996 [Google Scholar]
- 27.Daura X, Suter R, van Gunsteren WF. J. Chem. Phys. 1999;110(6):3049. [Google Scholar]
- 28.Hassanali AA, Li T, Zhong D, Singer SJ. J. Phys. Chem. 2006;B110(21):10497. doi: 10.1021/jp0601926. [DOI] [PubMed] [Google Scholar]
- 29.Darden T, York D, Pedersen L. J. Chem. Phys. 1993;98(12):10089–10092. [Google Scholar]
- 30.Perera UEL, Berkowitz ML, Darden T, Lee H, Pedersen LG. J. Chem. Phys. 1995;103(19):8577–8593. [Google Scholar]
- 31.Hess B, Bekker H, Berendsen HJC, Fraaije JGEM. J. Comp. Chem. 1997;18(12):1463. [Google Scholar]
- 32.Nosé S. Mol. Phys. 1984;52:255. [Google Scholar]
- 33.Nosé S. J. Chem. Phys. 1984;81(1):511. [Google Scholar]
- 34.Hoover WG. Phys. Rev. 1985;A31(3):1695. doi: 10.1103/physreva.31.1695. [DOI] [PubMed] [Google Scholar]
- 35.Berman HM, Westbrook J, Feng Z, Gilliland G, Bhat TN, Weissig H, Shindyalov IN, Bourne PE. Nucl. Acids Res. 2000;28(1):235–242. doi: 10.1093/nar/28.1.235. [DOI] [PMC free article] [PubMed] [Google Scholar]
- 36.Sobolewski AL, Domcke W. Chem. Phys. Lett. 1999;315(3–4):293. [Google Scholar]
- 37.Qiu W, Zhang L, Kao Y-T, Lu W, Li T, Kim J, Sollenberger GM, Wang L, Zhong D. J. Phys. Chem. 2005;B109(35):16901. doi: 10.1021/jp0511754. [DOI] [PubMed] [Google Scholar]
- 38.Lu W, Kim J, Qiu W, Zhong D. Chem. Phys. Lett. 2004;388(1–3):120. [Google Scholar]
- 39.Levy RM, Sheridan RP, Keepers JW, Dubey GS, Swaminathan S, Karplus M. Biophys. J. 1985;48(3):509. doi: 10.1016/S0006-3495(85)83806-6. [DOI] [PMC free article] [PubMed] [Google Scholar]
- 40.Henry ER, Eaton WA, Hochstrasser RM. Proc. Nat. Acad. Sci. (USA) 1986;83(23):8982. doi: 10.1073/pnas.83.23.8982. [DOI] [PMC free article] [PubMed] [Google Scholar]
- 41.Henry ER, Hochstrasser RM. Proc. Nat. Acad. Sci. (USA) 1987;84(17):6142. doi: 10.1073/pnas.84.17.6142. [DOI] [PMC free article] [PubMed] [Google Scholar]
- 42.Elber R, Karplus M. Science. 1987;235(4786):318. doi: 10.1126/science.3798113. [DOI] [PubMed] [Google Scholar]
- 43.Janes SM, Holtom G, Ascenzi P, Brunori M, Hochstrasser RM. Biophys. J. 1987;51(4):661. doi: 10.1016/S0006-3495(87)83390-8. [DOI] [PMC free article] [PubMed] [Google Scholar]
- 44.Brooks CL., III J. Mol. Biol. 1992;227(2):375. doi: 10.1016/0022-2836(92)90893-o. [DOI] [PubMed] [Google Scholar]
- 45.Steinbach PJ, Brooks BR. Proc. Nat. Acad. Sci. (USA) 1993;90(19):9135. doi: 10.1073/pnas.90.19.9135. [DOI] [PMC free article] [PubMed] [Google Scholar]
- 46.Furois-Corbin S, Smith JC, Kneller GR. Proteins: Structure, Function, and Genetics. 1993;16(2):141. doi: 10.1002/prot.340160203. [DOI] [PubMed] [Google Scholar]
- 47.Schaad O, Zhou H-Z, Szabo A, Eaton WA, Henry ER. Proc. Nat. Acad. Sci. (USA) 1993;90(20):9547. doi: 10.1073/pnas.90.20.9547. [DOI] [PMC free article] [PubMed] [Google Scholar]
- 48.Clarage JB, Romo T, Andrews BK, Pettitt BM, Phillips GN., Jr Proc. Nat. Acad. Sci. (USA) 1995;92(8):3288. doi: 10.1073/pnas.92.8.3288. [DOI] [PMC free article] [PubMed] [Google Scholar]
- 49.Hirst JD, Brooks CL., III Biochemistry. 1995;34(23):7614. doi: 10.1021/bi00023a007. [DOI] [PubMed] [Google Scholar]
- 50.Simonson T, Brooks CL., III J. Amer. Chem. Soc. 1996;118(35):8452. [Google Scholar]
- 51.MacKerell AD, Jr., Bashford D, Bellott M, Dunbrack RL, Jr, Evanseck JD, Field MJ, Fischer S, Gao J, Guo H, Ha S, Joseph-McCarthy D, Kuchnir L, Kuczera K, Lau FTK, Mattos C, Michnick S, Ngo T, Nguyen DT, Prodhom B, Reiher WE, III, Roux B, Schlenkrich M, Smith JC, Stote R, Straub J, Watanabe M, Wiorkiewicz-Kuczera J, Yin D, Karplus M. J. Phys. Chem. 1998;B102(18):3586. doi: 10.1021/jp973084f. [DOI] [PubMed] [Google Scholar]
- 52.Meller J, Elber R. Biophys. J. 1998;74(2):789. doi: 10.1016/S0006-3495(98)74004-4. [DOI] [PMC free article] [PubMed] [Google Scholar]
- 53.Sagnella DE, Straub JE, Jackson TA, Lim M, Anfinrud PA. Proc. Nat. Acad. Sci. (USA) 1999;96(25):14324. doi: 10.1073/pnas.96.25.14324. [DOI] [PMC free article] [PubMed] [Google Scholar]
- 54.Rovira C, Parrinello M. Int. J. Quant. Chem. 2000;80(6):1172. [Google Scholar]
- 55.Makarov VA, Andrews BK, Smith PE, Pettitt BM. Biophys. J. 2000;79(6):2966. doi: 10.1016/S0006-3495(00)76533-7. [DOI] [PMC free article] [PubMed] [Google Scholar]
- 56.Tcherkasskaya O, Ptitsyn OB, Knutson JR. Biochem. 2000;39(7):1879. doi: 10.1021/bi992117+. [DOI] [PubMed] [Google Scholar]
- 57.Rovira C, Schulze B, Eichinger M, Evanseck JD, Parrinello M. Biophys. J. 2001;81(1):435. doi: 10.1016/S0006-3495(01)75711-6. [DOI] [PMC free article] [PubMed] [Google Scholar]
- 58.Merchant KA, Thompson DE, Xu Q-H, Williams RB, Loring RF, Fayer MD. Biophys. J. 2002;82(6):3277. doi: 10.1016/S0006-3495(02)75669-5. [DOI] [PMC free article] [PubMed] [Google Scholar]
- 59.Tournier AL, Smith JC. Phys. Rev. Lett. 2003;91(20):208106. doi: 10.1103/PhysRevLett.91.208106. [DOI] [PubMed] [Google Scholar]
- 60.Aschi M, Zazza C, Spezia R, Bossa C, Di Nola A, Paci M, Amadei A. J. Comput. Chem. 2004;25(7):974. doi: 10.1002/jcc.20029. [DOI] [PubMed] [Google Scholar]
- 61.Bossa C, Anselmi M, amd Andrea Amadei DR, Vallone B, Brunori M, Di Nola A. Biophpys. J. 2004;86(6):3855. doi: 10.1529/biophysj.103.037432. [DOI] [PMC free article] [PubMed] [Google Scholar]
- 62.Gu W, Schoenborn BP. Proteins: Structure, Function, and Genetics. 2004;22(1):20. [Google Scholar]
- 63.Sheu S-Y. J. Chem. Phys. 2006;124(15):154711. doi: 10.1063/1.2185626. [DOI] [PubMed] [Google Scholar]
- 64.R.Gunner M, Saleh MA, Cross E, ud Doula A, Wise M. Biophys. J. 2000;78(3):1126–1144. doi: 10.1016/S0006-3495(00)76671-9. [DOI] [PMC free article] [PubMed] [Google Scholar]
- 65.Avbelj F. J. Mol. Biol. 2000;300(5):1361–1375. doi: 10.1006/jmbi.2000.3901. [DOI] [PubMed] [Google Scholar]
- 66.Avbelj F, Baldwin RL. Proc. Nat. Acad. Sci. (USA) 2003;100(10):5742–5747. doi: 10.1073/pnas.1031522100. [DOI] [PMC free article] [PubMed] [Google Scholar]
- 67.Ripoll DR, Vila JA, Scheraga HA. Proc. Nat. Acad. Sci. (USA) 2005;102(21):7559–7564. doi: 10.1073/pnas.0502754102. [DOI] [PMC free article] [PubMed] [Google Scholar]
- 68.Frauenfelder H, Alberding NA, Ansari A, Braunstein D, Cowen BR, Hong MK, Iben IET, Johnson JB, Luck S, Marden MC, Mourant JR, Ormos P, Reinisch L, Scholl R, Schulte A, Shyansunder E, Sorensen LB, Steinbach PJ, Xie A, Young RD, Yue KT. J. Phys. Chem. 1990;94(3):1024. [Google Scholar]
- 69.Flyvbjerg H, Petersen HG. J. Chem. Phys. 1989;91(1):461. [Google Scholar]
- 70.Carter EA, Hynes JT. J. Chem. Phys. 1991;94(9):5961. [Google Scholar]
- 71.Stratt RM, Cho M. J. Chem. Phys. 1994;100(9):6700. [Google Scholar]
- 72.Fenimore PW, Frauenfelder H, McMahon BH, Parak FG. Proc. Nat. Acad. Sci. (USA) 2002;99(25):16047. doi: 10.1073/pnas.212637899. [DOI] [PMC free article] [PubMed] [Google Scholar]
- 73.Fenimore PW, Frauenfelder H, McMahon BH, Young RD. Proc. Nat. Acad. Sci. (USA) 2004;101(40):14408. doi: 10.1073/pnas.0405573101. [DOI] [PMC free article] [PubMed] [Google Scholar]
- 74.Smith JC, Merzel F, Bondar A-N, Tournier A, Fischer S. Phil. Trans. R. Soc. Lond. 2004;B359(1448):1181. doi: 10.1098/rstb.2004.1497. [DOI] [PMC free article] [PubMed] [Google Scholar]
- 75.Zhong D. 2006 unpublished. [Google Scholar]
- 76.Ichiye T, Karplus M. Biochemistry. 1983;22(12):2884. doi: 10.1021/bi00281a017. [DOI] [PubMed] [Google Scholar]
- 77.Bismuto E, Gratton E, Sirangelo I, Irace G. Eur. J. Biochem. 1993;218(1):213–219. doi: 10.1111/j.1432-1033.1993.tb18367.x. [DOI] [PubMed] [Google Scholar]
- 78.Rischel C, Thyberg P, Rigler R, Poulsen FM. J. Mol. Biol. 1996;257(4):877. doi: 10.1006/jmbi.1996.0208. [DOI] [PubMed] [Google Scholar]
- 79.Zhong D, Pal SK, Zhang D, Chan SI, Zewail AH. Proc. Natl. Acad. Sci. USA. 2002;99(1):13. doi: 10.1073/pnas.012582399. [DOI] [PMC free article] [PubMed] [Google Scholar]
- 80.Shen X, Knutson J. J. Phys. Chem. 2001;B105(26):6260. [Google Scholar]
- 81.Brunne RM, Liepinsh E, Otting G, Wüthrich K, van Gunsteren WF. J. Mol. Biol. 1993;231(4):1040. doi: 10.1006/jmbi.1993.1350. [DOI] [PubMed] [Google Scholar]
- 82.Pizzitutti F, Marchi M, Sterpone F, Rossky PJ. J. Phys. Chem. 2007;B111(26):7584–7590. doi: 10.1021/jp0717185. [DOI] [PubMed] [Google Scholar]
- 83.Hansia Priti, Saraswathi Vishveshwara SKP. Chem. Phys. Lett. 2006;420(4–6):512–517. [Google Scholar]
- 84.Shaw AjayKumar, Rupa Sarkar DBSHAMSKP. J. Photochem. Photobiology A: Chemistry. 2006;185(1):76–85. [Google Scholar]
- 85.Caliskan G, Mechtani D, Roh JH, Kisliuk A, Sokolov AP, Azzam S, Cicerone MT, Lin-Gibson S, Peral I. J. Chem. Phys. 2004;121(4):1978–1983. doi: 10.1063/1.1764491. [DOI] [PubMed] [Google Scholar]


