

Abstract
Microbubble contrast agents and the associated imaging systems have developed over the past twenty-five years, originating with manually-agitated fluids introduced for intra-coronary injection. Over this period, stabilizing shells and low diffusivity gas materials have been incorporated in microbubbles, extending stability in vitro and in vivo. Simultaneously, the interaction of these small gas bubbles with ultrasonic waves has been extensively studied, resulting in models for oscillation and increasingly sophisticated imaging strategies. Early studies recognized that echoes from microbubbles contained frequencies that are multiples of the microbubble resonance frequency. Although individual microbubble contrast agents cannot be resolved—given that their diameter is on the order of microns—nonlinear echoes from these agents are used to map regions of perfused tissue and to estimate the local microvascular flow rate. Such strategies overcome a fundamental limitation of previous ultrasound blood flow strategies; the previous Doppler-based strategies are insensitive to capillary flow. Further, the insonation of resonant bubbles results in interesting physical phenomena that have been widely studied for use in drug and gene delivery. Ultrasound pressure can enhance gas diffusion, rapidly fragment the agent into a set of smaller bubbles or displace the microbubble to a blood vessel wall. Insonation of a microbubble can also produce liquid jets and local shear stress that alter biological membranes and facilitate transport. In this review, we focus on the physical aspects of these agents, exploring microbubble imaging modes, models for microbubble oscillation and the interaction of the microbubble with the endothelium.
1. Introduction
The engineering of ultrasound contrast agents, co-optimized with systems for imaging their local distribution and enhancing their use in local drug delivery, is a rich, multidisciplinary undertaking. Ultrasound contrast agents are small gas bubbles encapsulated by a stabilizing shell, with a typical diameter on the order of microns (Table 1). These microbubbles are injected intravenously and remain within the blood pool, with early agents shown to circulate in a manner similar to red blood cells (Jayaweera et al., 1994). Ultrasound pulses are typically applied with a frequency near the resonance frequency of the gas bubble and the bubbles increase and decrease in diameter, producing strong echoes from regions of perfused tissue (Dejong et al., 1994b; Dayton et al., 1999b). Trains of ultrasound pulses with varied frequency, phase and amplitude are designed to separate bubble and tissue echoes under well-characterized conditions and we review these pulse trains here. Optimized pulse trains for quantitative imaging of blood vessel density and perfusion and enhanced drug delivery continue to evolve.
Table 1.
Physical characteristics and dosage recommendations for ultrasound contrast agents widely using in both imaging and drug delivery studies
| Formulation | Shell | Gas | Concentration (mL−1) | Mean Diameter (μm) | Recommended Dose* | Reference |
|---|---|---|---|---|---|---|
| Optison | Albumin | C3F8 | 5.0–8.0 × 10⁸ | 3.0–4.5 | 0.5 mL | (Optison-Prescribing-Information) |
| Definity | Lipid | C3F8 | 1.2 × 10¹⁰ | 1.1–3.3 | 10μL/kg | (Definity-Prescribing- Information) |
| PESDA | Dextrose albumin | C4F10 | 6.5 × 10⁸ | 2.5–4.9 | 2.5–10 (μL/kg) | (Porter et al., 1996) |
bolus intravenous injection into peripheral vein.
Several generations of the microbubble agents have also been developed, where early agents contained an air core and were stabilized by a coating of albumin, starting with Albunex®. Agents with a fluorinated gas core were then developed, including Optison™ (GE Healthcare Systems) with a protein shell and perfluoropropane gas core and Definity® (Bristol-Myers Squibb) with a phospholipid shell and perfluoropropane core (Definity-Prescribing-Information,; Optison-Prescribing-Information). Microbubbles are typically manufactured by mechanical agitation, although microfluidic methods to engineer precise size distributions are in development (Talu et al., 2006). An excellent history of microbubble agents was recently provided (Kaul, 2008), the biophysics of the agents and their shells was detailed in (Ferrara et al., 2007) and the chemistries of the agents were described in greater detail in (Klibanov, 2005). Within this review, we focus on the engineering and physical principles behind the imaging systems that employ microbubbles, models that have been developed to describe microbubble response to an ultrasound pulse and the impact of microbubble oscillation on small blood vessels.
2. Experimental studies of oscillation, echoes and spectra
In response to an ultrasonic pressure wave, microbubbles expand and contract with each cycle of pressure. Optical imaging methods to visualize the increasing and decreasing diameter have been developed (Klibanov et al., 1998; Dayton et al., 1999b; Chomas et al., 2000; Postema et al., 2005; Garbin et al., 2007), where two-dimensional images of the microbubble can be acquired with shutter speeds on the order of nanoseconds. Alternatively, images of a single line through the center of a bubble are recorded, where these recordings, known as “streak” images, can be updated with nanoseconds or picoseconds between recordings (Chomas et al., 2000). For a typical microbubble with a diameter of ~2 μm, the streak image acquired during insonation with a 2.25-MHz center frequency pulse at a low peak rarefactional pressure (PRP) (~100 kPa) demonstrates the increasing and decreasing bubble diameter (Figure 1a). For a low transmitted PRP, the microbubble oscillation corresponds to the rarefaction and compression of the ultrasound wave, with a frequency close to the incident ultrasound frequency (Figure 1a,c). Within Figure 1c, predictions for the expansion ratio (defined as the instantaneous radius normalized by the initial radius) are illustrated for two transmitted PRP amplitudes of 30 and 60 kPa. For these very low values, oscillation is nearly sinusoidal with the expansion scaling nearly linearly (2-fold) between these values.
Figure 1.
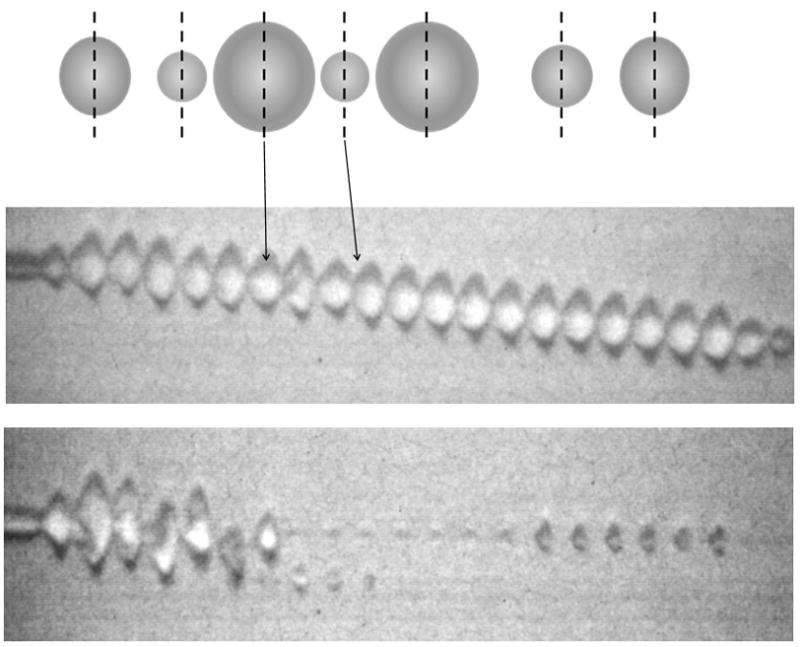

Observed and predicted microbubble oscillation. (a) and (b): experimental streak images of 1.4-μm lipid-shelled microbubbles insonified with a 2.25 MHz pulse with a PRP of ~100 (a) or 300 kPa. (b). The streak image is an optical image acquired with an ~15 ns shutter showing a single line through the center of the microbubble (shown as dashed line in cartoon) as it expands and contracts during the ultrasound pulse. Momentum is transferred to the microbubble from the ultrasound pulse resulting in a net displacement of the microbubble. At the higher ultrasound pressure, the microbubble fragments and the resulting small microbubbles can be visualized. (c) and (d): predicted microbubble expansion ratio versus time for a bubble with an initial size of 2 μm during insonation with 1-MHz 5-cyle ultrasonic pulses using the equation and parameters as in (Zhao et al., 2004). (c) For a low transmitted PRP, microbubble oscillation is harmonic at a frequency close to the incident ultrasound frequency and the bubble expansion ratio is nearly proportional to the transmitted PRP; (d) For a high transmitted PRP, the oscillation nonlinearity increases and the expansion ratio increases more rapidly than the transmitted PRP.
With a higher PRP, the magnitude of the expansion and the speed of microbubble collapse each increase substantially, and the oscillation of the microbubble has a nonlinear relationship to the driving pressure (Figure 1b,d) (Morgan et al., 2000). The nonlinear nature of microbubble oscillation is again illustrated by the predicted expansion ratios, where doubling of the transmitted PRP from 150 to 300 kPa increases the peak expansion ratio by more than 2.5 fold (Figure 1d). Also, for these higher values of transmitted PRP, microbubble expansion is no longer sinusoidal; instead, expansion is followed by a comparatively faster collapse. As a result, the frequency spectra of echoes produced by the microbubble contain multiples and in some cases a sub-multiple of the transmitted frequency (Schrope and Newhouse, 1993; Dejong et al., 1994b; Chomas et al., 2002). These harmonic echo components are used to detect the presence and concentration of microbubbles throughout the body, as described in the Section 4. The rate of microbubble expansion and collapse depends upon the sound field as well as the diameter of the microbubble (as compared with the transmitted pulse) and nearby boundaries.
Raising the PRP to 300 kPa (with all other parameters held constant) also results in the destruction of the microbubble during the pulse, where asymmetries and fragments are visualized (Figure 1b). The mechanisms of microbubble destruction are described in detail in (Chomas et al., 2001a; Chomas et al., 2001b) including diffusion of the gas from the microbubble core in the absence of ultrasound, enhanced diffusion of the gas from the microbubble core in the presence of ultrasound and the fragmentation of the microbubble during oscillation (Figure 2a). Recordings of the echoes that result from oscillation and microbubble destruction demonstrate an increased center frequency as the diameter decreases and decreased echo amplitude with microbubble fragmentation (Figure 2b).
Figure 2.
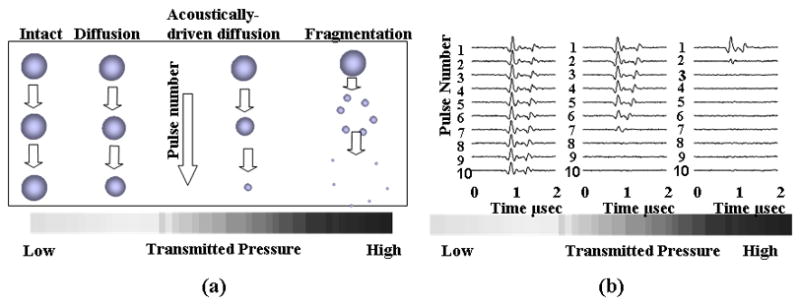
(a) Cartoon demonstrating the mechanisms of ultrasound contrast agent destruction, including diffusion, acoustically-driven diffusion and fragmentation. (b) Recordings of the echoes from single microbubbles during insonation with a train of 4.4-MHz pulses with a pulse duration of 1.5 cycles, pulse repetition frequency of 1 kHz and varied PRP.
Expansion and fragmentation of lipid-shelled microbubbles are determined primarily by the resting microbubble diameter, frequency, phase and amplitude of the ultrasound pulse (Figure 3). Increasing PRP, decreasing frequency, and decreasing resting diameter increase the normalized expansion and likelihood of microbubble fragmentation. For a lipid-shelled microbubble, the lipid molecules self assemble as a coating on the gas-liquid interface (Kim et al., 2000; Lee et al., 2001; Borden and Longo, 2002; Borden et al., 2005a; Borden et al., 2006a; Borden et al., 2005b). The thin, lipid shell buckles into a bilayer during compression and leaves unprotected regions of the interface during expansion. Alternatively, polymer and albumin shells can rupture during oscillation with discrete defects visualized (Bloch et al., 2005; Bloch et al., 2004; Patel et al., 2004).
Figure 3.
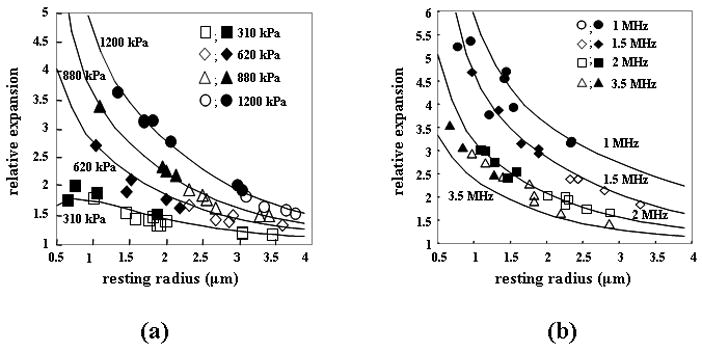
(a) Relative expansion of microbubbles during insonation at 2.25 MHz with PRP ranging from 310 kPa to 1200 kPa. (b) Relative expansion of microbubbles for 1, 1.5, 2, and 3.5 MHz transmitted center frequencies.
Although harmonic echoes are often associated with microbubbles, tissue echoes also contain harmonic multiples of the initial transmitted center frequency, resulting from the nonlinear propagation of the transmitted ultrasound pressure wave. The speed of sound is higher for the higher pressure components of an ultrasound wave traveling within tissue and therefore the pulse distorts during propagation. Tissue echoes from the distorted pressure wave also contain harmonic frequencies (Schoelgens, 1998).
With a bubble oscillating near a boundary, asymmetric collapse occurs and fluid jets can impinge on and damage a gel surface (Figure 4a) (Kodama and Tomita, 2000). Although the cavitating bubbles in Figure 4a are large (diameter of 2 mm) compared to microbubbles, jet-like formations have been observed with microbubbles driven at low ultrasonic transmission frequencies (~1 MHz) (Prentice et al., 2005). Fluid jets produced by oscillating microbubbles are predicted to be spatially smaller (than those of larger gas bubbles) and achieve velocities as high as 1.4 km/sec during a shockwave pulse (Fong et al., 2008). In vitro, high-speed images (shown in Figure 4b) and atomic force microscopy demonstrated that microbubble-associated fluid jets resulted in a 16-μm wide pit in the surface of cells (Prentice et al., 2005).
Figure 4.
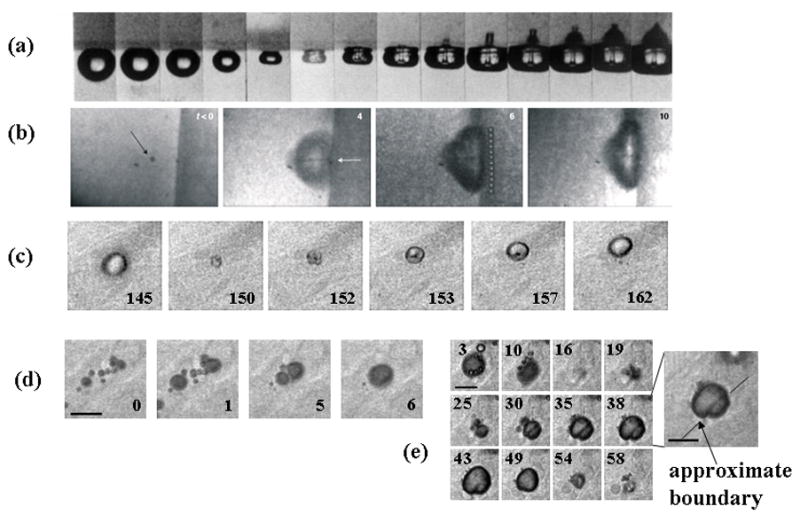
In vitro and ex vivo optical images of microbubbles oscillating near boundaries. (a) A cavitating bubble collapsing and impinging on a gel surface, Reproduced with permission from (Kodama and Tomita, 2000). (b) Microbubble at boundary of cultured cell with feature in center that indicates jet formation. Reproduced with permission from (Prentice et al., 2005). (c) Microbubble oscillation in a microvessel within the rat cecum undergoing asymmetric oscillation with feature in center indicating toroidal microbubble shape. Reproduced with permission from (Caskey et al., 2007). (d) Microbubble coalescence shown in ex vivo microvessel with large bubble interacting with vessel wall. Reproduced with permission from (Caskey et al., 2007).
Within ex vivo tissues, the asymmetric oscillation of bubbles oscillating near boundaries demonstrated a toroidal morphology suggesting the presence of fluid jets (Figure 4c) (Caskey et al., 2007). With a large number of microbubbles located within a distance of tens of microns, the bubbles attract one another and fuse into a single bubble following a train of pulses (Figure 4d).
The effect of bubble oscillation on tissue has also been examined in vivo by Stieger et al (Stieger et al., 2007). In these experiments, a chorioallantoic membrane was optically imaged using a fluorescently-labeled model drug during insonation with 1 and 2.25-MHz acoustic pulses at varied PRP. A sequence of images showed extravasation of the model drug during 1-MHz insonation. Electron microscopy images demonstrated disrupted vascular endothelium in a chicken embryo perfused with contrast agents, where endothelial cells with vacuoles, blebs, and filipodia can be seen in the electron microscopy images acquired after applying ultrasound at transmission frequencies of 1 and 2.25 MHz (Stieger et al., 2007).
In addition, the ultrasound pressure displaces the microbubble along the axis of the ultrasound propagation—an effect known as primary radiation force or a primary Bjerknes force—shown in Figure 1a as a downward displacement of the microbubble with each acoustic cycle (Dayton et al., 1997; Dayton et al., 1999a; Dayton et al., 2002; Lum et al., 2006; Borden et al., 2006b). Increasing the acoustic pressure increases the radiation force and therefore increases the translational displacement. A bubble with a resting diameter equivalent to the resonant diameter for a given frequency is displaced by the greatest distance (Dayton et al., 2002).
3. Models for microbubble dynamics
Since 1917, researchers have developed a variety of theoretical models to study gas bubble dynamics in liquids, many of which are summarized in Table 2. We structure this section (and Table 2) by starting with the simplest case—that of the free microbubble driven by a low amplitude sound field in an infinite fluid. Clearly, there are many levels of assumptions required to apply this model to the real application—that of encapsulated bubbles traveling within small blood vessels which contain a high concentration of red blood cells and driven by high amplitude sound fields. In order to accurately model the behavior of contrast microbubbles in vivo, a series of increasingly complex models have been developed, still typically including a number of assumptions and simplifications in each case. For example, recent treatments of the behavior of bubbles within a bubble cloud have begun with the unshelled bubble (Hamilton et al., 2005), while simultaneously others address the behavior of a single micro-bubble non-spherically oscillating within a small vessel (Qin and Ferrara, 2006).
Table 2.
Summary of models of gas bubble dynamics
| Assumptions | Brief description | Representative references |
|---|---|---|
| a: unshelled bubble in incompressible unbounded liquid | This is the classic Rayleigh-Plesset equation assuming uniform gas pressure within the bubble, and where the gas usually obeys the polytropic law. | (Rayleigh, 1917; Plesset, 1949; Plesset and Prosperetti, 1977; Vokurka, 1985) |
| b: unconstrained small-amplitude radial oscillations | A linear approximation is applied to the Rayleigh- Plesset equation. | (Devin, 1959; Fanelli et al., 1981; Vokurka, 1985; Dejong et al., 1994a; Dejong et al., 1992; Prosperetti, 1975; Miller, 1981; Allen et al., 2001) |
| c: unconstrained small-amplitude non-spherical oscillations | Based on a linear approximation, bubble shapes, modes and scattering characteristics are investigated. | (Strasberg, 1956; Gaunaurd and Uberall, 1978; Sage et al., 1979; Allen et al., 2001; Huet al., 2004; Tsamopoulos and Brown, 1983, 1984; Feng and Leal, 1994) |
| Unconstrained nonlinear radial oscillations | ||
| d: liquid compressibility | When the magnitude of the bubble wall velocity approaches the speed of sound in the liquid, extensions of the Rayleigh- Plesset equation are introduced that include liquid compressibility and sound radiation effects. The widely-used Gilmore equation, the Keller equation and the Herring equation fall into this category. | (Gilmore, 1952; Trilling, 1952; Keller and Kolodner, 1956; Biasi et al., 1972; Keller and Miksis, 1980; Prosperetti, 1982b; Prosperetti and Lezzi, 1986; Vokurka, 1986; Lezzi and Prosperetti, 1987; Prosperetti, 1987; Brenner, 1995; Brujan, 1998; Prosperetti et al., 1988; Barber et al., 1997; Brujan, 1999; Putterman et al., 2001; Brujan, 2001; Brenner et al., 2002) |
| e: thermal effects | Heat transfer between the bubble and liquid is included by coupling the heat diffusion equation to the modified Rayleigh- Plesset equation without adiabatic or isothermal assumptions. | (Flynn, 1975a, b; Kamath and Prosperetti, 1989; Prosperetti, 1991; Kamath et al., 1992; Goldsztein, 2004) |
| f: gas diffusion | For acoustically-driven bubble diffusion (Chomas et al., 2001a), bubble equilibrium size is determined by the gas diffusion equation. | (Payvar, 1987; Fyrillas and Szeri, 1994, 1995; Lofstedt et al., 1995) |
| g: spatial distribution of gas pressure | Gas pressure spatial distribution is coupled to bubble radial equation. | (Lin et al., 2002; Prosperetti et al., 1988) |
| h: shell viscosity and elasticity | The bubble shell is simplified as a layer of incompressible liquid or elastic solid. Stress and velocity continuity are met at the shell inner and outer surfaces. | (Hoff et al., 2000; Postema and Schmitz, 2007; Dejong et al., 1994a; Glazman, 1983; Frinking and de Jong, 1998; Church, 1995; Borden and Longo, 2002; Marmottant et al., 2005; Morgan et al., 2000; Dayton et al., 2001; Allen et al., 2002) |
| i: non- Newtonian liquid | A non-Newtonian liquid model is used to describe blood flow in vessels due to the non-uniform viscosity distribution across the blood vessel cross section. | (Brujan, 2001; Favelukis and Albalak, 1996; Brujan, 2000; Alekseev and Rybak, 1999; Allen and Roy, 2000b, a) |
| j: translational displacement due to radiation force | Due the pressure gradient in the liquid, a net radiation force is generated upon oscillating bubbles. | (Dayton et al., 2002; Zhao et al., 2004; Pelekasis et al., 2004; Doinikov and Dayton, 2006) |
| Constrained nonlinear oscillations | ||
| k: near a surface | Both analytical solutions and numerical simulations have been developed. Image theory and boundary integral methods are utilized. | (Oguz and Prosperetti, 1990a, b, 1993; Takahira, 1997; Yuan and Prosperetti, 1997; Zeff et al., 2000; Brujan et al., 2001; Brujan et al., 2002; Brujan et al., 2004; Fong et al., 2006; Cui et al., 2006; Krasovitski and Kimmel, 2004; Nyborg, 1958; Sato et al., 1994; Afanasiev and Grigorieva, 2006; Blake et al., 1999; Bremond et al., 2006) |
| l: within a tube | During insonation, ultrasound contrast microbubbles oscillate within blood vessels. To study bubble oscillation within a small vessel, the vessel can be simplified as a rigid or compliant tube. | (Yuan et al., 1999; Ory et al., 2000; Hu et al., 2005; Qin and Ferrara, 2006; Qin et al., 2006; Ye and Bull, 2006; Qin and Ferrara, 2007) |
| (Unconstrained nonlinear and constrained linear) nonspherical oscillation | ||
| m: unconstrained nonlinear non- spherical oscillations | The assumption of the spherical morphology of the bubble-liquid interface is removed. The bubble- liquid interface shape is determined either by gas- liquid interaction or by a predetermined shape profile. | (Crum, 1979; Klaseboer et al., 2006; Yang et al., 1993; Gordillo and Fontelos, 2007; Eggers et al., 2007) |
| n: constrained small-amplitude non-spherical oscillations | Linear approximation is used and the boundary conditions are enforced. | (Sassaroli and Hynynen, 2004, 2005; Oguz and Prosperetti, 1998; Cui et al., 2006) |
| Bubble-bubble interaction | ||
| o: unconstrained bubble cloud or bubble-bubble interaction dynamics | The bubbly liquid is described by the average governing equations. | (Lu et al., 1990; Pelekasis et al., 2004; Yoon et al., 1991; Commander and Prosperetti, 1989; Allen et al., 2003; Leroy et al., 2005; Druzhinin et al., 1996; Karpov et al., 2003; Sarkar and Prosperetti, 1993) |
| p: constrained bubble cloud or bubble-bubble interaction dynamics | Image theory is utilized to solve the modified Rayleigh-Plesset equations. | (Payne et al., 2005; Bremond et al., 2006; Hamilton et al., 2005) |
The fundamental equations of bubble dynamics were developed by Rayleigh and Plesset (Rayleigh, 1917; Vokurka, 1985; Plesset and Prosperetti, 1977; Plesset, 1949) (Table 2a), neglecting liquid compressibility effects and assuming that the gas pressure in the bubble is uniform and obeys the polytropic law, which is given by:
| (1) |
where R0 is the bubble radius at equilibrium, Ṙ and R̈ represent respectively the first- and second-order time derivatives of the bubble radius R, p0 is the hydrostatic pressure, pi(t) is the incident ultrasound pressure in the liquid at an infinite distance, pg (t) is the uniform gas pressure within the bubble and ρ,σ and η are the density, surface tension and viscosity of the bulk fluid, respectively. A historical review of the development of this equation was given by Plesset and Prosperetti (Plesset and Prosperetti, 1977). The gas pressure within the bubble depends on the volumetric change with respect to its equilibrium state and heat diffusion across the bubble wall (Prosperetti et al., 1988). The polytropic law neglects heat diffusion and relates gas pressure and bubble volume as given by:
| (2) |
where κ is the polytropic exponent, R0 is bubble equilibrium radius. If the thermal diffusion length in the gas is greater than the bubble radius, the bubble will behave isothermally (i.e. κ ≈ 1). However, if the thermal diffusion length in the gas is much smaller than the bubble radius and bubble radius is much less than the wavelength of sound in the bubble the bubble will behavior adiabatically (ie., κ ≈ γ, the specific heat ratio of the gas within the bubble) (Prosperetti, 1982a).
Using a small-amplitude oscillation assumption, the Rayleigh-Plesset equation has been widely applied to study many aspects of bubble dynamics such as bubble natural frequency, acoustic scattering characteristics, thermal damping effects (Devin, 1959; Fanelli et al., 1981; Vokurka, 1985; Dejong et al., 1994b; Dejong et al., 1992; Prosperetti, 1975; Miller, 1981; Strasberg, 1956; Gaunaurd and Uberall, 1978; Sage et al., 1979; Allen et al., 2001; Hu et al., 2004; Tsamopoulos and Brown, 1983, 1984; Feng and Leal, 1994) (Table 2b and c). Taking into account of the effect of the surface tension, the Minnaert expression for bubble resonance frequency can be given by (Minnaert, 1933; Miller, 1981):
| (3) |
The emitted ultrasound pressure at distance r from the bubble center is
| (4) |
As verified by numerous experiments, the Rayleigh-Plesset equation works well when the Mach number (the ratio of the velocity of the bubble wall to the sound speed in the liquid, Ṙ/c) is small (Putterman et al., 2001). However, when the incident pressure amplitude increases, the Mach number approaches unity and sound radiation and liquid compressibility become important. For higher pressure amplitudes and larger radial oscillation, extensions of the Rayleigh-Plesset equation have been proposed, including the Keller equation, the Herring equation and the Gilmore equation (Prosperetti and Lezzi, 1986; Prosperetti, 1987; Lezzi and Prosperetti, 1987; Keller and Kolodner, 1956; Keller and Miksis, 1980; Prosperetti et al., 1988; Trilling, 1952; Brenner, 1995; Gilmore, 1952; Barber et al., 1997; Lofstedt et al., 1995) (Table 2d). Prosperetti et al (Prosperetti et al., 1988; Prosperetti and Lezzi, 1986) demonstrated that there is a one-parameter family of equations to describe bubble oscillation in unbounded liquids, namely:
| (5) |
where λ is an arbitrary parameter that preserves the first order of accuracy of the equation and pB (t) is the liquid pressure on the external side of the bubble wall, which depends on the internal bubble gas pressure on the wall:
| (6) |
Setting the parameter λ equal to 0 recovers the Keller equation (Keller and Kolodner, 1956; Keller and Miksis, 1980), and λ equal to 1 results in the Herring and Trilling equation (Trilling, 1952). The effects of other factors such as non-uniform pressure within the bubble and heat and gas transfer between the bubble and liquid have also been extensively examined (Table 2e, f and g). The Keller-like equation written in terms of the enthalpy has been verified by extensive experimental results and demonstrated to yield results that are in agreement with full partial differential equation numerical simulations (Prosperetti and Lezzi, 1986; Lezzi and Prosperetti, 1987; Lin et al., 2002).
Ultrasound contrast agents typically have a shell with a thickness from ten to hundred nanometers, motivating studies of the effects of bubble shell viscosity and elasticity (Table 2h). Roy and his co-workers first treated the bubble shell as a simple viscous liquid and found good agreement between model predictions and in vitro experimental measurements of the cavitation threshold (Roy et al., 1990). De Jong and his co-workers later (Dejong et al., 1994a, b; Dejong and Hoff, 1993; Dejong et al., 1992) modeled bubble shells as layers of elastic solids and studied acoustic attenuation and backscatter and nonlinear oscillation, validated by experimental results.
Models that include shell properties using classical mechanical principals have been developed. Church (Church, 1995) derived a Rayleigh-Plesset-based equation describing the dynamics of encapsulated gas bubbles, assuming that that coating material is a layer of an incompressible, viscous-elastic solid. Hoff et al (Hoff et al., 2000) then developed a model using viscous and elastic properties of the shell to describe polymeric microbubble behavior. Modified Rayleigh-Plesset equations have been developed for thin and thick viscoelastic-shelled agents, examining shell viscosity and elasticity effects (Allen et al., 2002; Morgan et al., 2000). These equations were validated by direct comparison of the predicted bubble radius with optically-measured streak images (Allen et al., 2002; Morgan et al., 2000). For a gas bubble encapsulated by a layer of viscous-elastic solid shell or viscous liquid shell, the Rayleigh-Plesset-based equations derived by (Church, 1995; Allen et al., 2002) can be written in a simple formula as:
| (7) |
where R1 is the inner radius of the agent; R2 is its outer radius; R10 is its inner radius at equilibrium status; σ1 is the surface tension at the inner radius, σ2 is the surface tension at the outer radius, ρs is the shell density. Gs equals the Lame constant (the modulus of rigidity) if the agent is a elastic solid shell (Church, 1995) and Gs equals 0 for a viscous liquid shell (Allen et al., 2002).
While the above discussion demonstrates that substantial effort has been applied to the development of models for shelled microbubbles, accurately representing the shell properties before and after insonation continues to be a challenging problem. Given the small thickness of the shell (typically nanometers) and small diameter of the bubble (typically microns), evaluating the mechanical properties of the shell material in situ is challenging. Moveover, the molecular scale properties of lipid membranes cannot be simply incorporated within models that describe only the radial component of oscillation. Lipid molecules self-assemble at the gas-liquid interface. When the lipid membrane is compressed (as might be expected during the compressional half-cycle), the monolayer can reversibly buckle or shed lipid into solution (Ridsdale et al., 2001). During rarefaction, the lipid membrane expands, potentially leaving patches of uncoated gas-liquid interface. Application of the classical mechanic theory for these scenarios is very limited. Therefore specialized approaches for each shell material are required. Further, in order to translate these models to a blood and tissue environment, investigations of the effect of tissue elasticity and non-uniform blood viscosity on oscillations of ultrasound contrast agents have been undertaken and efforts have also been made to develop theoretical models for radial oscillations of gas bubbles in non-Newtonian liquids (Table 2i).
After intravenous bolus injection, low amplitude ultrasound pulses can be administered to deflect the drug-coated bubbles toward the blood vessel wall and facilitate imaging or drug delivery. A model was developed to predict the radial oscillation and simultaneous translational displacement of an encapsulated gas bubble after insonation by clinically-applicable megaHertz ultrasound pulses (Dayton et al., 2002; Zhao et al., 2004) (Table 2j). As with the free bubble, the translational displacement of the shelled bubble was shown to be determined by the combination of the driving force, the translational added mass, the oscillatory added mass and the quasistatic drag force.
Oscillations of ultrasound contrast agents within the blood pool are constrained by blood vessels, and this effect is greatest within small vessels. The boundary can be simplified and image theory or boundary integral methods then applied in order to calculate bubble oscillations (Table 2k). This simplification works well when the ratio of bubble diameter to the tube diameter is small. Alternatively, a bubble oscillating within a small tube has been described by analytical approximations (Hu et al., 2005; Yuan et al., 1999) or by numerical computations (Ory et al., 2000; Qin and Ferrara, 2006; Qin et al., 2006; Ye and Bull, 2006; Qin and Ferrara, 2007), (Table 2l). Our investigation has demonstrated that oscillations of a bubble within a small vessel depend on the vessel and bubble diameter and mechanical properties of vessel and connecting tissues (Qin and Ferrara, 2006, 2007). The natural frequency of the bubble within a small rigid vessel is substantially decreased with decreasing vessel size. However, for the same sized vessels, the natural frequency of a bubble increases with decreasing vessel rigidity (Qin and Ferrara, 2007). For a bubble constrained in a small vessel, the non-radial component of oscillation is significant (Hu et al., 2005; Qin and Ferrara, 2006) (Figure 4) and should be included as the effect of the oscillation on the vessel wall is evaluated. With a transmitted PRP of 0.5 MPa and a center frequency of 1 MHz, the expansion of a microbubble (with an initial diameter of 3 μm) within a compliant vessel (of diameter 8 μm) can dilate the vessel wall by a distance as large as a few microns (Qin and Ferrara, 2006) (Figure 5).
Figure 5.
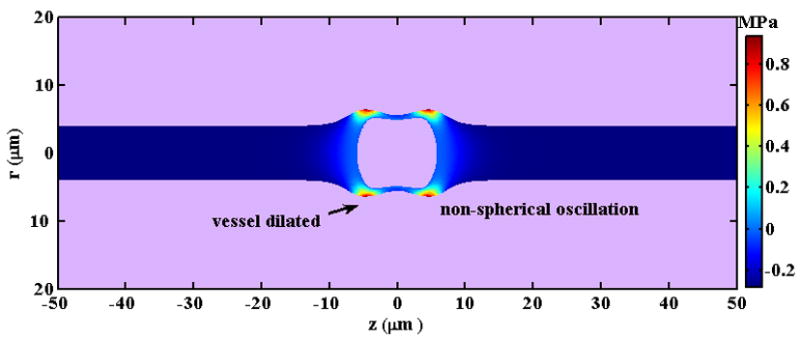
A snapshot of the predicted pressure field induced by a microbubble with an initial diameter of 3 μm as it oscillates in a microvessel with inner diameter of 8 μm in an ultrasound field with a PRP of 0.5MPa and center frequency of 1MHz.
In drug delivery, the ultrasound pressure (PRP > 0.5 MPa) can be substantially larger than the pressure used in traditional imaging (PRP ~50 kPa). When insonified by a high ultrasound pressure, bubbles become unstable, rapidly collapse and fragment; thus, models for stability and mode analysis are summarized in Table 2m-3n. Further, given that drug delivery studies often use high microbubble concentrations, models of bubble-bubble interaction, bubble-bubble-vessel interaction and bubble cloud/density effects have been developed (Table 2o-3p), often requiring substantial computational resources to solve partial differential equations. In limited cases, solutions have been obtained assuming a uniform formulation or using image theory.
In summary, understanding and accurately predicting microbubble oscillation in vivo is a challenging problem. While a great deal of progress has been made in accurately representing the radial oscillation of the shelled microbubble in an infinite fluid, still refinements and improvements of such models continue, e.g. (Doinikov and Dayton, 2006). Moreover, modeling of nonlinear and aspherical oscillation, modeling of bubble clouds and modeling of bubble interaction with neighboring cells and vessel walls require additional development. Therefore, gaining a perspective on the hierarchy of approaches to this problem (as in Table 2) can be of value.
4. Microbubble-based imaging techniques
Echoes from microbubbles change in response to the frequency, amplitude or phase of the ultrasound pulse as a result of changes in wall velocity and acceleration, as well as microbubble destruction. Design of microbubble imaging strategies (Table 3 and Figure 6) includes the choice of the center frequency, bandwidth, pressure and phase of each individual pulse, but also involves the design of a pulse train incorporating multiple pulses for which these parameters are altered between pulses, in order to facilitate the discrimination of microbubble and tissue echoes.
Table 3.
Microbubble contrast agent imaging strategies
| Transmitted pulse | Radiofrequency (fast-time) filter | Pulse-to- pulse (slow- time) filter | Reference | |
|---|---|---|---|---|
|
Single pulse strategies | ||||
| Harmonic (Narrowband) | Multicyle pulse with a center frequency near the microbubble resonance and low amplitude | High pass | N/A | (Villanueva, 1995) |
| Transient (Wideband) | Single cycle pulse with a center frequency of ~ 2MHz and PRP of ~200- 500kPa | High pass | N/A | (Kruse and Ferrara, 2005) |
| Subharmonic | Multicyle pulse with a center frequency either near the microbubble resonance or a multiple of resonance | Low pass | N/A | (Cheung et al., 2008; Chomas et al., 2002; Forsberg et al., 2000; Shankar et al., 1998; Shi et al., 1999) |
| Coded excitation | Many possible codes | Many possible filtering methods | Can be extended to multi-pulse strategy | (Borsboom et al., 2004; Borsboom et al., 2005; Gong et al., 2007; Sun et al., 2007) |
|
Low power multipulse strategies | ||||
| Harmonic Power Doppler | Sequential pulses as in the harmonics above | High pass | High pass (difference between returns) | (Senior et al., 2000; Simpson et al., 2001; Bauer et al., 1999; Chang et al., 1995) |
| Phase Inversion | Sequential harmonic or transient pulses with phase shift between transmission | Often high pass but not required | Low pass (sum of returned echoes) | (Graubner et al., 1997; Burns et al., 2000; Harvey et al., 2000a; Harvey et al., 2000b; Morgan et al., 1998) |
| Dual frequency- radial modulation | Sequential or simultaneous transmission of harmonic pulses with varied center frequency | Low pass | (Chen et al., 2006b; Masoy et al., 2008; Cherin et al., 2008) | |
| Power modulation | Sequential pulses differing in pressure amplitude | Not required | Scale and subtract | (Porter et al., 2003; Brock-Fisher and Prater, 2006) |
| CPS | Sequential pulses differing in pressure and phase | Not required | Low pass (sum of returned echoes) | (Phillips and Gardner, 2004; Solbiati et al., 2004; Stieger et al., 2008). |
|
High power multipulse strategies | ||||
| Destruction- reperfusion | Train of similar pulses is transmitted | Varied | Loss of correlation or changes in echo amplitude are assessed | (Wei et al., 1998; Wei et al., 2001a; Wei et al., 2001b; Chomas et al., 2003; Krix et al., 2004; Potdevin et al., 2004; Dijkmans et al., 2004) |
Figure 6.
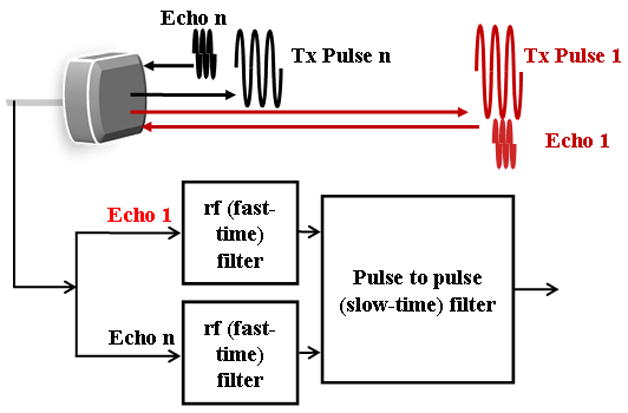
Diagram of the generation and processing of contrast agent echoes for the creation of images, corresponding to the entries in Table 3. The detection of echoes from microbubble contrast agents may be accomplished by processing the returned echo from a single pulse or the returned echoes from a train of ultrasound pulses.
Early contrast agent imaging techniques were based on the detection of the harmonics returned from each pulse (Schrope and Newhouse, 1993; Villanueva, 1995). With single pulse detection techniques, each echo is filtered as it is received in order to remove frequency components outside the desired harmonic or subharmonic band (Shankar et al., 1998; Shi et al., 1999; Chomas et al., 2002; Forsberg et al., 2000; Cheung et al., 2008). Such filtering of the radiofrequency pulse is also known as fast time processing, as each pulse is processed as it is received (Figure 6). For harmonic and subharmonic strategies, a narrowband pulse is typically transmitted in order to minimize the spectral overlap between the transmitted and received pulses. Subharmonic strategies can employ the transmission of a pulse centered at the resonance frequency of the microbubble or at a multiple of the resonance frequency (Chomas et al., 2002). Transmission of a pulse centered at twice the resonance frequency results in resonant oscillation of the microbubble (and thus an apparent subharmonic), even with a low transmission pressure.
Alternatively, transmission of a short (single cycle) pulse, with a sufficiently high pressure (>250 kPa) and with rarefaction preceding compression, results in a rapid microbubble collapse and wideband echo and can be used for single-cycle “transient” contrast imaging (Kruse and Ferrara, 2005). Coded pulse transmissions involving linear or nonlinear frequency modulation have also been explored, where the differences in the received echoes resulting from microbubbles and tissue are exploited to further improve the signal to noise ratio (Borsboom et al., 2004; Borsboom et al., 2005; Borsboom et al., 2003; Gong et al., 2007; Sun et al., 2007). Mixing low frequency and high frequency transmission to modulate the diameter of the microbubble has also been explored (Bouakaz et al., 2007; Chen et al., 2006b; Masoy et al., 2008; Cherin et al., 2008).
When multiple pulses are transmitted and received, each pulse can be filtered to tailor the receive bandwidth, again removing frequency components that correspond to frequencies within the transmitted pulse. In addition, pulse to pulse filtering is applied to the echoes corresponding to a fixed depth, in order to further improve the discrimination of tissue and bubble echoes. This filter is typically called a slow-time filter. Following the transmission of a train of identical pulses, a high-pass pulse-to-pulse filter can reject echoes from fixed tissue and increase the sensitivity to moving microbubbles; such processing is typically known as power Doppler processing. Combining fast-time and slow-time high pass filters produces harmonic power Doppler processing, frequently used for perfusion imaging (Senior et al., 2000; Simpson et al., 2001; Bauer et al., 1999; Chang et al., 1995). Disadvantages of this technique include limitations on the detection of capillary perfusion due to the very slow capillary flow.
Low-amplitude pulse trains used in contrast imaging involve the transmission of pulses with altered phase (Graubner et al., 1997; Burns et al., 2000; Harvey et al., 2000a; Harvey et al., 2000b; Morgan et al., 1998), amplitude (Porter et al., 2003; Brock-Fisher and Prater, 2006) or both phase and amplitude (Phillips and Gardner, 2004; Solbiati et al., 2004; Stieger et al., 2008). Summation of the returned echoes cancels the return from stationary tissue, while again preserving sensitivity to microbubble echoes. An advantage of the use of such pulse trains is the elimination of the requirement for the radiofrequency (fast-time) filter. Given the limited bandwidth of current transducers, elimination of this requirement can potentially increase the signal-to-noise ratio of the measurement (effectively using the entire received bandwidth). An example of the gray-scale image of a murine tumor is presented in Figure 7a, where the tumor is circled in red, with a hypoechoic gray scale. An image of the contrast agent echoes, estimated with the Contrast Pulse Sequence (CPS) developed by Siemens Medical Solutions (MountainView, CA) can then be overlaid on the gray-scale image (Figure 7b). The spatial variation in contrast agent density in such images correlates with the tumor morphology and density of viable tumor cells, as estimated during histology using hematoxylin and eosin (Chomas et al., 2003; Broumas et al., 2005).
Figure 7.
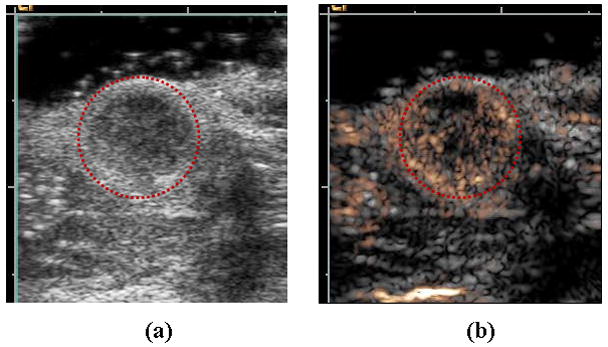
Examples of ultrasound contrast agent images of Met-1 murine tumor. (a) B-mode and (b) corresponding Contrast Pulse Sequence (CPS) (gold color) image overlaid on B-mode (grey). Region of low echogenicity in B-mode image (circled in red) is region of tumor, with vascular density shown by the gold contrast agent overlay.
The blood flow rate is estimated in contrast ultrasound by combining high-amplitude pulse transmissions, designed to destroy the contrast agent, with pulses designed to estimate the replenishment of microbubbles into the region of interest (Wei et al., 1998; Wei et al., 2001a; Wei et al., 2001b; Chomas et al., 2003; Krix et al., 2004; Potdevin et al., 2004; Dijkmans et al., 2004). A parametric image of the time required for contrast replenishment within a region can then be created, noting that the flow rate will vary across the image (Chomas et al., 2003). Each color-encoded pixel represents an estimate of the contrast replenishment rate for a small region. Depending on the center frequency of the ultrasound imaging pulses, the spatial resolution of each estimate is on the order of hundreds of microns to millimeters. Within cancerous tumors, the flow of the contrast agent is not always continuous. Therefore, estimating the variations in flow rate with time can be of value (Chomas et al., 2003). Chomas et al color-coded regions that did not maintain a consistent flow rate over time with a distinct color marker (red).
4.1 Imaging applications
Microbubble contrast imaging has found many applications in cardiology, including the assessment of wall motion abnormalities and perfusion defects, with the clinical aspects described recently (Kaufmann et al., 2007; Kaul, 2008). Radiology applications focus on cancer and peripheral vascular disease, where the estimation of microvascular density and flow rate are particularly important. Ultrasound is an ideal technique to use in serial studies of drug therapies, e.g. anti-angiogenic treatment (Tang et al., 2003). Although contrast-enhanced grey scale imaging techniques (such as pulse inversion, power modulation and CPS) are widely used and the use of ultrasound to monitor drug therapies is important (Lucidarme et al., 2004; Forsberg et al., 2002), quantitative measures are not yet validated for clinical studies but are currently of great interest. The development of an accepted ultrasound measurement of vascularity or flow rate would be of great value for basic science and clinical studies.
4.2. Targeted, lipid-shelled microbubbles and their detection
Lipid-shelled microbubble stability is enhanced by polymer-grafter lipids, with concentrations of 5–9 molar percent of polyethylene glycol typically used. Targeting ligands are then attached to the distal end of a polymer either before or after microbubble generation. Large proteins are typically attached after the contrast agent is formed due to the increased temperature and agitation used in the formation of the microbubble; peptides and other small molecules can be attached beforehand. A large number of ligands are typically required to insure adequate coverage, given the large (micron-diameter) size of the microbubble. A biotin-streptavidin linkage is used most commonly to attach the targeting ligand to the lipid shell (Klibanov, 2005; Lanza and Wickline, 2001).
Klibanov et al. originally demonstrated the in vitro use of targeted microbubbles by studying microbubbles adherent to avidin-coated petri dishes (Klibanov et al., 1997; Klibanov et al., 1998). More recently, targeted agents have been shown to successfully detect inflammation, transplant rejection, and atherosclerosis (Nakashima et al., 1998; Jian-Guo et al., 2004; Lindner et al., 2001; Weller et al., 2003). Angiogenesis has been the most common application for targeted contrast agents with peptide and antibody-based strategies, as well as dual imaging techniques reported (Ellegala et al., 2003; Stieger et al., 2008; Weller et al., 2005; Lee et al., 2008; Willmann et al., 2008).
Most reports of imaging with targeted microbubbles have involved observation of the entrance of the microbubbles to the field of view followed by an assessment of the image intensity over time, culminating with a destructive pulse. The signal amplitude following the destructive pulse is assumed to represent circulating agents and that before the destructive pulse is assumed to include circulating plus bound agents (Ellegala et al., 2003; Lindner et al., 2001; Stieger et al., 2008). The development of new techniques to detect targeted agents is an area of intense study where radiation force and changes in spectral characteristics can enhance the detection of bound bubbles.
5. Effect of contrast agents on tissue/vasculature
The mechanism for the vascular permeability enhancement observed with ultrasound contrast agents is a subject of active research by multidisciplinary groups, including physicists, engineers and biologists. Here, common acoustic parameters and bubble properties known to enhance permeability are examined while considering the in vivo environment of the bubble. Changes in microbubble oscillation due to insonation frequency, PRP, pulse duration, pulse repetition frequency, contrast agent dosage, size, and shell properties are each considered.
5.1 Targets and Barriers for Delivery with Ultrasound Contrast
Regardless of function, a drug must overcome many of the body’s natural barriers in order to be effective. Ultrasound contrast agents circulate for an interval that is typically on the order of minutes. Once bubbles have reached the target site, ultrasound can be applied to locally increase permeability. Therefore, sufficient contrast agent density and an acoustic window from the transducer to the target site are two requirements for drug delivery with ultrasound contrast agents. The brain, heart, pancreas and many thrombi and cancerous tumors meet these requirements and have been targets of ultrasound-enhanced delivery strategies (Choi et al., 2007; Bekeredjian et al., 2003; Chen et al., 2006a; Tsutsui et al., 2006; Tartis et al., 2006).
In an idealized vascular network, blood flows successively through large arteries, small arteries, arterioles, capillaries, post-capillary venules, venules, small veins, and large veins (Berne, 2004). Exchange of molecules from the blood to organs generally occurs in the capillaries and post-capillary venules (diameters of approximately 4–8 μm). Once in these small vessels, a molecule must move beyond the vascular endothelium into the interstitial space for successful delivery to the organ of interest (illustrated in Figure 8). Capillaries can be grouped into three types in the human body: continous capillaries, fenestrated capillaries, and sinusoids. A continuous capillary has immediately adjacent endothelial cells that create a continuous and uniform barrier overlaid on the basement membrane. These are typically found in skin, connective tissues, striated and smooth muscle, lung and brain. Fenestrated capillaries are found in the renal glomeruli, the intestinal villi, endocrine glands, and the pancreas. The cytoplasm of cells on each side of the nuclear region is thin (40–60 nm) and is perforated at intervals by a system of ‘pores’ which vary greatly in number and size (their diameters may range from 30 to 100 nm). It is possible that the presence of pores in fenestrated capillaries may make endocrine glands and kidneys more susceptible to mechanical effects of contrast agents, whereas continuous capillaries surrounded by connective tissue may present a more robust boundary. The sinusoids are found in tissues such as bone marrow, spleen, liver, suprarenal/parathyroid glands, carotid and coccygela bodies. Sinusoids tend to be larger (often larger than 10 μm), have a wider, irregular lumen and very thin wall and can be continuous or fenestrated (Strandring, 2005). The diameter and composition of the surrounding vessel affects microbubble oscillation amplitude and frequency (where oscillation was described in Section 3 of this review) and therefore the differences between capillary types are expected to alter the threshold for biological effects.
Figure 8.

Hypothesized mechanisms of drug transport across endothelium. Illustration of (a) local shear stress created on cell during microbubble oscillation, (b) fluid jet formation, and (c) intra-cellular transport that are hypothesized to result from the stresses induced by microbubble activity, including generation of gaps at tight junctions, expression of cell adhesion molecules due to inflammatory process and the creation of vesicles for trans-cellular transport.
Another important variable for delivery is the composition of the interstitial space in the organ. Fung et al. have suggested that capillaries derive their structure from the surrounding organ, so that the capillaries can be viewed as a tunnel in a gel (Fung, 1993). Considering the wide variation of Young’s modulus values in tissues, one might expect tissues with higher elastic modulus, such as muscles, to present a more rigid boundary beyond the endothelial cells than an organ with a lower Young’s modulus, such as the kidneys. In vitro studies support this hypothesis-- rigid PMMA tubes with a diameter of 12 μm significantly constrain microbubble oscillation, while oscillation is less constrained in ex vivo vessels with a smaller rigidity than PMMA tubes (Caskey et al., 2006; Caskey et al., 2007).
5.2 Important parameters and their impact on delivery and biological effects
Transmission Frequency and PRP
Mechanical index (MI), a commonly displayed parameter on ultrasound systems, is defined as the derated PRP in megaPascals (at the point of the maximum pulse intensity integral) divided by the square root of the ultrasonic center frequency in megaHertz. The upper limit for MI was chosen to be consistent with the acoustic output produced by ultrasound systems prior to 1976, where a guideline for MI in the absence of a microbubble contrast agents is 1.9 (Meltzer, 1996). However, MI was created prior to the widespread use of microbubble contrast agents and therefore did not envelope the full parameter space and mechanisms of biological effects associated with these agents.
The threshold for cavitation has long been known to be substantially reduced in the presence of gas bodies; the mechanical index threshold for hemorrhage in mouse lung was observed to be 0.4 (Frizzell et al., 1994). More recently, Church and O’Brien proposed a new index for acoustic output for imaging near the lungs, including pulse duration and pulse repetition frequency, in addition to the parameters described in the traditional MI (Church and O’Brien, 2007).
Defining a relationship between acoustic pressure and center frequency that is predictive of biological effects in the presence of contrast agents is under study, with several recent papers proposing the ratio of acoustic pressure and center frequency (Qin and Ferrara, 2006; Miller et al., 2008). A limited number of studies have used clinical ultrasound systems or relevant parameters together with a clinically-relevant ultrasound dose. One such recent paper by Miller et al. examined the dependence of frequency and PRP on the occurrence of glomerular capillary hemorrhage (GCH), demonstrating that constant values of the ratio of PRP to the transmitted center frequency yielded a consistent effect. A threshold of 0.5 (for PRP/frequency) was predictive of hemorrhage in the rat kidney (Figure 9a and 9b) (Miller et al., 2008). Using 1 and 2.25 MHz, Stieger et al. reported that the occurrence of extravasation of FITC-labeled dye in the chorioallantoic membrane model demonstrated a similar dependence (on PRP/frequency), with an apparent threshold of approximately 0.6 (Stieger et al., 2007). These observations are supported by theoretical simulations that indicate that the frequency dependence of circumferential stress on a small compliant vessel scales with the ratio of PRP to center frequency, rather than mechanical index (Qin and Ferrara, 2006). The absolute threshold value (for the PRP/frequency ratio) may be greater in human studies due to microbubble-filled intervening tissue and species and tissue-dependent microvascular characteristics. However, the relationship between pressure, frequency and circumferential stress is generally applicable.
Figure 9.
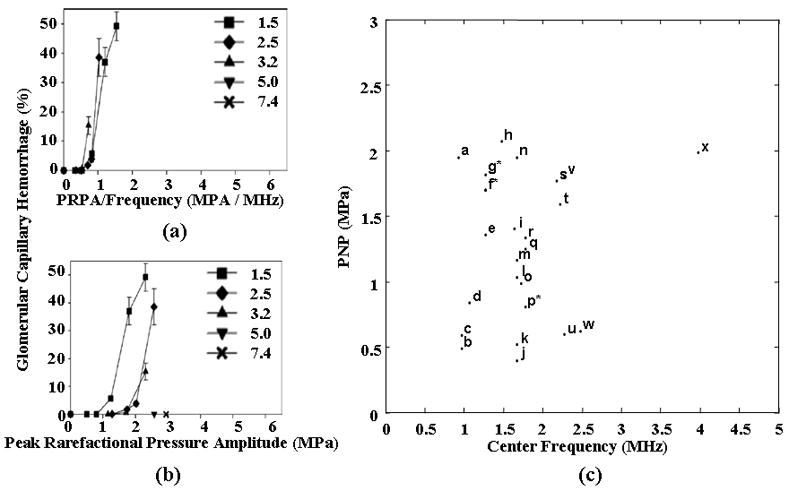
(a) Glomerular capillary hemorrhage vs the ratio of PRP to center frequency for a range of transmitted ultrasound frequencies using a diagnostic ultrasound scanner to insonify the rat kidney. Reproduced with permission from (Miller et al., 2008) (b) Glomerular capillary hemorrhage vs PRP for a range of transmitted ultrasound frequencies using a diagnostic ultrasound scanner to insonify the rat kidney. Reproduced with permission from (Miller et al., 2008) (c) Survey of transmission frequencies and PRP observed in literature. Asterisk indicates multiple studies using same parameter. a: (Lawrie et al., 2000), b: (Stieger et al., 2007), c: (Endoh et al., 2002), d: (Miller and Gies 1998), e: (Chen et al., 2002), f*: (Shohet et al., 2000; Vannan et al., 2002; Bekeredjian et al., 2003; Bekeredjian et al., 2005; Guo et al., 2004), g*: (Frenkel et al., 2002; Chen et al., 2003), h: (Miller et al., 2005), i: (van Der Wouw et al., 2000), j: (Li et al., 2004), k: (Li et al., 2003), l: (Chapman et al., 2005), m: (Pislaru et al., 2003), n: (Kobayashi et al., 2003), o: (Christiansen et al., 2003), p*: (Kobayashi et al., 2003; Kobayashi et al., 2002), q: (Wible et al., 2002), r: (Ay et al., 2001), s: (Teupe et al., 2002), t: (Stieger et al., 2007), u: (Skyba et al., 1998), v: (Miller and Gies, 2000), w: (Miller and Quddus, 2000), x: (Wible et al., 2002)
Surveying the microbubble-induced bioeffects and gene delivery literature, without regard to injected dose and pulse length, yields a broader range of the dependence of observed biological effects on PRP and center frequency (Figure 9c). Many of the studies summarized in Figure 9c used high dosages of the contrast agent Optison and high pulse duty cycles and therefore one must carefully assess the dosage and ultrasound parameters used in each study. Here, subsequent sections discuss pulsing parameters and dosage and contrast agent type.
Pulse Duration/Duty Cycle
The threshold for microbubble fragmentation has been described by Chomas et al (Chomas et al., 2001b; Stieger et al., 2008). However, secondary radiation forces produced by the ultrasound wave facilitate fusion of the fragmented microbubble during continuous insonation. Thus, the microbubble can repeatedly fragment and re-combine during a pulse and is more likely to remain as a set of discrete fragments after or between pulses. Therefore, pulse duration and duty cycle are important parameters for drug delivery sequences and the induction of biological effects; however, these parameters cannot typically be independently varied on a clinical ultrasound system.
B-mode imaging sequences use short pulses (on the order of microseconds) and a PRF in the kiloHertz range, while other modes, such as CW Doppler, emit a continuous pulse. Many reports of biological effects or drug delivery have not fully reported all parameters (often reporting only the time-averaged ultrasound intensity) and this uncertainty makes rigorous evaluation of these studies difficult. However, it is clear that successful, fully-documented, drug delivery studies employing a long pulse (or high duty cycle) have been reported.
In studies designed to deliver drugs across the blood-brain barrier (BBB), with a 1.5-MHz center frequency, pulse durations of 10 μsec (with a PRF of 1 kHz) and 10 msec (with a PRF of 10 Hz) were compared (achieving a similar time-averaged acoustic intensity) (Treat et al., 2007; Hynynen et al., 2003). The PRP threshold for the 10 μsec pulse was found to be approximately 6.3 MPa, compared to 1.1 MPa for the longer acoustic pulse (Treat et al., 2007; Hynynen et al., 2003); therefore, a longer pulse had a greater effect even with an identical duty cycle. These studies were performed in two different species (rat and rabbit); however, the threshold for BBB disruption has previously been reported to be similar between these two species [(Hynynen et al., 2001; Treat et al., 2007)]. Furthermore, McDannold et al. have shown that the threshold for BBB disruption decreases from 0.7 to 0.4 MPa when increasing pulse length from 0.1 to 10 msec (Mcdannold et al., 2008) (Figure 10a).
Figure 10.
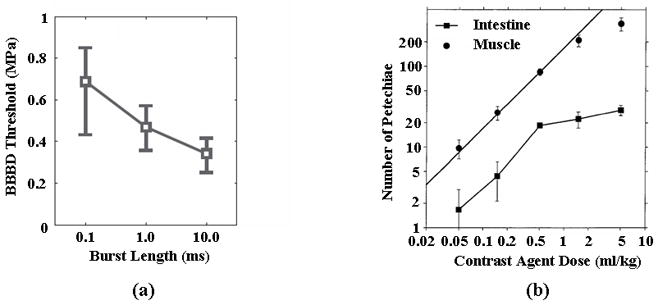
Effect of burst length and contrast agent dose on threshold for biological effects. (a) Effect of burst length on the threshold for blood brain barrier (BBB) disruption. Reproduced with permission from (Mcdannold et al., 2008). (b) Occurrence of petechial hemorrhage as a function of Optison dosage in the mouse intestine and muscle. Reproduced with permission from (Miller and Quddus, 2000).
A similar effect has been noted in our laboratory (unpublished data) where the threshold for disruption of a gel boundary decreased from 2.5 MPa to 1.2 MPa with pulse duration increasing from 10 μsec to 10 msec. In these experiments, the PRF was modified so that the time-averaged acoustic intensity was matched. Shorter pulses can also be efficacious; many studies have shown successful permeability enhancement using pulses with lengths in the microsecond range (Stieger et al., 2007; Wible et al., 2002; Miller and Gies, 1998). However, there are advantages to longer pulses as lower acoustic pressures can be used for therapeutic effects, avoiding potential issues associated with high PRPs, such as unintentional cavitation.
Time Between Destructive Pulses
Typically, the estimation of microvascular flow rate uses high-amplitude destructive pulses separated by seconds, together with low-amplitude imaging pulses separated by hundreds of microseconds. In order to accurately estimate flow rate, time for microbubbles to re-fill the region of interest must be allowed between “destructive” pulses.
Wible et al. showed that a 30 frame-per-second rate decreased renal hemorrhage as compared with a 1 frame-per-second rate (transmitted center frequency of 1.8 MHz, MI of 1.6). At the higher frame rate, microbubbles have insufficient time to reach the capillaries of the kidney and instead are destroyed in larger vessels (Wible et al., 2002). Similarly, Miller and Quddus found that 10 sec of continuous insonation yielded a similar number of petechial hemorrhages as a 100 sec continuous insonation; however, hemorrhages increased when they performed 10 insonations with durations of 10 sec at a pulse repetition frequency of 0.1 Hz. Thus, although the 10 × 10 sec insonation contained the same number of acoustic cycles as a 100 second insonation, the effect on the surrounding tissue increased. The authors hypothesize that the 10-sec delay between pulses allowed for the entry of fresh contrast agents (Miller and Quddus, 2000).
Contrast Agent Size Distribution and Shell Parameters
Increased resting microbubble diameter is hypothesized to increase the interaction of microbubbles with the endothelium (Caskey et al., 2007). The efficacy of microbubble-enhanced gene delivery has been compared for two albumin-shelled agents, Optison and PESDA. PESDA has a greater fraction of bubbles in the 6–10 μm range (90th percentile at 8.3±2.9 μm for PESDA vs. 6.7±0.7 μm for Optison; P is not sig.), although these agents have similar mean resting radii and shell properties. Using an insonation frequency of 1 MHz, PESDA enhanced gene delivery in vitro and in vivo to a greater extent than Optison (Pislaru et al., 2003). Similarly, the threshold for creating petechiae in the mouse intestine is reduced with PESDA compared to Optison; for a center frequency of 2.3 MHz, the threshold for PESDA was1.8 MPa and the threshold for Optison was 2.2 MPa (Miller and Gies, 2000). Hynynen et al. have compared the efficacy of Definity and Optison for delivering the MRI contrast agent Magnevist beyond the BBB. The pressure threshold for delivery for both agents was 0.4 MPa at a transmission frequency of 0.69 MHz; however, damage to the parenchyma was more prevalent with Optison than Definity using matched acoustic parameters (McDannold et al., 2007). Comparing Optison and Definity (Table 1), Optison has a larger mean diameter; the difference in shell material is not expected to significantly alter the oscillation characteristics. Lipid and albumin-shelled bubbles oscillate with a similar peak expansion and wall velocity, since the shell is very thin and does not constrain expansion for typical ultrasound parameters (Chomas et al., 2002). In our laboratory, we have observed in ex vivo rat cecum that bubbles larger than 4 μm oscillate for 176+/−139 pulses on average, compared to 31+/−14 pulses for bubble smaller than 4 μm (for a transmitted center frequency of 1 MHz, PRP of 800 kPa and 10 cycle pulses). Larger bubbles interacted with the vessel wall for a longer period of time. Bubbles typically required tens to hundreds of 10-cycle pulses to traverse from the center of the lumen of a small vessel to the endothelium wall. Bubbles smaller than 2 μm fragmented prior to reaching the endothelium and were not observed to interact with the vessel wall (Caskey et al., 2007). We have also observed that microbubbles with diameters of 9.3+/−3.4 μm are capable of producing tunnels in a gel flow phantom using a transmission frequency of 2.25 MHz, while bubbles outside this size range did not produce visible effects on the gel phantom (unpublished data). If differences due to shell material for albumin and lipid-shelled bubbles are negligible, the studies reviewed here indicate that larger microbubbles decrease the threshold for generating bioeffects.
Contrast Agent Dosage
An increasing propensity for biological effects with increasing dose is expected since the number of bubbles near boundaries increases with increased concentration. After insonation with a center frequency of 2 MHz, both lethal and reparable sonoporation of lymphocytes have been reported in a suspension of cells and an albumin-shelled microbubble at various concentrations (Ward et al., 2000). Sonoporation was observed only for limited separation distances between bubbles and cells and cell lysis reported to increase with decreasing distance between bubbles and cells (Ward et al., 2000).
In vivo and ex vivo studies of contrast-enhanced drug delivery and bioeffects utilize a very wide range of injected contrast dose--spanning 50 μL/kg to 5 mL/kg (Miller and Quddus, 2000; Mcdannold et al., 2008). The number of petechial hemorrhages were reported to be approximately proportional to contrast dosage using Optison in mouse intestine and abdominal muscle for a dosage above 1 mL/kg (Figure 10b) (Miller and Quddus, 2000). In the lower dosage range of 50–250 μL/kg, varying the Optison dose was not reported to significantly increase the MRI signal intensity in experiments designed to deliver gadolinium contrast to the brain of a rabbit (Mcdannold et al., 2008). In an ex vivo rat cecum, the infusion of a high concentration of microbubbles (>20 microbubbles per (200-μm)2 field) resulted in a small distance between the injected bubbles (Caskey et al., 2007), as shown in Figure 4. In the insonified cecum, the microbubbles then fused and the larger, fused microbubbles interacted with the vessel wall. At lower concentrations, coalescence was not observed and the microbubbles fragmented before extended interaction with the vascular endothelium (Caskey et al., 2007).
6. Conclusion
The use of microbubble contrast agents to image blood vessel density and perfusion continues to grow, with an increasing number of pulsing strategies having been identified. Combinations of unique transmitted pulses with radiofrequency and pulse-to-pulse filtering result in high target-to-background ratio images. Models for the oscillation and disruption of ultrasound contrast agents have been extensively studied and have been shown to accurately describe the oscillation of microbubble contrast agents for a varied range of parameters. Extensions to accurately model new shell materials and microbubbles located near boundaries have been reported and are expected to be extended. In small animal models, the ratio of pressure to frequency has shown promise to predict the likelihood of capillary hemorrhage; by controlling contrast dose and imaging parameters such effects should be avoidable. However, the interaction of microbubbles with tissue remains a subject of extensive theoretical and experimental studies at the current time, particularly geared to optimize local drug delivery.
Acknowledgments
We appreciate the support of NIH CA 103828 and 112356.
References
- Afanasiev KE, Grigorieva IV. Numerical investigation of three-dimensional bubble dynamics. Journal of Engineering Mathematics. 2006;55:65–80. [Google Scholar]
- Alekseev VN, Rybak SA. Gas bubble oscillations in elastic media. Acoustical Physics. 1999;45:535–40. [Google Scholar]
- Allen JS, Kruse DE, Dayton PA, Ferrara KW. Effect of coupled oscillations on microbubble behavior. Journal of the Acoustical Society of America. 2003;114:1678–90. doi: 10.1121/1.1600721. [DOI] [PubMed] [Google Scholar]
- Allen JS, Kruse DE, Ferrara KW. Shell waves and acoustic scattering from ultrasound contrast agents. IEEE Transactions on Ultrasonics Ferroelectrics and Frequency Control. 2001;48:409–18. doi: 10.1109/58.911723. [DOI] [PubMed] [Google Scholar]
- Allen JS, May DJ, Ferrara KW. Dynamics of therapeutic ultrasound contrast agents. Ultrasound in Medicine and Biology. 2002;28:805–16. doi: 10.1016/s0301-5629(02)00522-7. [DOI] [PubMed] [Google Scholar]
- Allen JS, Roy RA. Dynamics of gas bubbles in viscoelastic fluids. I. Linear viscoelasticity. Journal of the Acoustical Society of America. 2000a;107:3167–78. doi: 10.1121/1.429344. [DOI] [PubMed] [Google Scholar]
- Allen JS, Roy RA. Dynamics of gas bubbles in viscoelastic fluids. II. Nonlinear viscoelasticity. Journal of the Acoustical Society of America. 2000b;108:1640–50. doi: 10.1121/1.1289361. [DOI] [PubMed] [Google Scholar]
- Ay T, Havaux X, Van Camp G, Campanelli B, Gisellu G, Pasquet A, Denef JF, Melin JA, Vanoverschelde JL. Destruction of contrast microbubbles by ultrasound: effects on myocardial function, coronary perfusion pressure, and microvascular integrity. Circulation. 2001;104:461–6. doi: 10.1161/hc3001.092038. [DOI] [PubMed] [Google Scholar]
- Barber BP, Hiller RA, Lofstedt R, Putterman SJ, Weninger KR. Defining the unknowns of sonoluminescence. Physics Reports-Review Section of Physics Letters. 1997;281:65–143. [Google Scholar]
- Bauer A, Hauff P, Lazenby J, von Behren P, Zomack M, Reinhardt M, Schlief R. Wideband harmonic imaging: A novel contrast ultrasound imaging technique. European Radiology. 1999;9:S364–S7. doi: 10.1007/pl00014075. [DOI] [PubMed] [Google Scholar]
- Bekeredjian R, Chen S, Frenkel PA, Grayburn PA, Shohet RV. Ultrasound-targeted microbubble destruction can repeatedly direct highly specific plasmid expression to the heart. Circulation. 2003;108:1022–6. doi: 10.1161/01.CIR.0000084535.35435.AE. [DOI] [PubMed] [Google Scholar]
- Bekeredjian R, Chen S, Grayburn PA, Shohet RV. Augmentation of cardiac protein delivery using ultrasound targeted microbubble destruction. Ultrasound Med Biol. 2005;31:687–91. doi: 10.1016/j.ultrasmedbio.2004.08.002. [DOI] [PubMed] [Google Scholar]
- Berne RM, Levy NL, Koeppen BM, Stanton BA. Physiology. St. Louis, Missouri: Mosby; 2004. [Google Scholar]
- Biasi L, Tozzi A, Prospere A. Collapse of a Condensing Bubble in Compressible Liquids. Chemical Engineering Science. 1972;27:815. [Google Scholar]
- Blake JR, Keen GS, Tong RP, Wilson M. Acoustic cavitation: the fluid dynamics of non-spherical bubbles. Philosophical Transactions of the Royal Society of London Series a-Mathematical Physical and Engineering Sciences. 1999;357:251–67. [Google Scholar]
- Bloch SH, Short RE, Ferrara KW, Wisner ER. The effect of size on the acoustic response of polymer-shelled contrast agents. Ultrasound in Medicine and Biology. 2005;31:439–44. doi: 10.1016/j.ultrasmedbio.2004.12.016. [DOI] [PubMed] [Google Scholar]
- Bloch SH, Wan M, Dayton PA, Ferrara KW. Optical observation of lipid- and polymer-shelled ultrasound microbubble contrast agents. Applied Physics Letters. 2004;84:631–3. [Google Scholar]
- Borden MA, Kruse DE, Caskey CF, Zhao SK, Dayton PA, Ferrara KW. Influence of lipid shell physicochemical properties on ultrasound-induced microbubble destruction. IEEE Transactions on Ultrasonics Ferroelectrics and Frequency Control. 2005a;52:1992–2002. doi: 10.1109/tuffc.2005.1561668. [DOI] [PMC free article] [PubMed] [Google Scholar]
- Borden MA, Longo ML. Dissolution behavior of lipid monolayer-coated, air-filled microbubbles: Effect of lipid hydrophobic chain length. Langmuir. 2002;18:9225–33. [Google Scholar]
- Borden MA, Martinez GV, Ricker J, Tsvetkova N, Longo M, Gillies RJ, Dayton PA, Ferrara KW. Lateral phase separation in lipid-coated microbubbles. Langmuir. 2006a;22:4291–7. doi: 10.1021/la052841v. [DOI] [PubMed] [Google Scholar]
- Borden MA, Pu G, Longo ML, Dayton PA, Ferrara KW. Phase behavior and transport properties of the lipid-monolayer shell of a microbubble. Abstracts of Papers of the American Chemical Society. 2005b;230:U1072–U3. [Google Scholar]
- Borden MA, Sarantos MR, Stieger SM, Simon SI, Ferrara KW, Dayton PA. Ultrasound radiation force modulates ligand availability on targeted contrast agents. Molecular Imaging. 2006b;5:139–47. [PMC free article] [PubMed] [Google Scholar]
- Borsboom J, Chin CT, de Jong N. Experimental evaluation of a non-linear coded excitation method for contrast imaging. Ultrasonics. 2004;42:671–5. doi: 10.1016/j.ultras.2003.12.013. [DOI] [PubMed] [Google Scholar]
- Borsboom JMG, Chin CT, Bouakaz A, Versluis M, de Jong N. Harmonic chirp imaging method for ultrasound contrast agent. IEEE Transactions on Ultrasonics Ferroelectrics and Frequency Control. 2005;52:241–9. doi: 10.1109/tuffc.2005.1406550. [DOI] [PubMed] [Google Scholar]
- Borsboom JMG, Chin CT, de Jong N. Nonlinear coded excitation method for ultrasound contrast imaging. Ultrasound in Medicine and Biology. 2003;29:277–84. doi: 10.1016/s0301-5629(02)00712-3. [DOI] [PubMed] [Google Scholar]
- Bouakaz A, Versluis M, Borsboom J, de Jong N. Radial modulation of microbubbles for ultrasound contrast imaging. IEEE Transactions on Ultrasonics Ferroelectrics and Frequency Control. 2007;54:2283–90. doi: 10.1109/tuffc.2007.532. [DOI] [PubMed] [Google Scholar]
- Bremond N, Arora M, Dammer SM, Lohse D. Interaction of cavitation bubbles on a wall. Physics of Fluids. 2006;18:121505. [Google Scholar]
- Brenner CE. Cavitation and Bubble Dynamics. Oxford: Oxford University; 1995. [Google Scholar]
- Brenner MP, Hilgenfeldt S, Lohse D. Single-bubble sonoluminescence. Reviews of Modern Physics. 2002;74:425–84. [Google Scholar]
- Brock-Fisher GA, Prater DM. Acoustic border detection using power modulation. Koninklijke Philips Electronics N.V; 2006. [Google Scholar]
- Broumas AR, Pollard RE, Bloch SH, Wisner ER, Griffey S, Ferrara KW. Contrast-enhanced computed tomography and ultrasound for the evaluation of tumor blood flow. Investigative Radiology. 2005;40:134–47. doi: 10.1097/01.rli.0000152833.35744.7f. [DOI] [PMC free article] [PubMed] [Google Scholar]
- Brujan EA. Bubble dynamics in a compressible shear-thinning liquid. Fluid Dynamics Research. 1998;23:291–318. [Google Scholar]
- Brujan EA. A first-order model for bubble dynamics in a compressible viscoelastic liquid. Journal of Non-Newtonian Fluid Mechanics. 1999;84:83–103. [Google Scholar]
- Brujan EA. Collapse of cavitation bubbles in blood. Europhysics Letters. 2000;50:175–81. [Google Scholar]
- Brujan EA. The equation of bubble dynamics in a compressible linear viscoelastic liquid. Fluid Dynamics Research. 2001;29:287–94. [Google Scholar]
- Brujan EA, Ikeda T, Matsumoto Y. Dynamics of ultrasound-induced cavitation bubbles in non-Newtonian liquids and near a rigid boundary. Physics of Fluids. 2004;16:2402–10. [Google Scholar]
- Brujan EA, Keen GS, Vogel A, Blake JR. The final stage of the collapse of a cavitation bubble close to a rigid boundary. Physics of Fluids. 2002;14:85–92. [Google Scholar]
- Brujan EA, Nahen K, Schmidt P, Vogel A. Dynamics of laser-induced cavitation bubbles near an elastic boundary. Journal of Fluid Mechanics. 2001;433:251–81. [Google Scholar]
- Burns PN, Wilson SR, Simpson DH. Pulse inversion imaging of liver blood flow -Improved method for characterizing focal masses with microbubble contrast. Investigative Radiology. 2000;35:58–71. doi: 10.1097/00004424-200001000-00007. [DOI] [PubMed] [Google Scholar]
- Caskey CF, Kruse DE, Dayton PA, Kitano TK, Ferrara KW. Microbubble oscillation in tubes with diameters of 12, 25, and 195 microns. Applied Physics Letters. 2006;88:033902. [Google Scholar]
- Caskey CF, Stieger SM, Qin S, Dayton PA, Ferrara KW. Direct observations of ultrasound microbubble contrast agent interaction with the microvessel wall. J Acoust Soc Am. 2007;122:1191–200. doi: 10.1121/1.2747204. [DOI] [PubMed] [Google Scholar]
- Chang PH, Shung KK, Wu SJ, Levene HB. 2ND-harmonic imaging and harmonic Doppler measurements with Albunex (R) IEEE Transactions on Ultrasonics Ferroelectrics and Frequency Control. 1995;42:1020–7. [Google Scholar]
- Chapman S, Windle J, Xie F, McGrain A, Porter TR. Incidence of cardiac arrhythmias with therapeutic versus diagnostic ultrasound and intravenous microbubbles. J Ultrasound Med. 2005;24:1099–107. doi: 10.7863/jum.2005.24.8.1099. [DOI] [PubMed] [Google Scholar]
- Chen S, Ding JH, Bekeredjian R, Yang BZ, Shohet RV, Johnston SA, Hohmeier HE, Newgard CB, Grayburn PA. Efficient gene delivery to pancreatic islets with ultrasonic microbubble destruction technology. Proc Natl Acad Sci U S A. 2006a;103:8469–74. doi: 10.1073/pnas.0602921103. [DOI] [PMC free article] [PubMed] [Google Scholar]
- Chen S, Kroll MH, Shohet RV, Frenkel P, Mayer SA, Grayburn PA. Bioeffects of myocardial contrast microbubble destruction by echocardiography. Echocardiography. 2002;19:495–500. doi: 10.1046/j.1540-8175.2002.00495.x. [DOI] [PubMed] [Google Scholar]
- Chen S, Shohet RV, Bekeredjian R, Frenkel P, Grayburn PA. Optimization of ultrasound parameters for cardiac gene delivery of adenoviral or plasmid deoxyribonucleic acid by ultrasound-targeted microbubble destruction. J Am Coll Cardiol. 2003;42:301–8. doi: 10.1016/s0735-1097(03)00627-2. [DOI] [PubMed] [Google Scholar]
- Chen SG, Kinnick R, Greenleaf JF, Fatemi M. Difference frequency and its harmonic emitted by microbubbles under dual frequency excitation. Ultrasonics. 2006b;44:E123–E6. doi: 10.1016/j.ultras.2006.07.009. [DOI] [PubMed] [Google Scholar]
- Cherin E, Brown J, Masoy SE, Shariff H, Karshafian R, Williams R, Burns PN, Foster FS. Radial modulation imaging of microbubble contrast agents at high frequency. Ultrasound in Medicine and Biology. 2008;34:949–62. doi: 10.1016/j.ultrasmedbio.2007.11.017. [DOI] [PubMed] [Google Scholar]
- Cheung K, Couture O, Bevan PD, Cherin E, Williams R, Burns PN, Foster FS. In vitro characterization of the subharmonic ultrasound signal from Definity microbubbles at high frequencies. Physics in Medicine and Biology. 2008;53:1209–23. doi: 10.1088/0031-9155/53/5/004. [DOI] [PubMed] [Google Scholar]
- Choi JJ, Pernot M, Brown TR, Small SA, Konofagou EE. Spatio-temporal analysis of molecular delivery through the blood-brain barrier using focused ultrasound. Phys Med Biol. 2007;52:5509–30. doi: 10.1088/0031-9155/52/18/004. [DOI] [PubMed] [Google Scholar]
- Chomas J, Dayton P, May D, Ferrara K. Nondestructive subharmonic imaging. Ieee Transactions on Ultrasonics Ferroelectrics and Frequency Control. 2002;49:883–92. doi: 10.1109/tuffc.2002.1020158. [DOI] [PubMed] [Google Scholar]
- Chomas JE, Dayton P, Allen J, Morgan K, Ferrara KW. Mechanisms of contrast agent destruction. IEEE Transactions on Ultrasonics Ferroelectrics and Frequency Control. 2001a;48:232–48. doi: 10.1109/58.896136. [DOI] [PubMed] [Google Scholar]
- Chomas JE, Dayton P, May D, Ferrara K. Threshold of fragmentation for ultrasonic contrast agents. J Biomed Opt. 2001b;6:141–50. doi: 10.1117/1.1352752. [DOI] [PubMed] [Google Scholar]
- Chomas JE, Dayton PA, May D, Allen J, Klibanov A, Ferrara K. Optical observation of contrast agent destruction. Applied Physics Letters. 2000;77:1056–8. [Google Scholar]
- Chomas JE, Pollard RE, Sadlowski AR, Griffey SM, Wisner ER, Ferrara KW. Contrast-enhanced US of microcirculation of superficially implanted tumors in rats. Radiology. 2003;229:439–46. doi: 10.1148/radiol.2292020536. [DOI] [PubMed] [Google Scholar]
- Christiansen JP, French BA, Klibanov AL, Kaul S, Lindner JR. Targeted tissue transfection with ultrasound destruction of plasmid-bearing cationic microbubbles. Ultrasound Med Biol. 2003;29:1759–67. doi: 10.1016/s0301-5629(03)00976-1. [DOI] [PubMed] [Google Scholar]
- Church CC. The Effects of an Elastic Solid-Surface Layer on the Radial Pulsations of Gas-Bubbles. Journal of the Acoustical Society of America. 1995;97:1510–21. [Google Scholar]
- Church CC, O’Brien WD., Jr Evaluation of the threshold for lung hemorrhage by diagnostic ultrasound and a proposed new safety index. Ultrasound Med Biol. 2007;33:810–8. doi: 10.1016/j.ultrasmedbio.2006.11.006. [DOI] [PMC free article] [PubMed] [Google Scholar]
- Commander KW, Prosperetti A. Linear Pressure Waves in Bubbly Liquids -Comparison between Theory and Experiments. Journal of the Acoustical Society of America. 1989;85:732–46. [Google Scholar]
- Crum LA. Surface Oscillations and Jet Development in Pulsating Bubbles. Journal de Physique. 1979;41:285–8. [Google Scholar]
- Cui JY, Hamilton MF, Wilson PS, Zabolotskaya EA. Bubble pulsations between parallel plates. Journal of the Acoustical Society of America. 2006;119:2067–72. doi: 10.1121/1.2172545. [DOI] [PubMed] [Google Scholar]
- Dayton P, Klibanov A, Brandenburger G, Ferrara K. Acoustic radiation force in vivo: A mechanism to assist targeting of microbubbles. Ultrasound in Medicine and Biology. 1999a;25:1195–201. doi: 10.1016/s0301-5629(99)00062-9. [DOI] [PubMed] [Google Scholar]
- Dayton PA, Allen JS, Ferrara KW. The magnitude of radiation force on ultrasound contrast agents. Journal of the Acoustical Society of America. 2002;112:2183–92. doi: 10.1121/1.1509428. [DOI] [PubMed] [Google Scholar]
- Dayton PA, Chomas JE, Lum AFH, Allen JS, Lindner JR, Simon SI, Ferrara KW. Optical and acoustical dynamics of microbubble contrast agents inside neutrophils. Biophysical Journal. 2001;80:1547–56. doi: 10.1016/S0006-3495(01)76127-9. [DOI] [PMC free article] [PubMed] [Google Scholar]
- Dayton PA, Morgan KE, Klibanov AL, Brandenburger GH, Ferrara KW. Optical and acoustical observations of the effects of ultrasound on contrast agents. IEEE Transactions on Ultrasonics Ferroelectrics and Frequency Control. 1999b;46:220–32. doi: 10.1109/58.741536. [DOI] [PubMed] [Google Scholar]
- Dayton PA, Morgan KE, Klibanov ALS, Brandenburger G, Nightingale KR, Ferrara KW. A preliminary evaluation of the effects of primary and secondary radiation forces on acoustic contrast agents. IEEE Transactions on Ultrasonics Ferroelectrics and Frequency Control. 1997;44:1264–77. [Google Scholar]
- Definity-Prescribing-Information. 2008 http://www.definityimaging.com/pdf/prescribinginfo.pdf.
- Dejong N, Cornet R, Lancee CT. Higher Harmonics of Vibrating Gas-Filled Microspheres .1. Simulations. Ultrasonics. 1994a;32:447–53. [Google Scholar]
- Dejong N, Cornet R, Lancee CT. Higher Harmonics of Vibrating Gas-Filled Microspheres .2. Measurements. Ultrasonics. 1994b;32:455–9. [Google Scholar]
- Dejong N, Hoff L. Ultrasound Scattering Properties of Albunex Microspheres. Ultrasonics. 1993;31:175–81. doi: 10.1016/0041-624x(93)90004-j. [DOI] [PubMed] [Google Scholar]
- Dejong N, Hoff L, Skotland T, Bom N. Absorption and Scatter of Encapsulated Gas Filled Microspheres - Theoretical Considerations and Some Measurements. Ultrasonics. 1992;30:95–103. doi: 10.1016/0041-624x(92)90041-j. [DOI] [PubMed] [Google Scholar]
- Devin C. Survey of Thermal, Radiation, and Viscous Damping of Pulsating Air Bubbles in Water. Journal of the Acoustical Society of America. 1959;31:1654–67. [Google Scholar]
- Dijkmans PA, Knaalpen P, Aiazian E, Visser CA, Lammertsma AA, Visser FC, Kamp O. Myocardial perfusion as measured with real-time myocardial contrast echocardiography in healthy volunteers correlates with positron emission tomography. Circulation. 2004;110:718. doi: 10.1016/j.echo.2005.10.009. [DOI] [PubMed] [Google Scholar]
- Doinikov AA, Dayton PA. Spatio-temporal dynamics of an encapsulated gas bubble in an ultrasound field. Journal of the Acoustical Society of America. 2006;120:661–9. doi: 10.1121/1.2215228. [DOI] [PMC free article] [PubMed] [Google Scholar]
- Druzhinin OA, Ostrovsky LA, Prosperetti A. Low-frequency acoustic wave generation in a resonant bubble layer. Journal of the Acoustical Society of America. 1996;100:3570–80. [Google Scholar]
- Eggers J, Fontelos MA, Leppinen D, Snoeijer JH. Theory of the collapsing axisymmetric cavity. Physical Review Letters. 2007;98 doi: 10.1103/PhysRevLett.98.094502. [DOI] [PubMed] [Google Scholar]
- Ellegala DB, Poi HL, Carpenter JE, Klibanov AL, Kaul S, Shaffrey ME, Sklenar J, Lindner JR. Imaging tumor angiogenesis with contrast ultrasound and microbubbles targeted to alpha(v)beta(3) Circulation. 2003;108:336–41. doi: 10.1161/01.CIR.0000080326.15367.0C. [DOI] [PubMed] [Google Scholar]
- Endoh M, Koibuchi N, Sato M, Morishita R, Kanzaki T, Murata Y, Kaneda Y. Fetal gene transfer by intrauterine injection with microbubble-enhanced ultrasound. Mol Ther. 2002;5:501–8. doi: 10.1006/mthe.2002.0577. [DOI] [PubMed] [Google Scholar]
- Fanelli M, Prosperetti A, Reali M. Radial Oscillations of Gas-Vapor Bubbles in Liquids .2. Numerical Examples. Acustica. 1981;49:98–109. [Google Scholar]
- Favelukis M, Albalak RJ. Bubble growth in viscous Newtonian and non-Newtonian liquids. Chemical Engineering Journal. 1996;63:149–55. [Google Scholar]
- Feng ZC, Leal LG. Bifurcation and Chaos in Shape and Volume Oscillations of a Periodically Driven Bubble with 2-to-One Internal Resonance. Journal of Fluid Mechanics. 1994;266:209–42. [Google Scholar]
- Ferrara K, Pollard R, Borden M. Ultrasound microbubble contrast agents: Fundamentals and application to gene and drug delivery. Annual Review of Biomedical Engineering. 2007;9:415–47. doi: 10.1146/annurev.bioeng.8.061505.095852. [DOI] [PubMed] [Google Scholar]
- Flynn HG. Cavitation Dynamics .1. Mathematical Formulation. Journal of the Acoustical Society of America. 1975a;57:1379–96. [Google Scholar]
- Flynn HG. Cavitation Dynamics .2. Free Pulsations and Models for Cavitation Bubbles. Journal of the Acoustical Society of America. 1975b;58:1160–70. [Google Scholar]
- Fong SW, Klaseboer E, Khoo BC. The interaction of microbubbles with high intensity pulsed ultrasound. J Acoust Soc Am. 2008;123:3223. doi: 10.1121/1.2836746. [DOI] [PubMed] [Google Scholar]
- Fong SW, Klaseboer E, Turangan CK, Khoo BC, Hung KC. Numerical analysis of a gas bubble near bio-materials in an ultrasound field. Ultrasound in Medicine and Biology. 2006;32:925–42. doi: 10.1016/j.ultrasmedbio.2006.03.005. [DOI] [PubMed] [Google Scholar]
- Forsberg F, Dicker AP, Thakur ML, Rawool NM, Liu JB, Shi WT, Nazarian LN. Comparing contrast-enhanced ultrasound to immunohistochemical markers of angiogenesis in a human melanoma xenograft model: preliminary results. Ultrasound Med Biol. 2002;28:445–51. doi: 10.1016/s0301-5629(02)00482-9. [DOI] [PubMed] [Google Scholar]
- Forsberg F, Shi WT, Goldberg BB. Subharmonic imaging of contrast agents. Ultrasonics. 2000;38:93–8. doi: 10.1016/s0041-624x(99)00148-1. [DOI] [PubMed] [Google Scholar]
- Frenkel PA, Chen S, Thai T, Shohet RV, Grayburn PA. DNA-loaded albumin microbubbles enhance ultrasound-mediated transfection in vitro. Ultrasound Med Biol. 2002;28:817–22. doi: 10.1016/s0301-5629(02)00518-5. [DOI] [PubMed] [Google Scholar]
- Frinking PJA, de Jong N. Acoustic modeling of shell-encapsulated gas bubbles. Ultrasound in Medicine and Biology. 1998;24:523–33. doi: 10.1016/s0301-5629(98)00009-x. [DOI] [PubMed] [Google Scholar]
- Frizzell LA, Chen E, Lee C. Effects of pulsed ultrasound on the mouse neonate: hind limb paralysis and lung hemorrhage. Ultrasound Med Biol. 1994;20:53–63. doi: 10.1016/0301-5629(94)90017-5. [DOI] [PubMed] [Google Scholar]
- Fung YC. Biomechanics: Mechanical Properties of Living Tissues. New York: Springer-Verlag; 1993. [Google Scholar]
- Fyrillas MM, Szeri AJ. Dissolution or Growth of Soluble Spherical Oscillating Bubbles. Journal of Fluid Mechanics. 1994;277:381–407. [Google Scholar]
- Fyrillas MM, Szeri AJ. Dissolution or Growth of Soluble Spherical Oscillating Bubbles - the Effect of Surfactants. Journal of Fluid Mechanics. 1995;289:295–314. [Google Scholar]
- Garbin V, Cojoc D, Ferrari E, Di Fabrizio E, Overvelde MLJ, van der Meer SM, de Jong N, Lohse D, Versluis M. Changes in microbubble dynamics near a boundary revealed by combined optical micromanipulation and high-speed imaging. Applied Physics Letters. 2007;90 [Google Scholar]
- Gaunaurd GC, Uberall H. Theory of Resonant Scattering from Spherical Cavities in Elastic and Viscoelastic Media. Journal of the Acoustical Society of America. 1978;63:1699–712. [Google Scholar]
- Gilmore FR. Hydrodynamics Laboratory. Pasadena: California Institute Technology; 1952. The growth or collapse of a spherical bubble in a viscous compressible liquid. [Google Scholar]
- Glazman RE. Effects of Adsorbed Films on Gas Bubble Radial Oscillations. Journal of the Acoustical Society of America. 1983;74:980–6. [Google Scholar]
- Goldsztein GH. Collapse and rebound of a gas bubble. Studies in Applied Mathematics. 2004;112:101–32. [Google Scholar]
- Gong YJ, Zhang D, Xi XY, Gong XF, Liu Z. Theoretical and experimental study of enhanced subharmonic emission from microbubbles with chirp excitation. Acta Physica Sinica. 2007;56:7051–7. [Google Scholar]
- Gordillo JM, Fontelos MA. Satellites in the inviscid breakup of bubbles. Physical Review Letters. 2007;98 doi: 10.1103/PhysRevLett.98.144503. [DOI] [PubMed] [Google Scholar]
- Graubner T, Lazenby J, Nock LF, VonBehren PL, Kaiser WA. The detection of slow flow by non-linear ultrasound imaging of contrast agents using harmonic imaging and a new phase inversion technique in vitro. Radiology. 1997;205:1174. [Google Scholar]
- Guo DP, Li XY, Sun P, Wang ZG, Chen XY, Chen Q, Fan LM, Zhang B, Shao LZ, Li XR. Ultrasound/microbubble enhances foreign gene expression in ECV304 cells and murine myocardium. Acta Biochim Biophys Sin (Shanghai) 2004;36:824–31. doi: 10.1093/abbs/36.12.824. [DOI] [PubMed] [Google Scholar]
- Hamilton MF, Ilinskii YA, Meegan GD, Zabolotskaya EA. Interaction of bubbles in a cluster near a rigid surface. Acoustics Research Letters Online-Arlo. 2005;6:207–13. [Google Scholar]
- Harvey CJ, Blomley MJK, Eckersley RJ, Cosgrove DO, Patel N, Heckemann RA, Butler-Barnes J. Hepatic malignancies: Improved detection with pulse-inversion US in late phase of enhancement with SHU 508A - Early experience. Radiology. 2000a;216:903–8. doi: 10.1148/radiology.216.3.r00se22903. [DOI] [PubMed] [Google Scholar]
- Harvey CJ, Blomley MJK, Eckersley RJ, Heckemann RA, Butler-Barnes J, Cosgrove DO. Pulse-inversion mode imaging of liver specific microbubbles: improved detection of subcentimetre metastases. Lancet. 2000b;355:807–8. doi: 10.1016/S0140-6736(99)04545-6. [DOI] [PubMed] [Google Scholar]
- Hoff L, Sontum PC, Hovem JM. Oscillations of polymeric microbubbles: Effect of the encapsulating shell. Journal of the Acoustical Society of America. 2000;107:2272–80. doi: 10.1121/1.428557. [DOI] [PubMed] [Google Scholar]
- Hu YT, Qin SP, Hu T, Ferrara KW, Jiang Q. Asymmetric oscillation of cavitation bubbles in a microvessel and its implications upon mechanisms of clinical vessel injury in shock-wave lithotripsy. International Journal of Non-Linear Mechanics. 2005;40:341–50. [Google Scholar]
- Hu YT, Qin SP, Jiang Q. Characteristics of acoustic scattering front a double-layered micro shell for encapsulated drug delivery. Ieee Transactions on Ultrasonics Ferroelectrics and Frequency Control. 2004;51:809–21. [PubMed] [Google Scholar]
- Hynynen K, McDannold N, Martin H, Jolesz FA, Vykhodtseva N. The threshold for brain damage in rabbits induced by bursts of ultrasound in the presence of an ultrasound contrast agent (Optison) Ultrasound Med Biol. 2003;29:473–81. doi: 10.1016/s0301-5629(02)00741-x. [DOI] [PubMed] [Google Scholar]
- Hynynen K, McDannold N, Vykhodtseva N, Jolesz FA. Noninvasive MR imaging-guided focal opening of the blood-brain barrier in rabbits. Radiology. 2001;220:640–6. doi: 10.1148/radiol.2202001804. [DOI] [PubMed] [Google Scholar]
- Jayaweera AR, Edwards N, Glasheen WP, Villanueva FS, Abbott RD, Kaul S. In-vivo myocardial kinetics of air-filled albumin microbubbles during myocardial contrast echocardiography- comparison with radiolabeled red-blood-cells. Circ Res. 1994;74:1157–65. doi: 10.1161/01.res.74.6.1157. [DOI] [PubMed] [Google Scholar]
- Jian-Guo G, Ming C, Kuo-Chen C. P-selectin Cell Adhesion Molecule in Inflammation, Thrombosis, Cancer Growth and Metastasis. Current Medicinal Chemistry. 2004;11:2153–60. doi: 10.2174/0929867043364720. [DOI] [PubMed] [Google Scholar]
- Kamath V, Oguz HN, Prosperetti A. Bubble Oscillations in the Nearly Adiabatic Limit. Journal of the Acoustical Society of America. 1992;92:2016–23. [Google Scholar]
- Kamath V, Prosperetti A. Numerical-Integration Methods in Gas-Bubble Dynamics. Journal of the Acoustical Society of America. 1989;85:1538–48. [Google Scholar]
- Karpov S, Prosperetti A, Ostrovsky L. Nonlinear wave interactions in bubble layers. Journal of the Acoustical Society of America. 2003;113:1304–16. doi: 10.1121/1.1539519. [DOI] [PubMed] [Google Scholar]
- Kaufmann BA, Wei K, Lindner JR. Contrast echocardiography. Curr Probl Cardiol. 2007;32:51–96. doi: 10.1016/j.cpcardiol.2006.10.004. [DOI] [PubMed] [Google Scholar]
- Kaul S. Myocardial Contrast Echocardiography: A 25-Year Retrospective. Circulation. 2008;118:291–308. doi: 10.1161/CIRCULATIONAHA.107.747303. [DOI] [PubMed] [Google Scholar]
- Keller JB, Kolodner II. Damping of Underwater Explosion Bubble Oscillations. Journal of Applied Physics. 1956;27:1152–61. [Google Scholar]
- Keller JB, Miksis M. Bubble Oscillations of Large-Amplitude. Journal of the Acoustical Society of America. 1980;68:628–33. [Google Scholar]
- Kim DH, Klibanov AL, Needham D. The influence of tiered layers of surface-grafted poly(ethylene glycol) on receptor-ligand-mediated adhesion between phospholipid monolayer-stabilized microbubbles and coated class beads. Langmuir. 2000;16:2808–17. [Google Scholar]
- Klaseboer E, Turangan C, Fong SW, Liu TG, Hung KC, Khoo BC. Simulations of pressure pulse-bubble interaction using boundary element method. Computer Methods in Applied Mechanics and Engineering. 2006;195:4287–302. [Google Scholar]
- Klibanov AL. Ligand-carrying gas-filled microbubbles: Ultrasound contrast agents for targeted molecular imaging. Bioconjugate Chemistry. 2005;16:9–17. doi: 10.1021/bc049898y. [DOI] [PubMed] [Google Scholar]
- Klibanov AL, Ferrara KW, Hughes MS, Wible JH, Wojdyla JK, Dayton PA, Morgan KE, Brandenburger GH. Direct video microscopic observation of the dynamic effects of medical ultrasound on ultrasound contrast microspheres. Investigative Radiology. 1998;33:863–70. doi: 10.1097/00004424-199812000-00004. [DOI] [PubMed] [Google Scholar]
- Klibanov AL, Hughes MS, Marsh JN, Hall CS, Miller JG, Wible JH, Brandenburger GH. Targeting of ultrasound contrast material - An in vitro feasibility study. Acta Radiologica. 1997;38:113–20. [PubMed] [Google Scholar]
- Kobayashi N, Yasu T, Yamada S, Kudo N, Kuroki M, Kawakami M, Miyatake K, Saito M. Endothelial cell injury in venule and capillary induced by contrast ultrasonography. Ultrasound Med Biol. 2002;28:949–56. doi: 10.1016/s0301-5629(02)00532-x. [DOI] [PubMed] [Google Scholar]
- Kobayashi N, Yasu T, Yamada S, Kudo N, Kuroki M, Miyatake K, Kawakami M, Saito M. Influence of contrast ultrasonography with perflutren lipid microspheres on microvessel injury. Circ J. 2003;67:630–6. doi: 10.1253/circj.67.630. [DOI] [PubMed] [Google Scholar]
- Kodama T, Tomita Y. Cavitation bubble behavior and bubble-shock wave interaction near a gelatin surface as a study of in vivo bubble dynamics. Applied Physics B: Lasers and Optics. 2000;70:139–49. [Google Scholar]
- Krasovitski B, Kimmel E. Shear stress induced by a gas bubble pulsating in an ultrasonic field near a wall. IEEE Transactions on Ultrasonics Ferroelectrics and Frequency Control. 2004;51:973–9. doi: 10.1109/tuffc.2004.1324401. [DOI] [PubMed] [Google Scholar]
- Krix M, Plathow C, Kiessling F, Herth F, Karcher A, Essig M, Schmitteckert H, Kauczor HU, Delorme S. Quantification of perfusion of liver tissue and metastases using a multivessel model for replenishment kinetics of ultrasound contrast agents. Ultrasound in Medicine and Biology. 2004;30:1355–63. doi: 10.1016/j.ultrasmedbio.2004.08.011. [DOI] [PubMed] [Google Scholar]
- Kruse DE, Ferrara KW. A new imaging strategy using wideband transient response of ultrasound contrast agents. IEEE Transactions on Ultrasonics Ferroelectrics and Frequency Control. 2005;52:1320–9. doi: 10.1109/tuffc.2005.1509790. [DOI] [PMC free article] [PubMed] [Google Scholar]
- Lanza GM, Wickline SA. Targeted ultrasonic contrast agents for molecular imaging and therapy. Progress in Cardiovascular Diseases. 2001;44:13–31. doi: 10.1053/pcad.2001.26440. [DOI] [PubMed] [Google Scholar]
- Lawrie A, Brisken AF, Francis SE, Cumberland DC, Crossman DC, Newman CM. Microbubble-enhanced ultrasound for vascular gene delivery. Gene Ther. 2000;7:2023–7. doi: 10.1038/sj.gt.3301339. [DOI] [PubMed] [Google Scholar]
- Lee DJ, Lyshchik A, Huamani J, Hallahan DE, Fleischer AC. Relationship Between Retention of a Vascular Endothelial Growth Factor Receptor 2 (VEGFR2)-Targeted Ultrasonographic Contrast Agent and the Level of VEGFR2 Expression in an In Vivo Breast Cancer Model. J Ultrasound Med. 2008;27:855–66. doi: 10.7863/jum.2008.27.6.855. [DOI] [PubMed] [Google Scholar]
- Lee S, Kim DH, Needham D. Equilibrium and dynamic interfacial tension measurements at microscopic interfaces using a micropipet technique. 2. Dynamics of phospholipid monolayer formation and equilibrium tensions at water-air interface. Langmuir. 2001;17:5544–50. [Google Scholar]
- Leroy V, Devaud M, Hocquet T, Bacri JC. The bubble cloud as an N-degree of freedom harmonic oscillator. European Physical Journal E. 2005;17:189–98. doi: 10.1140/epje/i2004-10139-4. [DOI] [PubMed] [Google Scholar]
- Lezzi A, Prosperetti A. Bubble Dynamics in a Compressible Liquid .2. 2nd-Order Theory. Journal of Fluid Mechanics. 1987;185:289–321. [Google Scholar]
- Li P, Armstrong WF, Miller DL. Impact of myocardial contrast echocardiography on vascular permeability: comparison of three different contrast agents. Ultrasound Med Biol. 2004;30:83–91. doi: 10.1016/j.ultrasmedbio.2003.09.004. [DOI] [PubMed] [Google Scholar]
- Li P, Cao LQ, Dou CY, Armstrong WF, Miller D. Impact of myocardial contrast echocardiography on vascular permeability: an in vivo dose response study of delivery mode, pressure amplitude and contrast dose. Ultrasound Med Biol. 2003;29:1341–9. doi: 10.1016/s0301-5629(03)00988-8. [DOI] [PubMed] [Google Scholar]
- Lin H, Storey BD, Szeri AJ. Inertially driven inhomogeneities in violently collapsing bubbles: the validity of the Rayleigh-Plesset equation. Journal of Fluid Mechanics. 2002;452:145–62. [Google Scholar]
- Lindner JR, Song J, Christiansen J, Klibanov AL, Xu F, Ley K. Ultrasound assessment of inflammation and renal tissue injury with microbubbles targeted to P-selectin. Circulation. 2001;104:2107–12. doi: 10.1161/hc4201.097061. [DOI] [PubMed] [Google Scholar]
- Lofstedt R, Weninger K, Putterman S, Barber BP. Sonoluminescing Bubbles and Mass Diffusion. Physical Review E. 1995;51:4400–10. doi: 10.1103/physreve.51.4400. [DOI] [PubMed] [Google Scholar]
- Lu NQ, Prosperetti A, Yoon SW. Underwater Noise Emissions from Bubble Clouds. IEEE Journal of Oceanic Engineering. 1990;15:275–81. [Google Scholar]
- Lucidarme O, Nguyen T, Kono Y, Corbeil J, Choi SH, Varner J, Mattrey RF. Angiogenesis model for ultrasound contrast research: exploratory study. Acad Radiol. 2004;11:4–12. doi: 10.1016/s1076-6332(03)00575-0. [DOI] [PubMed] [Google Scholar]
- Lum AFH, Borden MA, Dayton PA, Kruse DE, Simon SI, Ferrara KW. Ultrasound radiation force enables targeted deposition of model drug carriers loaded on microbubbles. Journal of Controlled Release. 2006;111:128–34. doi: 10.1016/j.jconrel.2005.11.006. [DOI] [PMC free article] [PubMed] [Google Scholar]
- Marmottant P, van der Meer S, Emmer M, Versluis M, de Jong N, Hilgenfeldt S, Lohse D. A model for large amplitude oscillations of coated bubbles accounting for buckling and rupture. Journal of the Acoustical Society of America. 2005;118:3499–505. [Google Scholar]
- Masoy SE, Standal O, Nasholm P, Johansen TF, Angelsen B, Hansen R. SURF imaging: In vivo demonstration of an ultrasound contrast agent detection technique. IEEE Transactions on Ultrasonics Ferroelectrics and Frequency Control. 2008;55:1112–21. doi: 10.1109/TUFFC.2008.763. [DOI] [PubMed] [Google Scholar]
- McDannold N, Vykhodtseva N, Hynynen K. Use of ultrasound pulses combined with definity for targeted blood-brain barrier disruption: A feasibility study. Ultrasound in Medicine and Biology. 2007;33:584–90. doi: 10.1016/j.ultrasmedbio.2006.10.004. [DOI] [PMC free article] [PubMed] [Google Scholar]
- Mcdannold N, Vykhodtseva N, Hynynen K. Effects of acoustic parameters and ultrasound contrast agent dose on focused-ultrasound induced blood-brain barrier disruption. Ultrasound in Medicine and Biology. 2008;34:930–7. doi: 10.1016/j.ultrasmedbio.2007.11.009. [DOI] [PMC free article] [PubMed] [Google Scholar]
- Meltzer RS. Food and Drug Administration ultrasound device regulation: The output display standard, the “mechanical index,” and ultrasound safety. Journal of the American Society of Echocardiography. 1996;9:216–20. doi: 10.1016/s0894-7317(96)90035-8. [DOI] [PubMed] [Google Scholar]
- Miller DL. Ultrasonic-Detection of Resonant Cavitation Bubbles in a Flow Tube by Their 2nd-Harmonic Emissions. Ultrasonics. 1981;19:217–24. [Google Scholar]
- Miller DL, Dou C, Wiggins RC. Frequency dependence of kidney injury induced by contrast-aided diagnostic ultrasound in rats. Ultrasound Med Biol. 2008 doi: 10.1016/j.ultrasmedbio.2008.03.001. [DOI] [PMC free article] [PubMed] [Google Scholar]
- Miller DL, Gies RA. Enhancement of ultrasonically-induced hemolysis by perfluorocarbon-based compared to air-based echo-contrast agents. Ultrasound Med Biol. 1998;24:285–92. doi: 10.1016/s0301-5629(97)00267-6. [DOI] [PubMed] [Google Scholar]
- Miller DL, Gies RA. The influence of ultrasound frequency and gas-body composition on the contrast agent-mediated enhancement of vascular bioeffects in mouse intestine. Ultrasound Med Biol. 2000;26:307–13. doi: 10.1016/s0301-5629(99)00138-6. [DOI] [PubMed] [Google Scholar]
- Miller DL, Li P, Gordon D, Armstrong WF. Histological characterization of microlesions induced by myocardial contrast echocardiography. Echocardiography. 2005;22:25–34. doi: 10.1111/j.0742-2822.2005.03184.x. [DOI] [PubMed] [Google Scholar]
- Miller DL, Quddus J. Diagnostic ultrasound activation of contrast agent gas bodies induces capillary rupture in mice. Proc Natl Acad Sci U S A. 2000;97:10179–84. doi: 10.1073/pnas.180294397. [DOI] [PMC free article] [PubMed] [Google Scholar]
- Minnaert M. On musical air bubbles and the sounds of running water. Philosophical Magazine. 1933;16:235–48. [Google Scholar]
- Morgan K, Averkiou M, Ferrara K. The effect of the phase of transmission on contrast agent echoes. IEEE Transactions on Ultrasonics Ferroelectrics and Frequency Control. 1998;45:872–5. doi: 10.1109/58.710539. [DOI] [PubMed] [Google Scholar]
- Morgan KE, Allen JS, Dayton PA, Chomas JE, Klibanov AL, Ferrara KW. Experimental and theoretical evaluation of microbubble behavior: Effect of transmitted phase and bubble size. IEEE Transactions on Ultrasonics Ferroelectrics and Frequency Control. 2000;47:1494–509. doi: 10.1109/58.883539. [DOI] [PubMed] [Google Scholar]
- Nakashima Y, Raines EW, Plump AS, Breslow JL, Ross R. Upregulation of VCAM-1 and ICAM-1 at atherosclerosis-prone sites on the endothelium in the apoE-deficient mouse. Arteriosclerosis, Thrombosis, and Vascular Biology. 1998;18:842–51. doi: 10.1161/01.atv.18.5.842. [DOI] [PubMed] [Google Scholar]
- Nyborg WL. Acoustic Streaming near a Boundary. Journal of the Acoustical Society of America. 1958;30:329–39. [Google Scholar]
- Oguz HN, Prosperetti A. Bubble Entrainment by the Impact of Drops on Liquid Surfaces. Journal of Fluid Mechanics. 1990a;219:143–79. [Google Scholar]
- Oguz HN, Prosperetti A. Bubble Oscillations in the Vicinity of a Nearly Plane Free-Surface. Journal of the Acoustical Society of America. 1990b;87:2085–92. [Google Scholar]
- Oguz HN, Prosperetti A. Dynamics of Bubble-Growth and Detachment from a Needle. Journal of Fluid Mechanics. 1993;257:111–45. [Google Scholar]
- Oguz HN, Prosperetti A. The natural frequency of oscillation of gas bubbles in tubes. Journal of the Acoustical Society of America. 1998;103:3301–8. [Google Scholar]
- Optison-Prescribing-Information. 2008 http://md.gehealthcare.com/shared/pdfs/pi/optison_pi.pdf.
- Ory E, Yuan H, Prosperetti A, Popinet S, Zaleski S. Growth and collapse of a vapor bubble in a narrow tube. Physics of Fluids. 2000;12:1268–77. [Google Scholar]
- Patel DN, Bloch SH, Dayton PA, Ferrara KW. Acoustic signatures of submicron contrast agents. IEEE Transactions on Ultrasonics Ferroelectrics and Frequency Control. 2004;51:293–301. [PubMed] [Google Scholar]
- Payne EMB, Illesinghe SJ, Ooi A, Manasseh R. Symmetric mode resonance of bubbles attached to a rigid boundary. Journal of the Acoustical Society of America. 2005;118:2841–9. [Google Scholar]
- Payvar P. Mass Transfer-Controlled Bubble-Growth during Rapid Decompression of a Liquid. International Journal of Heat and Mass Transfer. 1987;30:699–706. [Google Scholar]
- Pelekasis NA, Gaki A, Doinikov A, Tsamopoulos JA. Secondary Bjerknes forces between two bubbles and the phenomenon of acoustic streamers. Journal of Fluid Mechanics. 2004;500:313–47. [Google Scholar]
- Phillips P, Gardner E. Contrast-agent detection and quantification. European Radiology. 2004;14:P4–P10. [PubMed] [Google Scholar]
- Pislaru SV, Pislaru C, Kinnick RR, Singh R, Gulati R, Greenleaf JF, Simari RD. Optimization of ultrasound-mediated gene transfer: comparison of contrast agents and ultrasound modalities. Eur Heart J. 2003;24:1690–8. doi: 10.1016/s0195-668x(03)00469-x. [DOI] [PubMed] [Google Scholar]
- Plesset MS. The Dynamics of Cavitation Bubbles. Journal of Applied Mechanics-Transactions of the Asme. 1949;16:277–82. [Google Scholar]
- Plesset MS, Prosperetti A. Bubble Dynamics and Cavitation. Annual Review of Fluid Mechanics. 1977;9:145–85. [Google Scholar]
- Porter TR, Oberdorfer J, Rafter P, Lof J, Xie F. Microbubble responses to a similar mechanical index with different real-time perfusion imaging techniques. Ultrasound in Medicine and Biology. 2003;29:1187–92. doi: 10.1016/s0301-5629(03)00900-1. [DOI] [PubMed] [Google Scholar]
- Porter TR, Xie F, Kricsfeld D, Armbruster RW. Improved myocardial contrast with second harmonic transient ultrasound response imaging in humans using intravenous perfluorocarbon-exposed sonicated dextrose albumin. Journal of the American College of Cardiology. 1996;27:1497–501. doi: 10.1016/0735-1097(96)00017-4. [DOI] [PubMed] [Google Scholar]
- Postema M, Schmitz G. Ultrasonic bubbles in medicine: Influence of the shell. Ultrasonics Sonochemistry. 2007;14:438–44. doi: 10.1016/j.ultsonch.2006.09.013. [DOI] [PubMed] [Google Scholar]
- Postema M, van Wamel A, ten Cate FJ, de Jong N. High-speed photography during ultrasound illustrates potential therapeutic applications of microbubbles. Medical Physics. 2005;32:3707–11. doi: 10.1118/1.2133718. [DOI] [PubMed] [Google Scholar]
- Potdevin TC, Fowkes JB, Moskalik AP, Carson PL. Analysis of refill curve shape in ultrasound contrast agent studies. Medical Physics. 2004;31:623–32. doi: 10.1118/1.1649534. [DOI] [PubMed] [Google Scholar]
- Prentice P, Cuschieri A, Dholakia K, Prausnitz M, Campbell P. Membrane disruption by optically controlled microbubble cavitation. Nat Phys. 2005;1:107–10. [Google Scholar]
- Prosperetti A. Nonlinear Oscillations of Gas-Bubbles in Liquids - Transient Solutions and Connection Between Subharmonic Signal and Cavitation. Journal of the Acoustical Society of America. 1975;57:810–21. [Google Scholar]
- Prosperetti A. Bubble Dynamics - a Review and Some Recent Results. Applied Scientific Research. 1982a;38:145–64. [Google Scholar]
- Prosperetti A. A Generalization of the Rayleigh-Plesset Equation of Bubble Dynamics. Physics of Fluids. 1982b;25:409–10. [Google Scholar]
- Prosperetti A. The Equation of Bubble Dynamics in a Compressible Liquid. Physics of Fluids. 1987;30:3626–8. [Google Scholar]
- Prosperetti A. The Thermal-Behavior of Oscillating Gas-Bubbles. Journal of Fluid Mechanics. 1991;222:587–616. [Google Scholar]
- Prosperetti A, Crum LA, Commander KW. Nonlinear Bubble Dynamics. Journal of the Acoustical Society of America. 1988;83:502–14. [Google Scholar]
- Prosperetti A, Lezzi A. Bubble Dynamics in a Compressible Liquid .1. 1st-Order Theory. Journal of Fluid Mechanics. 1986;168:457–78. [Google Scholar]
- Putterman S, Evans PG, Vazquez G, Weninger K. Cavitation science - Is there a simple theory of sonoluminescence? Nature. 2001;409:782–3. doi: 10.1038/35057317. [DOI] [PubMed] [Google Scholar]
- Qin SP, Ferrara KW. Acoustic response of compliable microvessels containing ultrasound contrast agents. Physics in Medicine and Biology. 2006;51:5065–88. doi: 10.1088/0031-9155/51/20/001. [DOI] [PMC free article] [PubMed] [Google Scholar]
- Qin SP, Ferrara KW. The natural frequency of nonlinear oscillation of ultrasound contrast agents in microvessels. Ultrasound in Medicine and Biology. 2007;33:1140–8. doi: 10.1016/j.ultrasmedbio.2006.12.009. [DOI] [PMC free article] [PubMed] [Google Scholar]
- Qin SP, Hu YT, Jiang Q. Oscillatory interaction between bubbles and confining microvessels and its implications on clinical vascular injuries of shock-wave lithotripsy. IEEE Transactions on Ultrasonics Ferroelectrics and Frequency Control. 2006;53:1322–9. doi: 10.1109/tuffc.2006.1665080. [DOI] [PubMed] [Google Scholar]
- Rayleigh On the pressure developed in a liquid during the collapse of a spherical cavity. Philosophical Magazine. 1917;34:94–8. [Google Scholar]
- Ridsdale RA, Palaniyar N, Possmayer F, Harauz G. Formation of folds and vesicles by dipalmitoylphosphatidylcholine monolayers spread in excess. J Membr Biol. 2001;180:21–32. doi: 10.1007/s002320010055. [DOI] [PubMed] [Google Scholar]
- Roy RA, Church CC, Calabrese A. In: Frontiers of Nonlinear Aouctics: Proceedings of the 12th ISNA. Hamilton MF, Blackstock DA, editors. 1990. pp. 746–481. [Google Scholar]
- Sage KA, George J, Uberall H. Multiple resonances in sound scattering from gas-bubbles in a liquid. Journal of the Acoustical Society of America. 1979;65:1413–22. [Google Scholar]
- Sarkar K, Prosperetti A. Backscattering of Underwater Noise by Bubble Clouds. Journal of the Acoustical Society of America. 1993;93:3128–38. [Google Scholar]
- Sassaroli E, Hynynen K. Forced linear oscillation’s of microbubbles in blood capillaries. Journal of the Acoustical Society of America. 2004;115:3235–43. doi: 10.1121/1.1738456. [DOI] [PubMed] [Google Scholar]
- Sassaroli E, Hynynen K. Resonance frequency of microbubbles in small blood vessels: a numerical study. Physics in Medicine and Biology. 2005;50:5293–305. doi: 10.1088/0031-9155/50/22/006. [DOI] [PubMed] [Google Scholar]
- Sato K, Tomita Y, Shima A. Numerical-Analysis of a Gas Bubble near a Rigid Boundary in an Oscillatory Pressure Field. Journal of the Acoustical Society of America. 1994;95:2416–24. [Google Scholar]
- Schoelgens C. Native (TM) tissue harmonic imaging. Radiologe. 1998;38:420–3. doi: 10.1007/s001170050375. [DOI] [PubMed] [Google Scholar]
- Schrope BA, Newhouse VL. 2ND-Harmonic ultrasonic blood perfusion Measurement. Ultrasound in Medicine and Biology. 1993;19:567–79. doi: 10.1016/0301-5629(93)90080-8. [DOI] [PubMed] [Google Scholar]
- Senior R, Kaul S, Soman P, Lahiri A. Power Doppler harmonic imaging: A feasibility study of a new technique for the assessment of myocardial perfusion. American Heart Journal. 2000;139:245–51. doi: 10.1067/mhj.2000.101488. [DOI] [PubMed] [Google Scholar]
- Shankar PM, Krishna PD, Newhouse VL. Advantages of subharmonic over second harmonic backscatter for contrast-to-tissue echo enhancement. Ultrasound in Medicine and Biology. 1998;24:395–9. doi: 10.1016/s0301-5629(97)00262-7. [DOI] [PubMed] [Google Scholar]
- Shi WT, Forsberg F, Hall AL, Chia RY, Liu JB, Miller S, Thomenius KE, Wheatley MA, Goldberg BB. Subharmonic imaging with microbubble contrast agents: Initial results. Ultrasonic Imaging. 1999;21:79–94. doi: 10.1177/016173469902100201. [DOI] [PubMed] [Google Scholar]
- Shohet RV, Chen S, Zhou YT, Wang Z, Meidell RS, Unger RH, Grayburn PA. Echocardiographic destruction of albumin microbubbles directs gene delivery to the myocardium. Circulation. 2000;101:2554–6. doi: 10.1161/01.cir.101.22.2554. [DOI] [PubMed] [Google Scholar]
- Simpson DH, Burns PN, Averkiou MA. Techniques for perfusion imaging with microbubble contrast agents. IEEE Transactions on Ultrasonics Ferroelectrics and Frequency Control. 2001;48:1483–94. doi: 10.1109/58.971698. [DOI] [PubMed] [Google Scholar]
- Skyba DM, Price RJ, Linka AZ, Skalak TC, Kaul S. Direct in vivo visualization of intravascular destruction of microbubbles by ultrasound and its local effects on tissue. Circulation. 1998;98:290–3. doi: 10.1161/01.cir.98.4.290. [DOI] [PubMed] [Google Scholar]
- Solbiati L, Tonolini M, Cova L. Monitoring RF ablation. European Radiology. 2004;14:P34–P42. doi: 10.1007/s10406-004-0089-y. [DOI] [PubMed] [Google Scholar]
- Stieger SM, Caskey CF, Adamson RH, Qin S, Curry FR, Wisner ER, Ferrara KW. Enhancement of vascular permeability with low-frequency contrast-enhanced ultrasound in the chorioallantoic membrane model. Radiology. 2007;243:112–21. doi: 10.1148/radiol.2431060167. [DOI] [PubMed] [Google Scholar]
- Stieger SM, Dayton PA, Borden MA, Caskey CF, Griffey SM, Wisner ER, Ferrara KW. Imaging of angiogenesis using Cadence contrast pulse sequencing and targeted contrast agents. Contrast Media Mol Imaging. 2008;3:9–18. doi: 10.1002/cmmi.224. [DOI] [PubMed] [Google Scholar]
- Strandring S. Gray’s Anatomy: The Anatomical Basis of Clinical Practice. Philidelphia: Elsevier-Churchill-Livingstone); 2005. [Google Scholar]
- Strasberg M. Gas Bubbles as Sources of Sound in Liquids. Journal of the Acoustical Society of America. 1956;28:20–6. [Google Scholar]
- Sun Y, Kruse DE, Ferrara KW. Contrast imaging with chirped excitation. IEEE Transactions on Ultrasonics Ferroelectrics and Frequency Control. 2007;54:520–9. doi: 10.1109/tuffc.2007.275. [DOI] [PubMed] [Google Scholar]
- Takahira H. Growth of traveling bubbles near an axisymmetric body in a potential flow. Jsme International Journal Series B-Fluids and Thermal Engineering. 1997;40:240–9. [Google Scholar]
- Talu E, Lozano MM, Powell RL, Dayton PA, Longo ML. Long-term stability by lipid coating monodisperse microbubbles formed by a flow-focusing device. Langmuir. 2006;22:9487–90. doi: 10.1021/la062095+. [DOI] [PMC free article] [PubMed] [Google Scholar]
- Tang J, Li S, Li J, Zhang Y, Li X, Dong B, Shi H, Zhang G. Evaluation of the effect of protamine on human prostate carcinoma PC-3m using contrast enhanced Doppler ultrasound. J Urol. 2003;170:611–4. doi: 10.1097/01.ju.0000066002.90361.81. [DOI] [PubMed] [Google Scholar]
- Tartis MS, McCallan J, Lum AF, LaBell R, Stieger SM, Matsunaga TO, Ferrara KW. Therapeutic effects of paclitaxel-containing ultrasound contrast agents. Ultrasound Med Biol. 2006;32:1771–80. doi: 10.1016/j.ultrasmedbio.2006.03.017. [DOI] [PubMed] [Google Scholar]
- Teupe C, Richter S, Fisslthaler B, Randriamboavonjy V, Ihling C, Fleming I, Busse R, Zeiher AM, Dimmeler S. Vascular gene transfer of phosphomimetic endothelial nitric oxide synthase (S1177D) using ultrasound-enhanced destruction of plasmid-loaded microbubbles improves vasoreactivity. Circulation. 2002;105:1104–9. doi: 10.1161/hc0902.104720. [DOI] [PubMed] [Google Scholar]
- Treat LH, McDannold N, Vykhodtseva N, Zhang Y, Tam K, Hynynen K. Targeted delivery of doxorubicin to the rat brain at therapeutic levels using MRI-guided focused ultrasound. Int J Cancer. 2007;121:901–7. doi: 10.1002/ijc.22732. [DOI] [PubMed] [Google Scholar]
- Trilling L. The Collapse and Rebound of a Gas Bubble. Journal of Applied Physics. 1952;23:14–7. [Google Scholar]
- Tsamopoulos JA, Brown RA. Non-Linear Oscillations of Inviscid Drops and Bubbles. Journal of Fluid Mechanics. 1983;127:519–37. [Google Scholar]
- Tsamopoulos JA, Brown RA. Resonant Oscillations of Inviscid Charged Drops. Journal of Fluid Mechanics. 1984;147:373–95. [Google Scholar]
- Tsutsui JM, Xie F, Johanning J, Lof J, Cory B, He A, Thomas L, Matsunaga T, Unger E, Porter TR. Treatment of deeply located acute intravascular thrombi with therapeutic ultrasound guided by diagnostic ultrasound and intravenous microbubbles. J Ultrasound Med. 2006;25:1161–8. doi: 10.7863/jum.2006.25.9.1161. [DOI] [PubMed] [Google Scholar]
- van Der Wouw PA, Brauns AC, Bailey SE, Powers JE, Wilde AA. Premature ventricular contractions during triggered imaging with ultrasound contrast. J Am Soc Echocardiogr. 2000;13:288–94. doi: 10.1067/mje.2000.103865. [DOI] [PubMed] [Google Scholar]
- Vannan M, McCreery T, Li P, Han Z, Unger E, Kuersten B, Nabel E, Rajagopalan S. Ultrasound-mediated transfection of canine myocardium by intravenous administration of cationic microbubble-linked plasmid DNA. J Am Soc Echocardiogr. 2002;15:214–8. doi: 10.1067/mje.2002.119913. [DOI] [PubMed] [Google Scholar]
- Villanueva F, Kaul S. Assessment of myocardial perfusion in coronary artery disease using myocardial contrast echocardiography. Coronary Artery Disease. 1995;6:18–28. doi: 10.1097/00019501-199501000-00004. [DOI] [PubMed] [Google Scholar]
- Vokurka K. On Rayleigh Model of a Freely Oscillating Bubble .1. Basic Relations. Czechoslovak Journal of Physics. 1985;35:28–40. [Google Scholar]
- Vokurka K. Comparison of Rayleigh, Herring, and Gilmore Models of Gas-Bubbles. Acustica. 1986;59:214–9. [Google Scholar]
- Ward M, Wu J, Chiu JF. Experimental study of the effects of Optison concentration on sonoporation in vitro. Ultrasound Med Biol. 2000;26:1169–75. doi: 10.1016/s0301-5629(00)00260-x. [DOI] [PubMed] [Google Scholar]
- Wei K, Jayaweera AR, Firoozan S, Linka A, Skyba DM, Kaul S. Quantification of myocardial blood flow with ultrasound-induced destruction of microbubbles administered as a constant venous infusion. Circulation. 1998;97:473–83. doi: 10.1161/01.cir.97.5.473. [DOI] [PubMed] [Google Scholar]
- Wei K, Le E, Bin JP, Coggins M, Thorpe J, Kaul S. Quantification of renal blood flow with contrast-enhanced ultrasound. Journal of the American College of Cardiology. 2001a;37:1135–40. doi: 10.1016/s0735-1097(00)01210-9. [DOI] [PubMed] [Google Scholar]
- Wei K, Ragosta M, Thorpe J, Coggins M, Moos S, Kaul S. Noninvasive quantification of coronary blood flow reserve in humans using myocardial contrast echocardiography. Circulation. 2001b;103:2560–5. doi: 10.1161/01.cir.103.21.2560. [DOI] [PubMed] [Google Scholar]
- Weller GER, Lu E, Csikari MM, Klibanov AL, Fischer D, Wagner WR, Villanueva FS. Ultrasound Imaging of acute cardiac transplant rejection with microbubbles targeted to intercellular adhesion molecule-1. Circulation. 2003;108:218–24. doi: 10.1161/01.CIR.0000080287.74762.60. [DOI] [PubMed] [Google Scholar]
- Weller GER, Wong MKK, Modzelewski RA, Lu EX, Klibanov AL, Wagner WR, Villanueva FS. Ultrasonic imaging of tumor angiogenesis using contrast microbubbles targeted via the tumor-binding peptide arginine-arginine-leucine. Cancer Research. 2005;65:533–9. [PubMed] [Google Scholar]
- Wible JH, Jr, Galen KP, Wojdyla JK, Hughes MS, Klibanov AL, Brandenburger GH. Microbubbles induce renal hemorrhage when exposed to diagnostic ultrasound in anesthetized rats. Ultrasound Med Biol. 2002;28:1535–46. doi: 10.1016/s0301-5629(02)00651-8. [DOI] [PubMed] [Google Scholar]
- Willmann JK, Lutz AM, Paulmurugan R, Patel MR, Chu P, Rosenberg J, Gambhir SS. Dual-targeted contrast agent for US assessment of tumor angiogenesis in vivo. Radiology. 2008;248:936–44. doi: 10.1148/radiol.2483072231. [DOI] [PMC free article] [PubMed] [Google Scholar]
- Yang SM, Feng ZC, Leal LG. Nonlinear Effects in the Dynamics of Shape and Volume Oscillations for a Gas Bubble in an External Flow. Journal of Fluid Mechanics. 1993;247:417–54. [Google Scholar]
- Ye T, Bull JL. Microbubble expansion in a flexible tube. Journal of Biomechanical Engineering-Transactions of the Asme. 2006;128:554–63. doi: 10.1115/1.2206200. [DOI] [PubMed] [Google Scholar]
- Yoon SW, Crum LA, Prosperetti A, Lu NQ. An Investigation of the Collective Oscillations of a Bubble Cloud. Journal of the Acoustical Society of America. 1991;89:700–6. [Google Scholar]
- Yuan H, Oguz HN, Prosperetti A. Growth and collapse of a vapor bubble in a small tube. International Journal of Heat and Mass Transfer. 1999;42:3643–57. [Google Scholar]
- Yuan H, Prosperetti A. Gas-liquid heat transfer in a bubble collapsing near a wall. Physics of Fluids. 1997;9:127–42. [Google Scholar]
- Zeff BW, Kleber B, Fineberg J, Lathrop DP. Singularity dynamics in curvature collapse and jet eruption on a fluid surface. Nature. 2000;403:401–4. doi: 10.1038/35000151. [DOI] [PubMed] [Google Scholar]
- Zhao S, Borden M, Bloch SH, Kruse D, Ferrara KW, Dayton PA. Radiation-force assisted targeting facilitates ultrasonic molecular imaging. Mol Imaging. 2004;3:135–48. doi: 10.1162/1535350042380317. [DOI] [PMC free article] [PubMed] [Google Scholar]