

Abstract
The generation and sensation of mechanical force plays a role in many dynamic biological processes, including touch sensation. This paper presents a two-axis micro strain gauge force sensor constructed from multiple layers of SU-8 and metal on quartz substrates. The sensor was designed to meet requirements for measuring tactile sensitivity and interaction forces exerted during locomotion by small organisms such as the nematode Caenorhabditis elegans. The device is transparent and compatible with light microscopes, allowing behavioral experiments to be combined with quantitative force measurements. For the first time, we have characterized the scale of interaction forces generated in wild-type C. elegans in probing and responding to their environment during locomotion. The device features sub-μN force resolution from 1 Hz to 1 kHz, >25 μN range, kHz acquisition rates and biocompatibility.
Introduction
The transduction of force governs many complex processes in both cells and organisms, including touch sensation,1 embryonic development,2,3 structural adaptation,4 and locomotion.5 Although many cell types are capable of mechanotransduction, the process occurs over a variety of timescales. For example, cochlear hair cells sense a force within microseconds6 and mechanoreceptor neurons can do the same within milliseconds,7 whereas loads upregulate nitric oxide production in endothelial cells over minutes8 and alter the gene expression profile in bone cells over hours.9 Touch sensation has been studied for decades and understanding the molecular basis of touch is of societal interest.10 Understanding the general force interactions between organisms and their environment will ultimately aid in the study of fundamental processes that regulate critical processes such as touch sensitivity, adhesion, motility and contraction.
Caenorhabditis elegans is a small (~1 mm long) soil-dwelling nematode that has been studied extensively since 1974.11 It has a compact, well-described nervous system composed of 302 neurons, with six specialized touch receptor neurons that are responsible for the avoidance of light touch.1
Animals have evolved the ability to detect both external forces and self-generated mechanical stimuli. The nematode C. elegans reverses direction upon contact with objects in their environment or in response to forces applied to the body surface. Although subject to extensive genetic analysis, certain aspects of C. elegans mechanosensation remain poorly understand. For instance, although it is known that applied forces >10 μN are sufficient to evoke behavioral responses,12 the minimum applied force that can evoke such responses is not known. Similarly, both the magnitude of forces generated upon contact with an obstacle in freely-moving animals and lateral forces generated during locomotion remain unknown. Measurements of these quantities would facilitate understanding not only of mechanotransduction, but also of locomotion.
Microfabricated devices have been used in the past to study the forces generated and sensed by cells and small organisms. Polydimethylsiloxane (PDMS) has been molded into pillars, seeded with cells and visually tracked during deflection to show that cell morphology regulates adhesion and the generation of traction forces.13 In addition, two-axis polyurethane force sensors with electronic readout have been developed for micro- to millinewton force sensing applications.14 Silicon micromachining has been used to create one-axis force sensors flush with the surface to measure cellular traction forces on a surface using optical feedback,15 which led to a new model for fibroblast motility.
Prior work in microscale force sensing has focused on measuring forces generated by single cells and has utilized optical readout. In this work we present a force sensor for measuring two-dimensional forces in the nano- to micro-newton force range with millisecond time resolution suitable for studying small organisms like C. elegans.16,17 Force measurement is based on electronic readout using metal strain gauges in a Wheatstone bridge configuration. Electronic detection enables simple data acquisition and processing in addition to greater temporal resolution than is typical with optical techniques.
The force sensor is microfabricated from SU-8 and is transparent, which allows the device to be used on both upright and inverted microscopes in combination with visual observations of animal behavior and, potentially, with emerging techniques in optogenetic tools for neuron manipulation and observation.18 The force sensor remains stationary while the animal moves about between the tips of the pillars, resulting in a system that does not require active operator control of a force probe, further simplifying data acquisition. We used the force sensor described here to demonstrate real-time measurement of x-y interaction forces generated by unrestrained C. elegans for the first time.
Design and analysis
The device is fabricated on a transparent substrate and consists of four fixed-guided cantilever arms with a vertical pillar rising from the central junction (Fig. 1). Both the cantilever arms and pillar are fabricated from SU-8. A force applied at the tip of the pillar induces a strain in the base of each cantilever that is sensed as a change in resistance by a metal strain gauge. Differential resistance measurements are taken along the two in-plane axes simultaneously, each with a Wheatstone half-bridge, to calculate the direction and magnitude of the force in two dimensions.
Fig. 1.
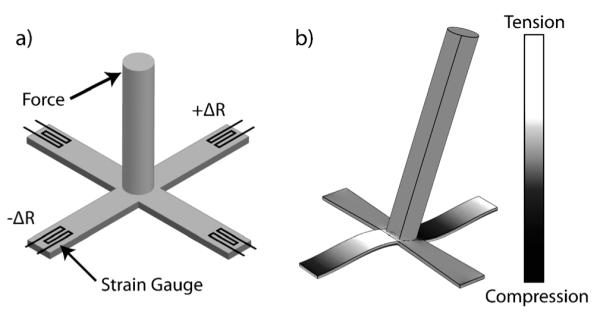
A lateral force applied at the tip of the pillar bends the four cantilever beams on which the pillar is suspended. The bending strain is transduced at the base of the cantilever using metal strain gauges (a). Finite element analysis shows that bending induces alternating regions of compressive and tensile stress in the cantilever beams (b).
Fabricated devices are shown in Fig. 2. In our design, we held the cantilever width fixed at 45 μm and varied the length among devices from 200–500 μm to obtain cantilevers with varying spring constants. The pillar height is approximately 350 μm while pillar diameters vary from 45 to 70 μm. The force-sensing pillars are designed to be significantly stiffer (approximately 80 N/m) than the cantilevers such that pillar bending is negligible during force measurements. Passive pillars surround the active force pillars to provide soil-mimicking structures for worm interactions.19
Fig. 2.
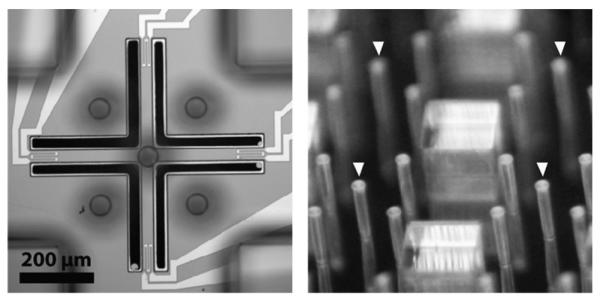
A single device viewed from the top (left) and a 2 × 2 array of finished devices (right). The force sensing pillars, indicated by the arrows, are surrounded by passive spacer pillars and posts.
The system is modeled as a fixed-fixed beam with a moment applied to its center. The linearized output from a Wheatstone bridge in a half-bridge configuration is
where Vin, Vout, and R are respectively the bias voltage across the Wheatstone bridge, measured voltage, and resistance of a single strain gauge. The change in resistance of the metal strain gauges is
where ε is the strain in the metal, ν is the Poisson ratio of the metal and 1 + 2ν is the gauge factor for a metal strain gauge assuming resistivity is not strain dependent. The strain at the surface of a homogenous beam with applied moment M is
where F is the applied force, E is the modulus of the cantilever beam, and h, w, and t are the pillar height, cantilever width and cantilever thickness, respectively. The strain gauge is 20 times thinner than the cantilever beam and assumed to be firmly attached so its contribution to beam mechanics is neglected. The resulting force sensitivity is
The predicted force sensitivity, not including the amplifier gain, is 398 V/N for a bias voltage of 1 V, ν = 0.44 for gold, h = 350 μm, w = 45 μm, and t = 5 μm. We assume E = 4.5 GPa for SU-8,20 however the modulus depends upon processing conditions. For uncertainty analysis, we assume 30% variation in E20 and 10% in the thickness and width of the cantilever beams (typical lithographic and spin coat tolerances) as well as the force post height, resulting in an expected sensitivity variation on the order of 100%, necessitating the individual calibration of each sensor.
Spring constants and displacement sensitivities in the x- and y-axes vary with cantilever length, L. For L = 200 μm, the spring constant and predicted displacement sensitivity were 1.2 N/m and 477 V/m, while for L = 500 μm these parameters were 0.38 N/m and 151 V/m. The theoretical natural frequency of the system varies from 5 to 14 kHz in the plane of the wafer.
Methods and materials
Device fabrication
The fabrication process flow is depicted in Fig. 3. Devices are fabricated on a quartz substrate. A semi-transparent adhesion layer of 50 Å Cr/250 Å Au is first sputtered. This layer prevents delamination of the SU-8 from the substrate during the final hydrofluoric acid (HF) release. A 5 μm cantilever arm layer is spun on using SU-8 2005 at 1750 RPM and then pre-exposure baked with a 65 °C → 95 °C ramp up at 10 °C/min, held at 95 °C for 1 minute, and 95 °C → 70 °C ramp down at 10 °C/min. Temperature ramping reduces the thermal stresses and eliminates cracking along sharp features during processing.
Fig. 3.

Summary of device fabrication process. (a) Alignment marks are etched in a quartz substrate, an adhesion layer of Au/Cr is deposited and the cantilever SU-8 is spun on. (b) SU-8 is patterned to form cantilevers. (c) Strain gauges and bond pads are deposited and patterned. (d) Five layers of SU-8 are spun on and exposed to form the pillars. The wafer is sawed halfway through from the backside. (e) The SU-8 is developed, the die are separated and the suspended force pillar is released in HF. (f) The device is glued to a package and wire bonded.
The cantilever arm layer is patterned with 9 cycles of 4 second exposures with a 30-second rest interval using a 15 mW/cm2 Karl Suss MA-6. The wafers are post-exposure baked for 1 minute at 65 °C and 1 minute at 95 °C then developed for 1 minute before they are hard-baked at 150 °C with a 5 °C/min ramp up and ramp down. The Cr/Au adhesion layer is etched with standard gold and chrome etch solutions (Gold Etchant TFA, Transene Inc., MA, and CR-14 Chromium Photomask Etchant, Cynatec Corporation, CA), using the SU-8 layer as a mask. The SU-8 is roughened for 60 seconds in an oxygen plasma etcher in order to reduce bond pad delamination during wire-bonding. A 100 Å Cr/1000 Å Au layer is sputtered, lithographically patterned and wet etched to form the strain gauges and bond pads.
The pillars and spacer blocks are composed of five 70 μm layers of SU-8 2035. Each layer is spun at 3000 RPM and baked for 3 minutes at 65 °C, then 6 minutes at 95 °C. Once all of the layers are deposited the wafer is baked for 180 minutes at 95 °C to fully harden the SU-8. The pillar and spacer layer are patterned at the same time with 20 cycles of 6 second exposures and 30 second rest intervals. The post-exposure bake is performed for 15 minutes at 95 °C with a 2 °C/min ramp up and ramp down.
The wafer is diced halfway through from the backside using a wafer saw with a diamond blade. The wafer is taped to a carrier wafer at the edges to protect the SU-8 from the vacuum chuck and minimize the force that would otherwise be required to stick the two wafers together. The SU-8 is then developed for 45 minutes with constant agitation and hard-baked for 60 minutes at 150 °C with a 5 °C/min ramp up and ramp down.
The devices are carefully separated along the saw lines and loaded individually into a carrier. They are submerged in a 49% HF solution for 35 minutes in order to undercut the SU-8 cantilever arms and release the force pillars. The SU-8 does not completely stop HF from passing through it and the Cr/Au adhesion layer prevents the acid from etching away the quartz and delaminating the SU-8. As a final step, the devices are glued to a transparent package and wire-bonded with a thermocompression bonder using temperature, time and force settings of 130 °C, 30 ms and 210 grams, respectively.
Device yield from fabrication was excellent (>80%), but a significant fraction of the devices failed during assembly due to bond pad failure. The gold bond pads sit on top of the cantilever SU-8 layer and are prone to tear off during wirebonding. The bond pads consistently delaminated when attempting to use a standard wirebonder with ultrasonic vibration. Eliminating bonder vibration and roughening the SU-8 via oxygen plasma improved yield significantly.
Another major source of failure was the wirebonder breaking through the SU-8 layer and bonding a wire to the gold layer below, shorting out the device in the process. The overall bond pad failure rate was observed to be approximately 5%, resulting in about 1/3 of the successfully fabricated devices failing during assembly because there are eight bond pads per device. The other failure mode we noticed was strain gauge overheating due to their low resistance (50 Ω typical). We observed that the strain gauges typically ruptured for power dissipation greater than 30 mW, however worms began to avoid the strain gauges at 20 mW, and the devices were typically operated at a bias voltage of 0.9 V (~ 16 mW).
Experimental setup and preparation
Wild type (N2) Caenorhabditis elegans cultures were prepared on standard growth plates seeded with OP50 E. coli bacteria and raised at 20 °C for 44 hours to obtain a homogenous population of L4 stage animals. Worms were then transferred to a small, sterile piece of agar that was placed on a glass slide after about 30 minutes. The slide was inverted and attached to the end of a three-axis micromanipulator to position the worms upside down over the force sensors for measurements (Fig. 4a). We observed the animals pushing against the force pillars as well as wrapping around them, as shown in Fig. 4b. Both types of events were scored. Positioning the pillar tips slightly above the agar surface ensured that the worms contacted the pillars within a few microns of the tips because the worms are significantly smaller in diameter (50 μm) than the pillars are high (300 μm). We adjusted the agar plate such that the worms would collide with the tips of the force pillars but the moisture in the agar did not contact the pillars.
Fig. 4.
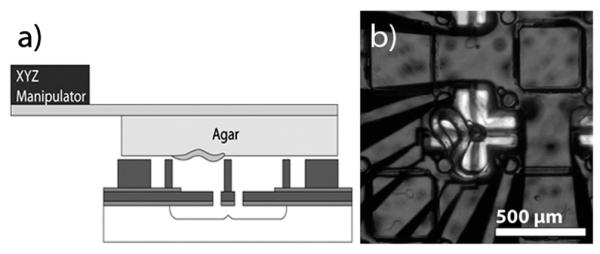
(a) For measurements, a piece of agar with ~20 worms is cut and placed on a glass slide which is inverted and affixed to a three-axis micromanipulator. The experiment is performed under a stereomicroscope and illuminated from the bottom (b). The worm in the center of the image is touching the force pillar.
Measurement circuit
For measurements, the strain gauges along each axis were connected in a balanced Wheatstone bridge with a 1 kHz low pass RC filter and two stages of 100× amplification for a total gain of 10,000× (INA103 and AD622). A bias voltage in the 0.5–1 V range was applied and an optically transparent cover was placed over the sample to shield air currents. The maximum bias voltage is limited by the heat dissipation of the gold resistors and the behavioral effects on worms, which avoided the force posts when high bias voltages were applied.
In order to calibrate the force sensors, a previously calibrated piezoresistive silicon cantilever was mounted on a piezoelectric actuator and used to apply a known force to the pillar tip. The piezoresistive cantilever was calibrated using a laser doppler vibrometer (Polytec OFV3001) and resonance technique described previously.21,22 The reported force pillar sensitivity is the average of at least four measurements, two along each axis.
Electronic noise was measured with a signal analyzer (HP3562) to determine force resolution. Noise measurements were performed under the following conditions to replicate the biological measurement setup: the devices were placed in open air and light, biased at 0.9 V and the spectral density of the noise (1 Hz to 1 kHz bandwidth) was measured four times and averaged after the signal was amplified and low pass filtered as described above. The output signal from the circuit was divided by the net amplifier gain in order to yield the power spectral density of the sensor noise and input voltage noise of the first stage amplifier, which limit force resolution.
Results and discussion
Device characterization
Devices with 200 μm arms showed performance close to FEM simulations with sensitivity of 34 ± 2 V/N (n = 2 devices), off-axis rejection >10:1, and good linearity with the amplifier circuit saturating at ±10 V (Fig. 5a and b). A device with 300 μm arms showed a slightly lower sensitivity of 15.7 V/N (n = 1 device). The average sensitivity of 500 μm devices was 5.3 ± 3 V/N (n = 3 devices).
Fig. 5.

On- and off-axis output voltage for applied forces along the (a) X-axis, (b) Y-axis and (c) Z-axis for a 200 μm device. Note that Z-axis force sensing requires a different measurement circuit configuration. (d) X-axis force sensitivity.
Measured sensitivities are smaller than those predicted analytically because the metal strain gauges are not localized to the base of the cantilever beams. Hysteresis was observed for forces greater than 50 μN, but none was measured for forces less than 10 μN. First order calculations predict device operation is independent of arm length, however devices with 200 and 300 μm long arms exhibited better linearity and sensitivity than devices with 500 μm arms. The reduced stress at the base of longer cantilever arms was likely due to deviations from ideal linear elastic behavior in the SU-8.
One non-ideality for long cantilever devices is an inverted voltage vs. force curve for small forces. We hypothesize that, for small forces, tension develops on the cantilever opposite the direction of applied force, while compression develops in the cantilever in the direction of applied force generating an inverted output voltage (Fig. 5d). Once the force becomes sufficiently large, the pillar begins to pivot and the arms develop the expected compression-tension distribution.
Device and measurement circuit noise were measured from 1 Hz to 1 kHz in order to find the minimum resolvable force. Noise measurements show that a sensor with cantilever arms 300 μm long is able to resolve a force of 260 nN (Fig. 6) over the frequency range of interest. The dominant noise source is the 1/f noise from the first stage amplifier, suggesting that one route to improved performance would be to increase the strain gauge resistance until thermal noise is comparable to 1/f noise, allowing the bias voltage to be increased.
Fig. 6.
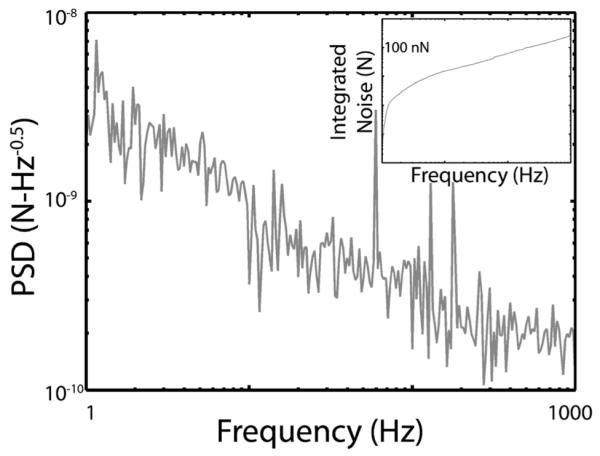
Force noise power spectral density and force resolution (inset) for a force post device and measurement circuit with a sensitivity of 15.7 V/N. Force resolution in the 1 Hz to 1 kHz range is 260 nN.
C. elegans force generation
As an example of a biological force measurements at the micronewton scale, we analyzed the forces generated by freely moving C. elegans worms. For wild-type animals, the mean peak contact force was 2.5 ± 2.5 μN (135 force measurements, approximately 20 worms). Worm-pillar interactions including a series of brief nose touches as well as events in which animals wrapped their bodies around the pillar. All worm-pillar contacts were analyzed in the same way; we did not correlate locomotion or behavioral responses in the present work. A typical force-time plot and a histogram of the measured forces are shown in Fig. 7. All of the measured forces were less than 10 μN and contact events typically lasted tens to hundreds of milliseconds.
Fig. 7.
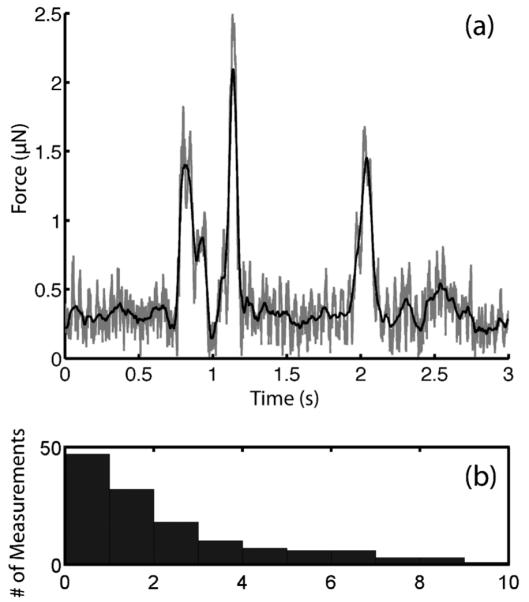
In post-processing, the force vectors along the x- and y-axes are added to obtain the total force (gray line), which is subsequently smoothed using a moving average (black line) and the peaks are identified (a). Peak force is plotted against the frequency of measurement for wild-type C. elegans (b).
Conclusions
We fabricated and demonstrated a novel, optically transparent two-axis force sensor utilizing high-aspect ratio SU-8 and metal strain-gauge force sensors. Additionally, we used this device to measure interaction forces exerted by C. elegans on obstacles during locomotion for the first time. We found that worms generate microNewton forces in a variety of contact positions and that although contact events are brief (<500 ms), they appear to be sufficient to evoke behavioral responses. These initial measurements imply that the entire computation linking mechanosensation to changes in locomotion is completed within a few hundred milliseconds, an inference that imposes constraints not only the sensory abilities of C. elegans, but also on the computational power of its nervous system.
These sensors show promise for biological measurements as well as for other sensing applications such as tactile force, shear stress and fluid flow. The interactions between organisms and their environment can be quantitatively approached using the force pillar system and future behavioral studies could use genetic knockouts and varying environment parameters to study the neural locomotion circuit and touch sensation in microorganisms.
Future work will focus on increasing the resistance of the metal strain gauges to improve force resolution, moving the bond pads from atop the SU-8 to the quartz substrate to improve device yield, and modifying our system to enable the simultaneous measurement of forces with synchronized video analysis of behavioral responses and/or manual classification of worm and post interactions.
Supplementary Material
Acknowledgements
Fabrication work was performed in part at the Stanford Nanofabrication Facility (a member of the National Nanotechnology Infrastructure Network) supported by the NSF under Grant ECS-9731293, its lab members, and the industrial members of the Stanford Center for Integrated Systems. This work was supported by the National Institutes of Health under grants EB006745 (BLP) and NS047715 (MBG) and the National Science Foundation (NSF) under CAREER Award ECS-0449400 (BLP). JCD was supported in part by a National Defense Science and Engineering Graduate (NDSEG) Fellowship; SMC and BP were supported by NSF and Stanford fellowships. The authors thank S. R. Lockery for helpful discussions and S.J. Park and A.A. Barlian for device calibration assistance.
Footnotes
Electronic supplementary information (ESI) available: Collision movie.
References
- 1.Bounoutas A, Chalfie M. Pflügers Archiv European Journal of Physiology. 2007;454:691–702. doi: 10.1007/s00424-006-0187-x. [DOI] [PubMed] [Google Scholar]
- 2.Kim D, Sun Y, Yun S, Hwang CN, Lee S, Kim B, Nelson BJ. IEEE Transaction on Nanobioscience. 2006:5. doi: 10.1109/tnb.2006.875054. [DOI] [PubMed] [Google Scholar]
- 3.Letourneau PC. Dev Biol. 1975;44:92–101. doi: 10.1016/0012-1606(75)90379-6. [DOI] [PubMed] [Google Scholar]
- 4.Breen EC. J Appl Physiol. 2000;88:203–209. doi: 10.1152/jappl.2000.88.1.203. [DOI] [PubMed] [Google Scholar]
- 5.Pelham RJ, Jr., Wang Y.-l. Proceedings of the National Academy of Sciences. 1997;94:13661–13665. doi: 10.1073/pnas.94.25.13661. [DOI] [PMC free article] [PubMed] [Google Scholar]
- 6.LeMasurier M, Gillespie PG. Neuron. 2005;48:403–415. doi: 10.1016/j.neuron.2005.10.017. [DOI] [PubMed] [Google Scholar]
- 7.Johnson KO. Current Opinion in Neurobiology. 2001;11:455–461. doi: 10.1016/s0959-4388(00)00234-8. [DOI] [PubMed] [Google Scholar]
- 8.Topper JN, Cai J, Falb D, Gimbrone MA., Jr. Proceedings of the National Academy of Sciences. 1996;93:10417–10422. doi: 10.1073/pnas.93.19.10417. [DOI] [PMC free article] [PubMed] [Google Scholar]
- 9.Duncan RL, Turner CH. Calcified Tissue International. 1995;57:344–358. doi: 10.1007/BF00302070. [DOI] [PubMed] [Google Scholar]
- 10.Wickremaratchi MM, Llewelyn JG. Postgrad Med J. 2006;82:301–304. doi: 10.1136/pgmj.2005.039651. [DOI] [PMC free article] [PubMed] [Google Scholar]
- 11.Jorgensen EM, Mango SE. Nature Reviews Genetics. 2002;3:356–369. doi: 10.1038/nrg794. [DOI] [PubMed] [Google Scholar]
- 12.WormBook, editor. M. B. Goodman Mechanosensation (January 06, 2006) The C. elegans Research Community, WormBook; DOI: 10.1895/wormbook.1.62.1, http://www.wormbook.org. [Google Scholar]
- 13.Tan JL, Tien J, Pirone DM, Gray DS, Bhadriraju K, Chen CS. Proc Natl Acad Sci U S A. 2003;100:1484–1489. doi: 10.1073/pnas.0235407100. [DOI] [PMC free article] [PubMed] [Google Scholar]
- 14.Engel JM, Chen J, Chang L, Bullen D. Microelectromechanical Systems, Journal of. 2006;15:729–736. [Google Scholar]
- 15.Galbraith CG, Sheetz MP. Proceedings of the National Academy of Sciences. 1997;94:9114–9118. doi: 10.1073/pnas.94.17.9114. [DOI] [PMC free article] [PubMed] [Google Scholar]
- 16.Klejwa N, Harjee N, Kwon R, Coulthard SM, Pruitt BL. Proceedings of Transducers. 2007 [Google Scholar]
- 17.Doll JC, Harjee N, Klejwa N, Kwon R, Coulthard SM, Goodman MB, Pruitt BL. Proceedings of MicroTAS. 2007 [Google Scholar]
- 18.Zhang F, Aravanis AM, Adamantidis A, de Lecea L, Deisseroth K. Nat Rev Neurosci. 2007;8:577–581. doi: 10.1038/nrn2192. [DOI] [PubMed] [Google Scholar]
- 19.Lockery SR, Lawton KJ, Doll JC, Faumont S, Coulthard SM, Thiele TR, Chronis N, McCormick KE, Goodman MB, Pruitt BL. J Neurophysiol. 2008;9:3136–3143. doi: 10.1152/jn.91327.2007. [DOI] [PMC free article] [PubMed] [Google Scholar]
- 20.Khoo HS, Liu KK, Tseng FG. Journal of Micromechanics and Microengineering. 2003:822. [Google Scholar]
- 21.Barlian AA, Park SJ, Mukundan V, Pruitt BL. Sensors and Actuators A: Physical. 2007;134:77–87. [Google Scholar]
- 22.Park S-J, Goodman MB, Pruitt BL. Proceedings of the National Academy of Sciences. 2007;104:17376–17381. doi: 10.1073/pnas.0702138104. [DOI] [PMC free article] [PubMed] [Google Scholar]
Associated Data
This section collects any data citations, data availability statements, or supplementary materials included in this article.