Abstract
Left ventricular remodeling during the development of heart failure is a strong predictor of cardiovascular mortality. However, methods to objectively quantify remodeling-associated shape changes are not routinely available but may be possible with new computational anatomy tools. In this study, we analyzed and compared multi-detector computed tomographic (MDCT) images of ventricular shape at endsystole (ES) and end-diastole (ED) to determine whether regional structural characteristics could be identified and, as a proof of principle, whether differences in hearts of patients with anterior myocardial infarction (MI) and ischemic cardiomyopathy (ICM) could be distinguished from those with global nonischemic cardiomyopathy (NICM). MDCT images of hearts from 11 patients (5 with ICM) with ejection fractions (EF) > 35% were analyzed. An average ventricular shape model (template) was constructed for each cardiac phase by bringing heart shapes into correspondence using linear and nonlinear image matching algorithms. Next, transformation fields were computed between the template image and individual heart images in the population. Principal component analysis (PCA) method was used to quantify ventricular shape differences described by the transformation vector fields. Statistical analysis of PCA coefficients revealed significant ventricular shape differences at ED (p = 0.03) and ES (p = 0.03). For validation, a second set of 14 EF-matched patients (8 with ICM) were evaluated. The discrimination rule learned from the training data set was able to differentiate ICM from NICM patients (p = 0.008). Application of a novel shape analysis method to in vivo human cardiac images acquired on a clinical scanner is feasible and can quantify regional shape differences at end-systole in remodeled myopathic human myocardium. This approach may be useful in identifying differences in the remodeling process between ICM and NICM populations and possibly in differentiating the populations.
Keywords: Cardiomyopathy, Imaging, Remodeling
INTRODUCTION
Heart failure (HF) is a clinical syndrome associated with remodeling of left ventricular shape and size that arises from a variety of causes and is the major contributor to cardiovascular morbidity and mortality in the United States.9 Coronary artery disease (CAD) with infarction, leading to ischemic cardiomyopathy (ICM), is the underlying cause of HF in the majority of patients. Non-ischemic etiologies account for about one-third of heart failure cases. Due to the shape of the left ventricle (LV) and the relative paucity of anatomic landmarks in the heart, there are relatively few objective metrics to quantify the LV shape changes of HF remodeling or the differences in shape associated with different myopathic etiologies. In particular, myocardial scarring following infarction in ICM patients can lead to abnormal loading conditions that in turn induce dilation and ventricular shape alterations. The process of ventricular remodeling in NICM includes both progressive and global reductions of fine collagen weave fibers.14 These changes result in ventricular dilation and reduced relative wall thickness.4 Since ventricular remodeling is a strong predictor of morbidity, cardiovascular mortality and specifically sudden cardiac death,15,16,22 new approaches for quantifying and objectively characterizing ventricular remodeling could aid in the: (a) diagnosis of cardiomyopathyassociated remodeling; (b) assessment of the severity of remodeling; and (c) initiation of therapeutic strategies.
The emerging discipline of Computational Anatomy (CA) builds a mathematical framework for describing anatomic variability in order to perform statistical inference and hypothesis testing on disease-induced anatomic changes.6,17 In this discipline, an anatomy is defined as a collection of landmarks, curves, surfaces, sub-volumes, and tensors.18 A representative heart anatomy (the template) is selected or constructed from a set of imaged anatomic structures, and large deformation mappings are generated and used to deform the template onto different anatomies (targets) such that every point in the template has a corresponding point in the target. Analysis of the local variability of these transformations provides insights regarding regional anatomic variability and structural differences among target anatomies.
CA methods have been used previously to investigate anatomical remodeling of ventricular fiber and laminar sheet structure in isolated, fixed, normal and failing canine hearts studied using diffusion tensor magnetic resonance (DTMR) imaging.7,8 In that prior study, Helm et al. demonstrated a significant reorientation of the myocardial lamina at early-activated sites as well as a change in relative wall thickness.8 They suggested that remodeling of fiber sheets may affect regional wall mechanics and electrical conduction. Those results provided clear evidence that CA can reveal meaningful changes in the structure of excised hearts in normal vs. myopathic states. This raises the possibility that CA tools, delivered to the clinician in a form that is easy to use, may aid in the interpretation and quantification of cardiac imaging data, including assessment of the LV remodeling process in myopathic states. In this study, we extend preliminary results on the excised canine heart to the analysis of 3D in vivo images collected from patients on a clinical scanner to test the hypothesis that CA tools can be used to objectively quantify shape of the human LV and, as a test case, to distinguish shape differences between patients with anterior MI and ICM from others with NICM. This is a non-trivial task since in vivo images are often acquired under conditions of lower signal to noise ratio, motion artifacts due to physiologic respiratory and cardiac motion, and difficulty in isolating the heart from the surrounding tissues. Shape analyses are performed at two cardiac phases, end diastole (ED) and end systole (ES), using in vivo multi-detector computed tomography (MDCT) imaging data collected from patients diagnosed with either ICM from prior infarction or NICM.
METHODS
Human Subjects
All human studies were approved by The Johns Hopkins Institutional Review Board for human investigation, and all subjects gave written informed consent following explanation of the study and protocol. All patients were enrolled in a single-center prospective study of clinically indicated implantable cardioverter defibrillator (ICD) placement for the primary prevention of sudden cardiac death. All patients had left ventricular ejection fraction (LVEF) ≤35% as measured by echocardiography or radionuclide studies, and all patients had undergone coronary angiography. Patients with significant coronary artery stenosis and a history of MI or revascularization were classified as having ICM. Patients were classified as NICM if they had no history of myocardial infarction (MI) or revascularization, and no evidence of coronary artery stenoses <50% of 2 or more epicardial vessels or left main or proximal left anterior descending (LAD) coronary artery stenosis <50%.5 Patients underwent cardiac magnetic resonance imaging and multi-detector CT.
Two sets of patients were defined: (1) training and (2) test. The training set consisted of 11 patients (ICM five men; NICM five men and one woman) selected such that the average LVEF was matched between the two groups. Mean age was 57 ± 4.3 (SD) years and 54.2 ± 11.4 years (p = 0.61) for ICM and NICM subjects, respectively. LVEFs by MRI were 27.3 ± 7.5% and 23.5 ± 8.9% (p = 0.47) for the ICM and NICM groups, respectively. A second set of patients (ICM five men and three women; NICM three men and three women) was selected separately. Mean age was 55.3 ± 13.9 and 49.2 ± 15.5 years (p = 0.45) for ICM and NICM patients, respectively. LVEFs were 30.3 ± 6.1% and 21.8 ± 11.8% (p = 0.1) for ICM and NICM groups, respectively. The shape parameters learned from the training set were used to classify patients in the independent test set into either the ICM or NICM class. The MI location in the ICM group (training and test) varied from anterior to anterior apical and anterior/septal.
Imaging Protocol
Each subject was studied either in a 32 (n = 8) or 64-detector (n = 17) MDCT scanner (Aquilion 32(64), Toshiba Medical Systems Corporation, Otawara, Japan). After scout film acquisition, a 120 mL bolus of iodixanol at a concentration of 320 mg/mL (Visipaque 320; Amersham Health, Little Chalfont, Buckinghamshire, UK) followed by a saline chaser of 30 mL was injected intravenously. Helical scanning was triggered manually and scanning direction was craniocaudal. Imaging was performed using a retrospectively electrocardiogram-gated MDCT protocol with the following parameters: gantry rotation time = 400 ms; detector collimation = 0.5 mm × 32 or 64 (plane resolution varied from 0.36 × 0.36 mm to 0.45 × 0.45 mm, thickness = 0.5 mm); helical pitch = variable depending on heart rate; beam pitch = variable depending on heart rate; tube voltage = 120 kV; tube current = 250 mA; and display field of view = 32.0 cm. Imaging started at the aortic root and stopped caudal to all cardiac structures. The ECG was recorded and used retrospectively to assign source images to their respective phases of the cardiac cycle. Axial images were reconstructed using a multi-segment reconstruction algorithm at 10 time points (the centre of the reconstruction window between 0% and 90% of the cardiac cycle, at 10% intervals).
Left Ventricular Shape Analysis
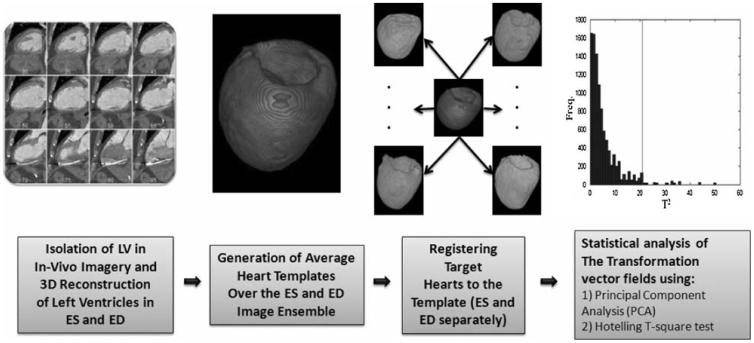
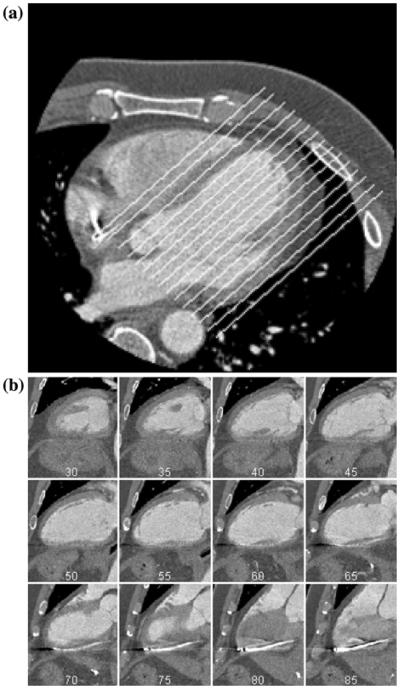
The work-flow used to prepare images, construct the average LV shape model, and perform statistical analyses of differences in LV shape is illustrated in Fig. 1. Axial images were interpolated to an isotropic voxel size of 1 mm3, and then cropped to isolate the LV (far left panel of Fig. 1). A box oriented in the long axis direction of each LV was then positioned manually and images were re-sampled in accordance with the planes parallel to this axis (Fig. 2). Images were then segmented manually by outlining epicardial and endocardial surfaces (papillary muscles and trabeculations were excluded) and smoothed using a 2 mm Full Width Half Maximum (FWHM) Gaussian kernel. ES and ED cardiac phases were determined by visual examination of heart images using short axis views at the mid-ventricular level. If visual examination was not conclusive, LV volumes from all the image sequences in one cardiac cycle were calculated using Simpson's method by summing the endocardial area of all LV long axis slices multiplied by slice thickness. The smallest and largest LV volumes were taken as ES and ED cardiac phases, respectively.
FIGURE 1.
Schematic illustration of the work-flow used for LV shape analysis. After isolating and reconstructing the LV, images were segmented to remove any non-cardiac tissue (not shown). This process improved the accuracy of the image matching algorithm. Next, average LV shape models (templates) were generated separately for ED and ES using affine and non-linear transformations. Once each template was generated, the template was matched to the target LVs using the LDDMM algorithm. Deformation vector fields (the initial momenta) calculated at this step were used to perform statistical shape analysis.
FIGURE 2.
(a) Original MDCT image. The image was re-sampled along the superimposed lines to isolate the LV. (b) Examples of re-sampled planes reconstructed from the image depicted in (a).
Following the image pre-processing steps described above, methods of CA were used to compute the average LV shape, one in ED and one in ES (Fig. 1, 2nd from left panel). Each of these two average LV shapes is known as a deformable template. Methods used to calculate the average LV shape in ES and ED are described in the Appendix (section “Use of the LDDMM Algorithm to Compute Average Heart Shape”). Briefly, affine transformations were first applied to the average LV template in ES (or ED) in order to perform a course matching of the template shape to each of the target LV shapes. This course matching was followed by application of a diffeomorphic, smooth and invertible, transformation so that the deformed template was matched with high accuracy to each target LV imaged in ES or ED.25 The algorithm used to perform this high-accuracy matching is known as the Large-Deformation Diffeomorphic Metric Mapping (LDDMM) algorithm, and is presented in detail in the Appendix (section “The Large-Deformation Diffeomorphic Metric Mapping (LDDMM) Algorithm”). Each of these N transformations, where N is the number of target images, taking the average LV template onto each member of the set of target LVs is completely described by a quantity known as the initial momentum (see Appendix section “The Large-Deformation Diffeomorphic Metric Mapping (LDDMM) Algorithm”). Within-class ES or ED variability of LV shape is then analyzed using the statistical procedures described below.
Statistical Analysis
Analysis of the Training Set Data
To quantify global shape differences for LV shape models at the population level, we performed principal component analysis11 (PCA) on the initial momenta estimated using optimum image transformations from the LDDMM algorithm (See Appendix section “Statistical Analysis Using the LDDMM Derived Initial Momentum and PCA”). PCA is a mathematical method of reorganizing information in the data set of samples. PCA discovers new variables, called Principal Components (PCs) or basis functions that account for maximum variability in the data. In terms of initial momentum, we start with data having dimension equal to the number of voxels (order of several million). These high dimensional data are then represented in terms of a smaller number of PCs, thereby reducing data dimensionality while maximizing the variance accounted for by the basis set. More specifically, the first PC is the direction through the data that explains the greatest variability. The second and subsequent PCs describe the maximum amount of remaining variability in data, etc. Once, the direction of PCs is determined, we express the values of individual samples (e.g., initial momentum) as linear summations of the PCs multiplied by a coefficient that is specific to the individual sample, thus reducing dimensionality of the data to the number of PCs that are combined.
Methods used to determine whether there are statistically significant differences in LV shape between the ICM and NICM subjects in each class (ES or ED) are described in the Appendix (section “Statistical Analysis Using the LDDMM Derived Initial Momentum and PCA”). Briefly, ICM and NICM LVs were considered to have different shapes if the null hypothesis that the sample mean PCA coefficients for the ICM and NICM subjects are equal was rejected at a significance level of p = 0.05. The null hypothesis test was performed using the Hotelling T2 statistic, and significance level was estimated using random shuffling of the data. Using these methods, one or more principal components were identified that supported correct classification of the training data at the prescribed significance level.
Validation of the Classification Rule Using a Novel Test Data Set
To validate the method for discriminating ICM and NICM patients, the LDDMM algorithm was used to match heart images from the individual subjects in the test set to the template that was generated from the training set. This was done separately for images acquired at ED and ES. A new set of coefficients was computed for every subject in the test group using the basis functions estimated from the training group and the method described in previous section. A non-parametric statistical test (Wilcoxon rank sum) was performed on the calculated coefficients to determine whether projection of the data onto the chosen basis function(s) supported discrimination between the patient groups in the test set.
The Jacobian Map Voxel-Based Analysis
The Jacobian map encodes the local volume difference between the template and target image and allows investigation of focal differences in the heart tissue volume between NICM and ICM groups. The Jacobian map represents the change in volume of the unit cube voxel after the deformation of template image to match target image. A value of 1 indicates no volume difference, a value greater than 1 denotes tissue volume increase, and a value below 1 denotes tissue volume decrease. A non-parametric randomized permutation test was used to perform voxel-based analysis on the Jacobian map24 computed using all 25 subjects (N = 13 for ICM and N = 12 for NICM) separately at ES and ED. The p values were corrected for multiple comparison test using the family wise error (FEW) method.24
RESULTS
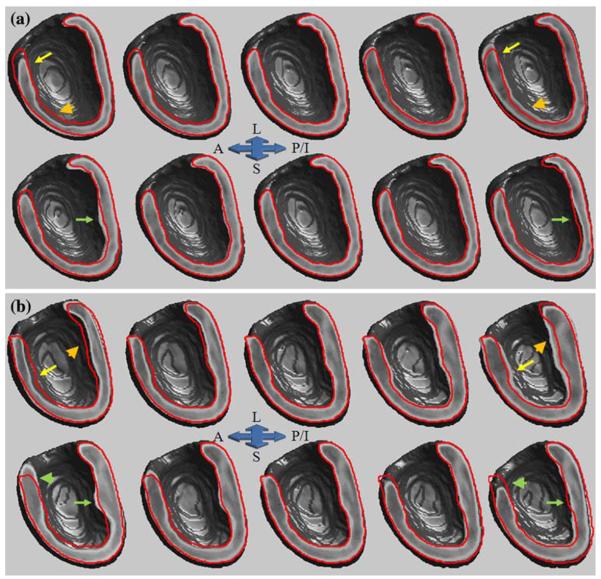
Permutation tests were performed on LV shapes in the training set at ED and ES separately for the first three principal components. These three components accounted for (cumulatively) ~51% and ~60% of the total test set population (11 subjects) variance at ED and ES, respectively. To visually examine the geometric variability of heart shape over all the subjects in the training set at ED and ES, we reconstructed cardiac shape models using the first 2 principal components. Figures 3a-3b show outlines of LV cross-sections in the reconstructed average shape template (ES and ED separately), superimposed on the LV shapes reconstructed using the first and second principal components. This highlights the range of shape variations that are seen in the current training set of 11 subjects. The nature of shape variation in ED and ES follows different patterns. In ED, shape variation along the first principal component appears to account for differences in anterior wall location, size and orientation (Fig. 3a top panel, yellow arrow and golden arrow head) for the two populations (ICM and NICM). The second principal component shows that shape variation over the two populations is localized to the posterior/inferior wall (Fig. 3a bottom panel, green arrow). At ES, both anterior (Fig. 3b top panel, yellow arrow) and posterior/inferior (Fig. 3b top panel, golden arrow head) walls demonstrate different degrees of shape variation. Inspection of these data shows that the first principal component primarily captures large variation in wall thickness. Inspection of the second principle component shows that it primarily captures wall thickness variation localized to the midsection of inferior wall (Fig. 3b bottom panel, green arrow). The primary locations for anterior wall shape variation are basal and midsections (Fig. 3b bottom panel, green arrow head).
FIGURE 3.
Shape variation model reconstructed for the LV using 11 subjects in the training set at ED (a) and ES (b). In each panel (a and b), top images represent LV shape variation along the combined population largest geometric variation axis (first PC) and bottom images represent LV shape variation along the second largest geometric variation axis (second PC). The middle column in each row represents the reconstructed average template (ED for panel “a” and ES for panel “b”). The first and second columns (from left) in each row represents images synthesized at −2 and −1 σ along the first (top row of each panel) and the second (bottom of each panel) principle component and the fourth and fifth columns (from left) in each row represents images synthesized at +1 and +2 σ along the first (top row of each panel) and the second (bottom of each panel) principle component, respectively. To appreciate the magnitude of variation, the cross-sectional contour of average LV shape has been superimposed on the cross sectional view of all other images (A: anterior, L: lateral, S: septum, and P/I: posterior/inferior).
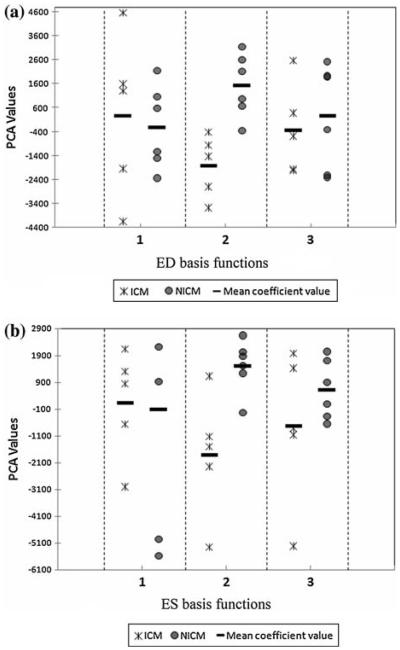
The distribution of PCA coefficients in the training set for the first three basis functions is illustrated in Fig. 4 (scatter plot). Examination of these scatter plots for both ED and ES shows that the second coefficient associated with principal component number 2 provides the largest group separation, and hence provides a potentially discriminative factor for the ICM and NICM groups. The estimated p values for both ED (p = 0.03) and ES (p = 0.03) heart shape coefficients indicates that there are statistically significant shape differences between ICM and NICM groups in the training set.
FIGURE 4.
PC analysis of training set initial momenta (a) The scatter plot of coefficients (ICM [star] and NICM [circle]) associated with heart images acquired at ED using the first 3 PCA basis functions (eigenvectors). (b) The scatter plot of coefficients (ICM [star] and NICM [circle]) associated with heart images acquired at ES using the first 3 PCA basis functions (eigenvectors). Each data point represents PC value calculated for one subject. Note that for both cases, the coefficients for the second PC show minimum overlap, and hence can be used to discriminate groups.
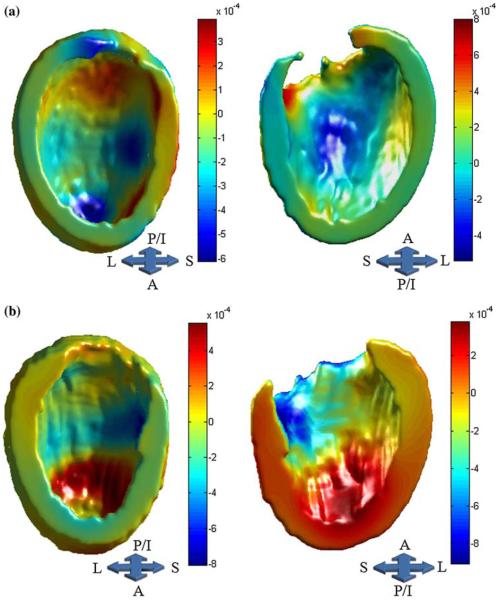
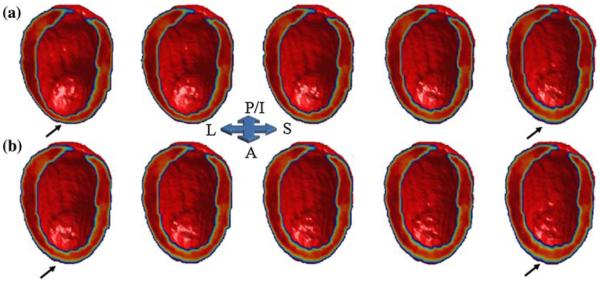
Figures 5a (ED) and 5b (ES) illustrate the pattern of inward and outward heart shape deformation in the training set in the direction of the second largest variation subspace. To better understand the effect of these surface-normal map deformations on within group ventricular shape variation in ICM and NICM subjects, we have generated shape models of the ventricles using the PCA based mean (±2SD) coefficients, computed separately for each group, and show these shape models deformed in the direction of the 2nd PC. Figure 6 shows images constructed for ES. Visual examination of the ventricular shape generated from the second PC indicates that variability in the anterior wall shape within the ICM group is larger than that in the NICM group. We did not observe a similar pattern of heart shape during ED. Note that the shape variation illustrated in Fig. 6 represents within group geometric variation, as defined by the PCA coefficients, for ICM and NICM subjects in the training set. However, in Fig. 3, the geometric variability is depicted for the combined ICM and NICM subjects in the training set.
FIGURE 5.
Surface-normal component map for ED (a) and ES (b) superimposed on the template surface. This map demonstrates the magnitude of outward (warmer colors) and inward movements (cooler colors), as defined by initial velocity vector fields in the direction of the second largest variation subspace. The magnitude and sign of the PC coefficients computed for each group determines the direction of deformations across groups (e.g., negative coefficients reverse the direction of deformation).
FIGURE 6.
Reconstructed LV images at ES for ICM (a) and NICM (b) subjects using the second highest geometric variance direction (second PC). The middle column in each row represents the reconstructed image using group mean coefficient for the second PC. The first and second columns (from left) in each row represents images synthesized at −2 and −1 σ of 2nd PC mean coefficient, and the fourth and fifth columns (from left) in each row represents images synthesized at +1 and +2 σ of the 2nd PC mean coefficient, respectively. Subjects in the ICM group, in comparison to the NICM group, exhibit larger within group variation of anterior wall shape (arrows).
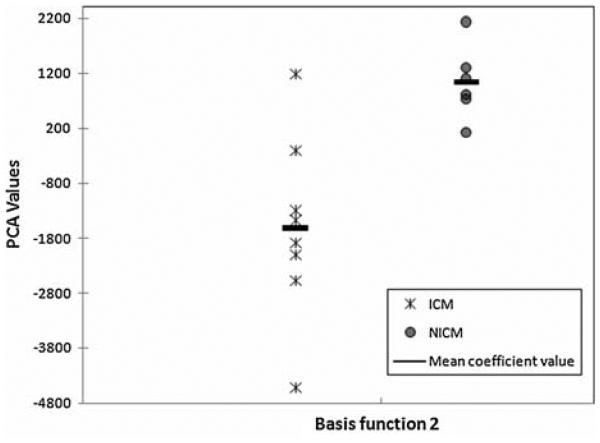
Distribution of ES principal component coefficients for the test set using the second basis function calculated from the training set is shown in Fig. 7. The p value, for discriminating ICM vs. NICM, was 0.008. The choice of basis function relied on the observation that in the training set the second basis function provided the greatest separation between the two patient groups. Our validation analysis did not reveal any statistically significant difference between ICM and NICM PCA-based shape coefficients in ED. Note that ES principal component coefficients in the test set demonstrate larger within group variation for ICM than NICM subjects. This is similar to what we observed for the training set.
FIGURE 7.
PC analysis of test set initial momenta. The scatter plot of coefficients associated with test set heart images acquired at ES using the second PC basis function (eigenvectors) derived from the training set. Each data point represents PC value calculated for one subject. The coefficients show good separation (Wilcoxon rank sum p value 5 = 0.008).
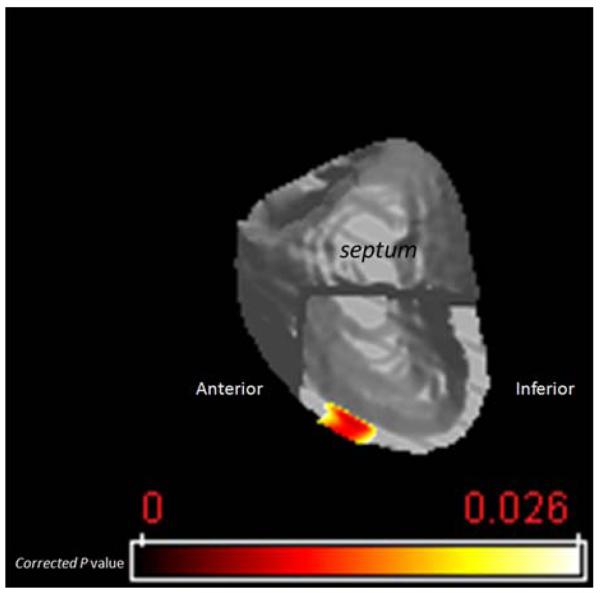
In order to locate regions of significant myocardial tissue volume differences between the NICM and ICM groups, a voxel-based statistical analysis was performed on the Jacobian maps using the 25 subjects from both the training and test sets. We performed a non-parametric permutation (10,000 iterations) test to estimate regions in NICM vs. ICM subjects that underwent either statistically significant regional tissue volume increase or decrease. Only voxels with the corrected p values less than 0.025 were considered significant. Figure 8 illustrates regions (superimposed on the ES average LV template) that on average had significantly larger tissue volume in NICM vs. ICM group at ES. These regions coincide with the mid anterior section of LV. We did not find any significant voxel that on average had smaller tissue volume in NICM vs. ICM group at ES. The tissue volume examination of the LVs at ED did not reveal any significant difference between two groups.
FIGURE 8.
Map of the voxel-based significance of tissue expansion for NICM group relative to ICM group. The color scale represents the significance of tissue expansion measured in corrected p values, with yellow representing the least significant area.
DISCUSSION
In this study, methods of computational anatomy, in conjunction with PCA analysis, have been used for the first time to analyze in vivo human cardiac LV shape differences in patients with LV dysfunction. The results demonstrate that this approach can reliably quantify shape changes in remodeled myopathic hearts and that there are regional shape differences that can discriminate between patients with ischemic cardiomyopathy due to prior anterior MI and those with a global non-ischemic cardiomyopathy. A classification rule was first identified using a training data set, and then applied to an entirely novel test data set not used in the learning process. Additionally, we identified larger variation in the shape of the LV anterior wall in the ICM vs. NICM training group during maximum contraction (ES), consistent with the anterior location of the infarct, which our shape analysis method was sensitive enough to capture. Moreover, we provided detailed spatial mapping of myocardial tissue volume change by using a Jacobian map. Observation of significant regional (anterior wall) tissue volume expansion in the NICM group vs. the ICM group in ES is in accordance with the location of infarction and wall thinning in infarcted regions of the ICM patients LVs. Clearly, due to the small number of subjects, these results should be interpreted with caution. However, the ability to potentially distinguish these ICM patients from those with NICM in the novel test data set suggests that the approach described here has great promise.
MDCT has significant unique advantages over other tomographic imaging modalities, including high spatial resolution and the ability to image patients with ICDs. A limitation of using MDCT is relatively low temporal resolution, which has been suggested as an explanation for overestimated LV volume measurements.21 However, this study relies on intra and inter-group regional ventricular shape variation to assess remodeling rather than absolute single volume measurements.
Comparison with Other Imaging Modalities
Other non-invasive imaging techniques such as cardiac magnetic resonance imaging (CMR) or echocardiography provide invaluable information about ventricular function in ICM and NICM patients. While echocardiography is quick and affordable, it suffers from relatively low reproducibility since the acquired images are typically 2D and any volumetric calculations rely on geometric assumptions. Although there have been attempts to construct real-time 3D echo-cardiographic images of the heart,20,23 these images have low spatial resolution and are prone to wider inter-measurement variability compared with MDCT and CMR. On the other hand, CMR provides excellent soft-tissue contrast and high temporal resolution. Nevertheless, CMR images suffer from relatively low out of plane resolution and associated partial volume artifacts that could potentially affect LV shape analysis.23 Clearly, each of these imaging modalities provides useful information that potentially complements the others and consequently, methods that perform heart shape analysis using a combination of different image modalities may be valuable.
Clinical Implications
One of the important aspects of this study is the potential for future applications of CA methods to clinical studies. Ventricular geometry undergoes local and global changes in different disease states. LV shape provides prognostic information in addition to that of clinical status, anatomy, and function in myocardial infarction13 (MI) and dilated cardiomyopathy.3 To discover anatomic shape markers, we must first understand the nature of variation of ventricular shape by bringing different hearts into registration with one another in order to quantify structural differences at corresponding points. Once the hearts are placed in the common coordinate system using CA tools, by direct comparison between a patient's ventricle and the normal average ventricle, regional shape alterations can be quantified and linked directly with coronary anatomy and with ventricular perfusion, metabolism, and function. This will facilitate more quantitative analysis of the effects of disease on ventricular shape, the interrelationship between shape and function, and the effect of reperfusion and revascularization strategies on the remodeling process.
Limitations
One limitation of the current study is the modest number of subjects in the training set. To avoid bias in our statistical analysis, we employed a non-parametric permutation test that does not assume any pre-defined (e.g., Gaussian) underlying statistical distribution for the measured shape parameters. The fact that significant differences in ventricular shape between the two groups identified in the training population were confirmed on a test population indicates that the observed shape differences between ICM and NICM hearts in the training set are not a random effect. The identified shape changes likely result from the ventricular remodeling process and can now be quantitatively characterized by CA approaches. Another potential limitation is that in the current study our ICM population consisted only of patients with anterior wall MI. Although future studies of other causes of ICM such as multiple MI or chronic ischemia without MI are clearly needed, these observations are not only novel but clinically relevant since anterior MI are common and associated with ventricular remodeling and adverse outcomes.
Conclusion
Application of a novel shape analysis method using in vivo MDCT images demonstrates that regional shape differences in end-systole can be quantified and used to differentiate two ICM and NICM populations. The proposed method introduces a promising approach to measure ventricular shape alterations associated with remodeling process in cardiac disease using in vivo images. This information could potentially be used to identify pathology and follow the disease progress according to their disease status and response to treatment.
ACKNOWLEDGMENTS
This research was supported by Grants from the National Institute of Health (HL70894, HL52307, R24 HL085343), the American Heart Association (0725357U), and the Donald W. Reynolds Cardiovascular Clinical Research Center at The Johns Hopkins Hospital. The authors would like to thank Dr. Patrick Helm for his helpful technical comments. Dr. Weiss received research funds from Reynolds foundation and NIH (HL61912). Drs. Lardo, George, and Lima received research funds from Toshiba, Inc. Dr. Lardo received speaker's honoraria from Toshiba, Inc. Dr. George received speaker's bureau from Toshiba, Inc. and serves as a consultant for Medrad, Inc. Dr. Wu received research funds from General Electric Healthcare. The remaining authors report no conflicts.
APPENDIX
Methods of Heart Shape Analysis
Quantification of anatomical variation requires transformation of different members of an ensemble of anatomical structures (in this case, heart images obtained in ED and ES) into a common extrinsic coordinate system. In computational anatomy, structures are represented using a deformable template (a representative heart image, one for ES and one for ED) and anatomies (specific heart images) are generated using a set of diffeomorphic (smooth and invertible) transformations acting on the template.17 First, a 9 parameter affine intensity based registration algorithm minimizing a cost function based on mutual information was used for course alignment of anatomies with respect to rotations, translations, and scalings.10 Next, a non-rigid high dimensional intensity based transformation method (the Large-Deformation Diffeomorphic Metric Mapping (LDDMM) algorithm,2 described below) was used to match images at the voxel level. In this algorithm, optimal correspondences between images are estimated by computing geodesics (paths of minimal energy) in the shape space and are solutions to a system of partial differential equations. For each target heart a unique evolution (geodesic) path that deforms the template geometry onto the target is defined by an initial velocity vector field applied to the template geometry. Therefore, from the template and the initial momentum (a quantity derived from the initial velocity vector field), the entire geodesic path between template and target geometry may be reconstructed. This reconstruction process using the initial momentum is referred to as geodesic shooting.
The Large-Deformation Diffeomorphic Metric Mapping (LDDMM) Algorithm
Let Ω ⊆ Rn (n = 3 for 3D space) be a bounded domain on which the image functions I: Ω → Rd (with d = 1 for scalar intensity images such as CT scan) are defined. In this model, image function I defines an ensemble of observed anatomical imagery “I” which is an orbit under diffeomorphic transformations G with the law of composition ψ · φ = ψ ○ φ. For any φ in the set of continuous smooth and invertible transformations and any image I, φ · I = I ○ φ−1 defines an action of G on “I”. Given two images, I0 and I1, the task is to find a transformation φ that register these two images (I1 = φ · I0 = I0 ○ φ−1). This deformation is estimated as the end point of a time indexed flow (φ = ϕ1) associated with a smooth, compactly supported velocity vector field νt ∈ V, t ∈ [0, 1]. These two entities are related by: where boundary points are defined as , ∀x ∈ Ω and . The optimal solution can be achieved by the integration of the the above formula after computing the optimal velocity through this variational problem:
| (1) |
The diffeomorphism is ensured by enforcing sufficient smoothness on the space of allowable velocity vector fields V via defining a differential operator L of type L = (−αΔ + γ)βInxn where β > 1.5 in 3D space such that ∥f∥ν = ∥Lf∥L2 where ∥·∥L2 is the standard L2 norm for square integrable functions. The gradient of the variational problem is defined as:
| (2) |
where ϕs,t (x) denotes the position of the particle at time t while it is originally located at position x at time s, and are the determinant of Jacobian and the gradient of functions and , respectively. Operator K is a compact self-adjoint operator such that for any smooth vector field a in V,K(L*L)a = a, for L. Optimizing the velocity results in transformations that represent the shortest length path between each template and target particles. At the optimal geodesic flow, the variational gradient of Eq. (2) vanishes, which translates to:
| (3) |
In analogy with the laws of mechanics, (L*L)νt is called momentum that is proportional to αt (the magnitude of movement in the direction of gradient). At time t = 0 the initial momentum defines the initial trajectory that will transform template into the coordinate system of target image. Miller et al.19 have demonstrated, under the theory of geodesic shooting, that the scalar quantity α is conserved and can be computed at any other particular time greater than 0 given initial velocity and template anatomy are available. Geodesic evolution, starting from the optimum initial momentum, defines the entire path of evolution from template image to target.
Use of the LDDMM Algorithm to Compute Average Heart Shape
We have employed the LDDMM algorithm along with the theory of geodesic shooting to create average heart templates. The first step in this process is to estimate an optimal diffeomorphic transformation, using the LDDMM algorithm, which maps a provisional template to the individual target images in a cohort population. This step provides optimal initial velocity vector fields that will be used in the second step to compute average initial velocity vectors. The final step is to propagate these averaged initial velocity vectors along the direction of minimal energy path (geodesic). The final result is an evolved template that is in closer proximity to the true average shape. These steps are iterated until the magnitude of the averaged initial velocity approaches zero. In practice, due to noise interference in an inexact matching set, the magnitude of the averaged initial velocity reaches some minimum other than zero.
Statistical Analysis Using the LDDMM Derived Initial Momentum and PCA
The family of initial momentum vector fields (N = total number of subjects in ICM and NICM groups combined) on the C2 manifold I0 (template) belong to a set of zero-mean (mean subtracted) Gaussian random fields with an empirical covariance estimated as:
| (4) |
The initial momentum can be extended using a complete orthonormal base {λk, Φk, k = 1, …, N} as:
| (5) |
where are the coefficients for the ith subject associated with kth basis function.12 Here dyl is the measure around voxel yl (i.e., voxel size). In this construction, λk and Φk are eigenvalues and the corresponding eigenvectors, respectively. The eigenvectors can be computed via singular value decomposition of the empirically estimated covariance.
Assuming the population under investigation consists of G groups, with each having Ng subjects g = 1, …, G, then for each group g with all its subjects, let be the vector coefficients associated with the eigenvectors as described before. Then the coefficient fields are samples of a random field with mean Z̄g. All groups have common, but unknown covariance Σ. If the subject population is grouped into N1 ICM cases and N2 NICM cases, then coefficient fields and are random processes with common covariance Σ and sample mean Z̄1 and Z̄2, respectively. The sample mean is computed as:
| (6) |
and the pooled sample covariance is:
| (7) |
Then the two groups of ventricular geometry are considered different in shape if the null hypothesis Ho : Z̄1 = Z̄2 is rejected with predetermined significance level (e.g., 0.05). To proceed, define the Hotelling T2 statistics1 as:
| (8) |
Then, for all permutations of two given groups, new means and covariances are calculated employing Monte Carlo simulations to generate a large number of uniformly distributed random permutations. Collection of T2 distributions for each permutation gives rise to an empirical distribution F̂ using:
| (9) |
to estimate F (M is the number of basis function that has been used to estimate principal coefficients). The null hypothesis is rejected when falls below a predetermined significant level.25
REFERENCES
- 1.Anderson T. An Introduction to Multivariate Statistical Analysis. Wiley; New York: 1958. [Google Scholar]
- 2.Beg MF, Miller MI, Trouv'e A, Younes LB. Computing large deformation metric mappings via geodesic flows of diffeomorphisms. Int. J. Comput. Vision. 2005;61:139–157. doi:10.1023/B:VISI.0000043755.93987.aa. [Google Scholar]
- 3.Douglas PS, Morrow R, Ioli A, Reichek N. Left ventricular shape, afterload and survival in idiopathic dilated cardiomyopathy. J. Am. Coll. Cardiol. 1989;13:311–315. doi: 10.1016/0735-1097(89)90504-4. [DOI] [PubMed] [Google Scholar]
- 4.Eichhorn EJ, Bristow MR. Medical therapy can improve the biological properties of the chronically failing heart. A new era in the treatment of heart failure. Circulation. 1996;94:2285–2296. doi: 10.1161/01.cir.94.9.2285. [DOI] [PubMed] [Google Scholar]
- 5.Felker GM, Shaw LK, O'Connor CM. A standardized definition of ischemic cardiomyopathy for use in clinical research. J. Am. Coll. Cardiol. 2002;39:210–218. doi: 10.1016/s0735-1097(01)01738-7. doi:10.1016/S0735-1097(01)01738-7. [DOI] [PubMed] [Google Scholar]
- 6.Grenander U, Miller MI. Computational anatomy: an emerging discipline. Q. Appl. Math. 1998;LVI:617–694. [Google Scholar]
- 7.Helm P, Beg MF, Miller MI, Winslow RL. Measuring and mapping cardiac fiber and laminar architecture using diffusion tensor MR imaging. Ann. NY Acad. Sci. 2005;1047:296–307. doi: 10.1196/annals.1341.026. doi:10.1196/annals.1341.026. [DOI] [PubMed] [Google Scholar]
- 8.Helm PA, Younes L, Beg MF, Ennis DB, Leclercq C, Faris OP, McVeigh E, Kass D, Miller MI, Winslow RL. Evidence of structural remodeling in the dyssynchronous failing heart. Circ. Res. 2006;98:125–132. doi: 10.1161/01.RES.0000199396.30688.eb. doi:10.1161/01.RES.0000199396.30688.eb. [DOI] [PubMed] [Google Scholar]
- 9.Hunt SA, Baker DW, Chin MH, Cinquegrani MP, Feldman AM, Francis GS, Ganiats TG, Goldstein S, Gregoratos G, Jessup ML, Noble RJ, Packer M, Silver MA, Stevenson LW, Gibbons RJ, Antman EM, Alpert JS, Faxon DP, Fuster V, Gregoratos G, Jacobs AK, Hiratzka LF, Russell RO, Smith SC., Jr. ACC/AHA Guidelines for the Evaluation and Management of Chronic Heart Failure in the Adult: Executive Summary A Report of the American College of Cardiology/American Heart Association Task Force on Practice Guidelines (Committee to Revise the 1995 Guidelines for the Evaluation and Management of Heart Failure) Circulation. 2001;104:2996–3007. doi: 10.1161/hc4901.102568. doi:10.1161/hc4901.102568. [DOI] [PubMed] [Google Scholar]
- 10.Jenkinson M, Bannister P, Brady M, Smith S. Improved optimization for the robust and accurate linear registration and motion correction of brain images. Neuroimage. 2002;17:825–841. doi: 10.1016/s1053-8119(02)91132-8. doi:10.1016/S1053-8119(02)91132-8. [DOI] [PubMed] [Google Scholar]
- 11.Jolliffe IT. Principal Component Analysis. Springer; 2002. p. 502. [Google Scholar]
- 12.Joshi S, Grenander U, Miller M. j. g. The geometry and shape of brain sub-manifolds. Int. J. Pattern Recogn. Artif. Intell. Special Issue Process. Magn. Resonan. Imag. 1997;11:1317–1343. doi:10.1142/S0218001497000615. [Google Scholar]
- 13.Jugdutt BI. Identification of patients prone to infarct expansion by the degree of regional shape distortion on an early two-dimensional echocardiogram after myocardial infarction. Clin. Cardiol. 1990;13:28–40. doi: 10.1002/clc.4960130107. [DOI] [PubMed] [Google Scholar]
- 14.Komamura K, Shannon RP, Ihara T, Shen YT, Mirsky I, Bishop SP, Vatner SF. Exhaustion of Frank-Starling mechanism in conscious dogs with heart failure. Am. J. Physiol. Heart Circ. Physiol. 1993;265:H1119–H1131. doi: 10.1152/ajpheart.1993.265.4.H1119. [DOI] [PubMed] [Google Scholar]
- 15.Lee TH, Hamilton MA, Stevenson LW, Moriguchi JD, Fqnarow GC, Child JS, Laks H, Walden JA. Impact of left ventricular cavity size on survival in advanced heart failure. Am. J. Cardiol. 1993;72:672–676. doi: 10.1016/0002-9149(93)90883-e. doi:10.1016/0002-9149(93)90883-E. [DOI] [PubMed] [Google Scholar]
- 16.Meluzin J, Spinarova L, Hude P, Krejci J, Dusek L, Vitovec J, Panovsky R. Combined right ventricular systolic and diastolic dysfunction represents a strong determinant of poor prognosis in patients with symptomatic heart failure. Int. J. Cardiol. 2005;105:164–173. doi: 10.1016/j.ijcard.2004.12.031. doi:10.1016/j.ijcard.2004.12.031. [DOI] [PubMed] [Google Scholar]
- 17.Miller M, Banerjee A, Christensen G, Joshi S, Khaneja N, Grenander U, Matejic L. Statistical methods in computational anatomy. Stat. Methods Med. Res. 1997;6:267–299. doi: 10.1177/096228029700600305. doi:10.1191/096228097673360480. [DOI] [PubMed] [Google Scholar]
- 18.Miller MI, Christensen GE, Amit Y, Grenander U. Mathematical textbook of deformable neuroanatomies. Proc. Natl. Acad. Sci. USA. 1993;90:11944–11948. doi: 10.1073/pnas.90.24.11944. doi:10.1073/pnas.90.24.11944. [DOI] [PMC free article] [PubMed] [Google Scholar]
- 19.Miller MI, Trouve A, Younes L. Geodesic shooting for computational anatomy. J. Math. Imag. Vision. 2006;V24:209–228. doi: 10.1007/s10851-005-3624-0. [DOI] [PMC free article] [PubMed] [Google Scholar]
- 20.Ota T, Fleishman CE, Strub M, Stetten G, Ohazama CJ, von Ramm OT, Kisslo J. Real-time, three-dimensional echocardiography: feasibility of dynamic right ventricular volume measurement with saline contrast. Am. Heart J. 1999;137:958–966. doi: 10.1016/s0002-8703(99)70422-9. doi:10.1016/S0002-8703(99)70422-9. [DOI] [PubMed] [Google Scholar]
- 21.Salm LP, Schuijf JD, de Roos A, Lamb HJ, Vliegen HW, Jukema JW, Joemai R, van der Wall EE, Bax JJ. Global and regional left ventricular function assessment with 16-detector row CT: comparison with echocardiography and cardiovascular magnetic resonance. Eur. J. Echocardiogr. 2006;7:308–314. doi: 10.1016/j.euje.2005.07.002. doi:10.1016/j.euje.2005.07.002. [DOI] [PubMed] [Google Scholar]
- 22.St John Sutton M, Lee D, Rouleau JL, Goldman S, Plappert T, Braunwald E, Pfeffer MA. Left ventricular remodeling and ventricular arrhythmias after myocardial infarction. Circulation. 2003;107:2577–2582. doi: 10.1161/01.CIR.0000070420.51787.A8. doi:10.1161/01.CIR.0000065226.24159.E9. [DOI] [PubMed] [Google Scholar]
- 23.Sugeng L, Weinert L, Thiele K, Lang RM. Real-time three-dimensional echocardiography using a novel matrix array transducer. Echocardiography. 2003;20:623–635. doi: 10.1046/j.1540-8175.2003.t01-1-03031.x. doi:10.1046/j.1540-8175.2003.t01-1-03031.x. [DOI] [PubMed] [Google Scholar]
- 24.Nichols TE, Holmes AP. Nonparametric permutation tests for functional neuroimaging: a primer with examples. Hum. Brain Mapp. 2002;15:1–25. doi: 10.1002/hbm.1058. doi:10.1002/hbm.1058. [DOI] [PMC free article] [PubMed] [Google Scholar]
- 25.Wang L, Joshi SC, Miller MI, Csernansky JG. Statistical analysis of hippocampal asymmetry in schizophrenia. Neuroimage. 2001;14:531–545. doi: 10.1006/nimg.2001.0830. doi:10.1006/nimg.2001.0830. [DOI] [PubMed] [Google Scholar]


