Abstract
Dose reconstruction can be used to improve the accuracy of dose evaluation throughout a treatment course. Its working mechanism is based on deformable image registration (DIR). The purpose of this paper is to develop a method to estimate the dose reconstruction error associated with the inaccuracy of DIR algorithms. To reach this goal, we quantified dominant errors in DIR in terms of unbalanced energy (UE), which were compared with the standard displacement error (SDE). Their high similarity, characterized by Pearson correlation coefficient, was verified through nine ‘demons’ registration instances performed within simulated reference frames. Based on the similarity, the dose-warping discrepancy at each voxel was defined as a line integral of the dose gradient within the voxel's neighborhood whose boundary was determined by the voxel's UE value. From this definition, the dose reconstruction error was then calculated at each voxel on nine prostate computed tomography images, obtained from a patient treatment course. The average of the Pearson correlation coefficients between UE and SDE over the simulated registration instances was above 70%. The mean value of the dose reconstruction errors in a target volume was calculated for each of nine treatment fractions. The averaged percentage of these mean values with respect to the prescribed dose on the target volume was 1.68%. These results are consistent with contour-based mean dose error evaluations. This paper has established a relation between a registration error and its induced dose reconstruction discrepancy. It allows an automatic validation method to be developed to estimate the dose accumulation error at each voxel in clinical settings.
1. Introduction
In radiation therapy, it is a well-accepted fact that the clinical effect is proportional to the accumulated dose received by each tumor and normal tissue cell. With the introduction of frequent imaging during the treatment process, such as cone-beam computed tomography (CT) systems (Jaffray et al 2002, Oldham et al 2005, Sykes et al 2005), CT-on-rails systems (Ma and Paskalev 2006, Zhang et al 2007) and proposed on-board magnetic resonance systems (Baldwin et al 2005, Fox et al 2006, Tomas et al 2006) coupled with the use of deformable image registration (DIR), determination of the accumulated dose for arbitrary tissue voxels over a course or fraction of therapy when tissues move with respect to each other is becoming clinically practical (Christensen et al 2001, Foskey et al 2005, Flampouri et al 2005, Schaly et al 2004, Yan et al 1997, 1999). For current DIR algorithms, the displacement vector fields (DVFs) of image registrations, which are used to map the patient dose from one instance of a patient's anatomy (e.g., the time of treatment) to a reference anatomic instance (e.g., the planning image set), are not without error (Wang et al 2005, Li et al 2005, Foskey et al 2005, Webb 2006). The fact that DVFs do not accurately map the motion of each tissue element between anatomic instances results in errors in mapping information, such as dose, between those anatomic instances. The purpose of this paper is to develop a method to automatically assess DVF errors and their potential impact on patient dose reconstruction at other anatomic instances.
Dose reconstruction is becoming an important process in radiation therapy because it can be employed to calculate the total dose delivered in the presence of organ motion and deformation (Bortfeld et al 2004, Keall et al 2003, Siebers et al 2005, Unkelbach and Oelfke 2004). For example, with the known delivered dose at each physical point, three-dimensional (3D) fractionated treatment plans can be updated with different strategies in image-guided radiation therapy, 4D dosimetry assessment can be adjusted through intrafractional dose summation for lung patients and brachytherapy can be combined with external beam radiation therapy to determine the combined dose or biologically effective dose. Furthermore, the quantification of inputs to tissue response models can be improved through use of accumulated dose. The success of these applications largely depends on the accuracy of the dose addition and its underlying DIR.
The accuracy of DIR is compromised by many factors. For example, in a region with low-intensity gradients (e.g., the interior part of a solid organ like the prostate), displacement variations are insensitive to the registration similarity metric used during a registration process. Consequently, registration errors result easily. Meanwhile, the radiation dose distribution can have substantial gradients in this region. As a consequence, the dose-warping error in this region can be significant.
Unfortunately, there is no ground truth for a complete validation of DIR in a clinical setting. For example, whereas contour comparison, a technique often used in the validation of displacement errors around organ boundaries, may provide a gross volumetric dose evaluation (Gordon and Siebers 2007, Lu et al 2006, Rosu et al 2005), it cannot be used to check dose-warping errors at voxels in the interior of an organ or at a place where contours are unable to be delineated. The general lack of a ground truth in DIR makes both the spatial error of DIR and its consequent dosimetric discrepancy in image-guided radiation therapy (IGRT) hard to define and therefore difficult to measure. This paper addresses these two correlated issues in a systematic manner. We present the framework in terms of dose accumulation over multiple treatment fractions, but the methods presented are equally applicable to dose addition over 4D image sets or adding external beam and brachytherapy dose distributions.
In this paper, we will present the definition of voxel-based dose reconstruction error in section 2 and then quantify the relation between the displacement error and the unbalanced energy (UE) of deformable registrations in section 3. In section 4, we substitute the UE into the dose error definition to measure the dose reconstruction errors accumulated over nine treatment fractions. Results are compared with the contour-based mean dose evaluations. Discussion and conclusion are given in the last two sections.
2. Dose reconstruction error
Because of organ motion and setup errors throughout a treatment course, the same physical point may exist at different locations on different treatment images. To assess potential treatment outcome (and enable possible replanning) the dose delivered to each physical point in each fraction must be accumulated to determine the total delivered dose distribution. In this section, we briefly describe the procedure of dose accumulation realized through the aid of DIR (Foskey et al 2005, Lu et al 2006, Schaly et al 2004) and then specify its associated dosimetry error.
2.1. Dose accumulation
Suppose T is a planning image. A physical point p on T moves to on a treatment image Si. Image registrations are performed from T to each Si for each treatment session i. For an intensity-based image registration, when the deformation map hi maximizes a similarity metric M(T(p), Si(p + hi(p))), then the physical target satisfies . Consequently, the total dose delivered to the point p can be accumulated as
| (1) |
where N is the number of image sets, and φi (p) = p + hi (p). Because of various factors, hi is not error free. Registration errors, validated with different approaches such as phantoms (Wang et al 2005, Xiong et al 2006), landmarks (Brock et al 2005, Bharatha et al 2001, Malsch et al 2006), contours (Lu et al 2006, Foskey et al 2005, Gao et al 2006) or simulated reference frames (Wang et al 2005, Zhong et al 2007, Chi et al 2006), have been reported. Compounding the DIR errors, delivered dose distributions are frequently non-uniform, with large dose changes between adjacent voxels, for example, on a beam edge. These scenarios can exaggerate the dosimetric impact of image registration errors. For accurate patient dosimetry, the discrepancy of the cumulative dose needs to be estimated for each clinical case.
2.2. Voxel-based characterization of dose accumulation error
Registration errors at different locations may have different effects on the cumulative dose. Suppose there is an image registration from T to S with a deformation map φ1. Consider a point p (p ∈ T) is physically moved to q0 (q0 ∈ S) between the two time frames, while the image registration map φ1 generates q1 = φ1 (p). The dose-warping error from φ1 at p is then defined by
| (2) |
To simplify the following discussion, we first assume a one-dimensional dose distribution from q0 to q1. The interval Δ(q1) = [q0, q1] is evenly partitioned by the set {r(0) = q0, r(1),…, r(k) = q1}. Then (2) can be written as
| (3) |
The position of q0 is unknown; hence, the size of the domain of integration Δ(q1) ⊂ S cannot be determined. Actually, |Δ(q1)| comes from the distance between q0 and q1, the registration displacement error at p. Thus, to calculate the dose-warping discrepancy defined in (3), the registration error must be quantified.
In the next section, we try to quantify the displacement error at each voxel for a given image registration.
3. Deformable image registration error
In general, the efforts in the validation of deformable registration can be summarized into two categories. One is to measure its spatial discrepancy from a pseudo gold standard such as manually drawn contours, physical phantoms, or numerical simulations. The other is to quantify the physical fidelity of the resultant deformation mappings based on their consistency with the inverse or composition of these mappings or by measuring their Jacobean determinant. The method proposed in this paper will follow the second approach.
3.1. Characterization of deformable image registration error
Tissue deformation can be described as a mechanical process. In solid continuum mechanics, the deformation of soft tissue can be characterized by a set of linear relations between the vectors of the displacements de and elastic forces Fe at the vertices of each element e, Kede= Fe, where Ke is the stiffness matrix whose entries contain a Young's modulus as a common factor. If Poisson's ratio in Ke is considered to be constant, the overall elastic force at each node is a summation of the contribution from its neighborhood elements. Consequently, the total elastic force at the node i is , where N Bi is the set of elements containing the node i, is the unknown displacement of the kth vertex in element j, Ej is Young's modulus of element j, and Ejmjk is an entry in the stiffness matrix. While the external forces at the boundary nodes of an anatomy are unknown, at equilibrium the forces at the internal nodes must be null if gravity is ignored. This fact is taken as a basic criterion to judge the quality of DVF derived from an image registration (Zhong et al 2007).
Quantified in a linear finite element framework, the registration errors can be specified as an unbalanced energy (UE), which is defined at tetrahedral element j by
| (4) |
where E0 is a given Young's modulus, and . From the definition above, δφ (j) is proportional to Young's modulus E0, in this work assumed to be 1 kPa (Sarvazyan et al 1998), constant in the problem domain. Because the representation of the dose-warping error given in section 4.1 depends on δφ (j), the exact value of E0 and its effect on the dose-warping error evaluation will be discussed further in section 5.
To quantify the explicit relation between the UE and the displacement error for a given registration, we need to create a simulation reference frame for their comparison.
3.2. Creation of reference frames
To build a standard displacement error (SDE) to be compared with UE, we first create three sets of simulation frames as references. Suppose that image 0 is a primary image, used for treatment planning, and image i (i = 1, 2, 3) is obtained from three subsequent treatment fractions. To avoid the loss of realism in creating the reference frames, the simulation is focused on the primary organ of interest for this test case, the prostate. The size of these CT images is reduced by cropping the region remote from prostate, leaving a remaining subvolume of 160 × 160 × 35 voxels. The new images cover the region of 15 cm × 15 cm × 10.5 cm around the prostate (see figure 1).
Figure 1.

(a) The primary image for treatment planning; (b) (c) (d) three images obtained in subsequent treatments.
After cropping, 24 points are identified on the planning image. They are selected from three slices showing the prostate at different levels in superior-inferior direction, each having eight points. Among the eight points, four are around prostate and four at bony structures. These points are tracked in subsequent treatment images to form a set of tractable control points for thin-plate spline registration (TPS). With the TPS registration algorithm implemented in VTK (www.vtk.org), we warp the planning image to the treatment image with the corresponding DVF generated. Consequently, the planning image and the warped image, combined with the TPS DVF, may serve as a reference frame to validate another registration algorithm, and the resultant DVF difference is then treated as an SDE. It should be mentioned that the UE is based on the physical property of the tissue deformation. If the SDE is biased, it is not suitable to be compared with the UE. This constraint presents a strong requirement on the fidelity of the simulated deformation for it to serve as a reference frame.
To meet this requirement, some featured points are selected as control points in the TPS interpolations. While the inaccuracy in tracking these control points could partly compromise the objectiveness of the simulation triplets, the TPS algorithm with 12 points around the 4 × 4×4 cm3 prostate region (and 12 located at bony structures) could warp the prostate well to its target, which was validated by tracking a prostatic calcification spot and boundary features of the prostate (Zhong et al 2007).
With the selected tracking pairs, we warp the planning image to each of the three treatment images. Figure 1(a) is the planning image which was warped to three subsequent treatment images (figures 1(b)–(d)). These TPS-warped images are shown in column 1 of figure 2. They serve as targets for Insight Toolkit (ITK) ‘demons’ registrations φi (Thirion), which are performed from the planning image (figure 1(a)) to each of these simulated targets STi in figure 2. In the ‘demons’ registration, the smoothness of the DVF is determined by its Gaussian kernel filter. The variation of its standard deviation may result in its DVFs having different qualities. To provide more testing cases, the standard deviation of its Gaussian kernel was set to σ = 1.0, 1.3, 2.0, respectively, for each registration φi, and their corresponding warped images are shown in columns 2, 3 and 4 of figure 2. Note that while all the images in figure 2 are rigidly aligned well, some distortions of soft tissue and bony structures can be observed, especially for the cases of φ1, σ = 1.0 and σ = 1.3. These distortions will be illustrated clearly by their SDEs as well as their automatically calculated UE images.
Figure 2.
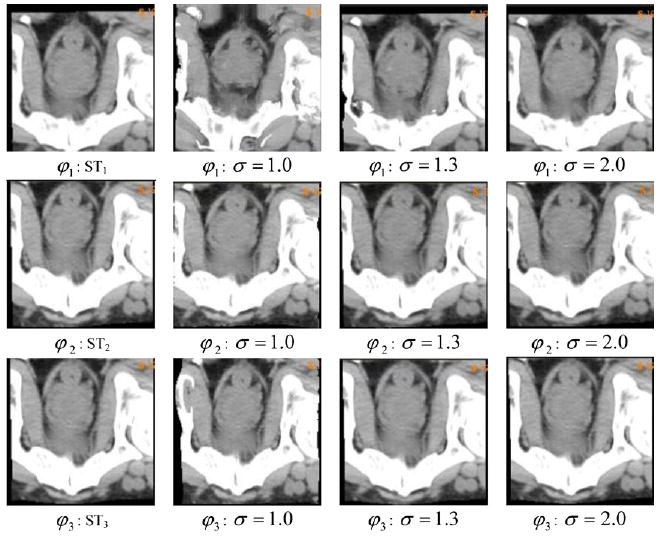
The first column comprises the three TPS-simulated target images (STi); column j (j = 2, 3, 4) comprises the images warped from image 0 to STi through ‘demons’ registration φi with Gaussian kernel σj, σj = 1.0, 1.3, 2.0, respectively.
Next the UE of the nine ‘demons’ registrations will be compared by their corresponding SDEs, calculated with respect to the simulated reference frames.
3.3. Evaluation of unbalanced energy
In the last section, four images were employed, one for planning and the others obtained from a patient's treatment course. The DVF from TPS interpolation then served as a reference frame to be compared with the DVF of the ‘demons’ registrations performed in the TPS-simulated framework. The SDE of the ‘demons’ algorithm at voxel i is then defined by
| (5) |
whose distribution over a 3D imaging domain is a standard error image (SEI).
From (5), the SDEs of nine ‘demons’ registrations in figure 2 can be calculated at each voxel. The resultant SEIs are illustrated in figures 3(a)–(c) for the case of the σ = 1.3 in the ‘demons’ algorithm. The UE images (UEI) of the ‘demons’ registrations are shown in figures 3(d)–(f). Recall that there are some distortions observed at the middle part of the image (figure 2, φ1: σ = 1.3). While it is hard to identify the distortions from the warped images, especially inside the prostate, these errors are clearly illustrated in both the SEIs (figure 3(a)) and the UEIs (figure 3(d)). The similarities between the SDE and the UE for the three registrations are demonstrated in figure 3, and the averaged ratio k between the two types of error representations in the region of the prostate is 0.63 over three registrations φi, i = 1, 2, 3, with σ = 1.3.
Figure 3.
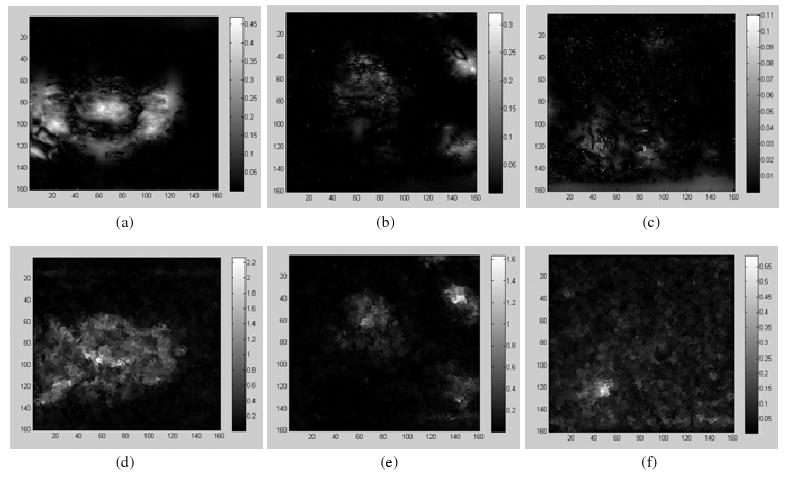
Top row: the SDE of the ‘demons’ registrations φ1, φ2, φ3 with Gaussian kernel (σ = 1.0); bottom row: the corresponding UE images.
For the three different qualities of ‘demons’ registrations, it can be observed that when σ = 1, their registration instances are poorly performed (figure 2, column 2), especially for φ1. This is reflected in their SDEs (figure 4(a)). Their calculated UEIs are shown in the bottom row of figure 4, and the averaged ratio k between SEIs and UEIs over the three registrations is 0.32 in the region of the prostate.
Figure 4.
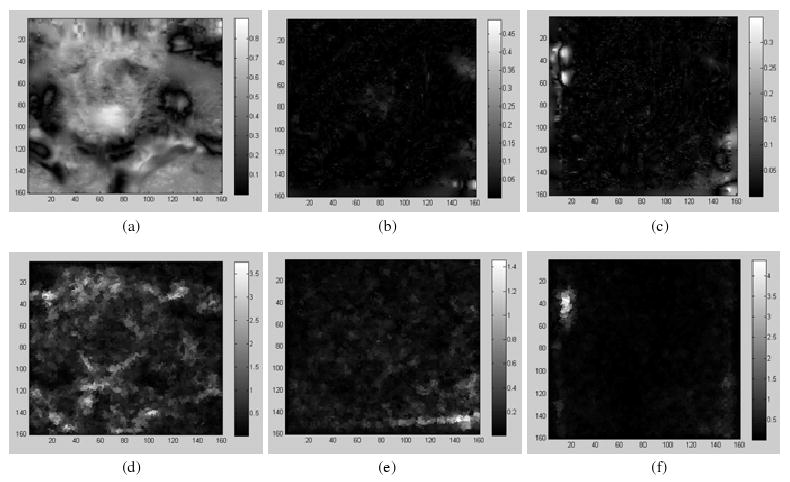
Top row: the SDE of the ‘demons’ registrations φ1, φ2, φ3 with Gaussian kernel (σ = 2.0); bottom row: the corresponding UE images.
For the three ‘demons’ registrations φi, i = 1, 2, 3, with σ = 2.0, their SDEs are shown in the top row of figure 5, and the UE is calculated with the UEI illustrated in the bottom row of figure 5. Their averaged ratio k between SEIs and UEIs is 0.76.
Figure 5.
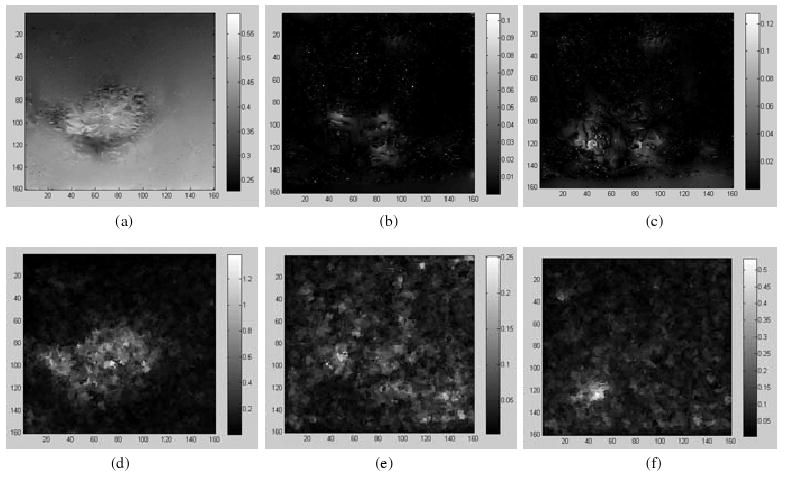
Top row: the SDE of the ‘demons’ registrations φ1, φ2, φ3 with Gaussian kernel (σ = 2.0); bottom row: the corresponding UE images.
In figures 3–5, some similarities between UEI and SEI can be observed. The TPS registration works well in the region surrogated by the 12 control points (Zhong et al 2007), contrasting to the entire imaging domain. Consequently, in the surrogated region, the SDEs of the ‘demons’ registrations with respect to TPS simulations can faithfully reflect the displacement discrepancy of the ‘demons’ DVF. Out of this region, the fidelity of the TPS displacement references with respect to the physical deformation could be reduced. This result will be supported in the next section by the study which shows that SEI and UEI have a different degree of similarity inside and outside the prostate.
3.4. Similarity between SEI and UEI
A comparison of figures 3-5 suggests that there is a similarity between SEI and UEI. In the UE calculation, when Young's modulus is set to 1 kPa, the mean value of UEIs could be three times higher than that of SEI. To quantify the similarity between the two types of error distributions, we use their Pearson correlation coefficient defined by
| (6) |
where X represents a standard error image and Y represents a UE image. X̄ and Ȳ are their means, and σX and σY are their standard deviations, respectively.
Recalling that in the TPS interpolations, the prostate is surrogated by 12 points, the TPS warping simulations are more objective or have higher fidelity in the region of the prostate than in any other place. This observation suggests that the similarity between SEI and UEI should be maximized in the region of prostate. To demonstrate this point, we generate a bitmap mask of the prostate derived from its contour in its treatment plan, and then calculate the correlation coefficients of SEI and UEI within the prostate as well as in the whole image domain. The calculated τ values for the three pairs of SEI and UEI are shown in table 1.
Table 1.
The means of SEI and UEI for different ‘demons’ registrations are calculated over the prostate as well as the whole image domain.
| φ1 | φ2 | φ3 | ||||
|---|---|---|---|---|---|---|
| τ (SEI, UEI) | Prostate | Image | Prostate | Image | Prostate | Image |
| σ = 1.0 | 0.882 | 0.212 | 0.718 | 0.481 | 0.638 | 0.490 |
| σ = 1.3 | 0.776 | 0.552 | 0.770 | 0.573 | 0.659 | 0.548 |
| σ = 2.0 | 0.729 | 0.422 | 0.525 | 0.235 | 0.512 | 0.354 |
The results in table 1 show a high similarity between the two kinds of error representations, especially inside the prostate. This parallel results from the high fidelity of the TPS warping at the prostate. From table 1, the registrations with σi = 1.3 in general have a high similarity between the UE and the SDE, whereas the least similarity over the entire imaging domain appears in the case of the registration φ1, σ = 1.0.
4. Evaluation of dose reconstruction error in clinical settings
The correlation coefficient values in table 1 illustrate a high similarity between registration displacement error and UE. Consequently, we can make a linear approximation to the relation between the two types of error representations. This approximation allows the size of the domain of integration Δ(q1) defined in section 2 to be quantified by δφ(p), theUE of φ at p.
4.1. Measurable dose reconstruction error in clinic
In clinical cases, image registration for IGRT is performed in 3D imaging domains. Suppose Δ(q1) is defined as a cube of the side length 2kδφ(p) with the center q1 = φ(p). The physical target q0 of p, represented as q0 = φ0(p), is then located within Δ(q1). From the simulation in the previous section, the coefficient k, estimated as the ratio between the mean of SEIs and the mean of UEIs, is about 0.32–0.76, while its exact value for clinical registrations may require further investigations.
Similar to (3), the discrepancy of the 3D dose reconstruction can be expressed as
| (7) |
where the line integral path l is an interval from q0 = φ0(p) to q1 = φ(p), which satisfies |l| = |kδφ(p)|. From the definition of Δ(q1), it can be seen that l ⊂ Δ(q1), though the exact direction of l is still unknown. To address this issue, (7) is converted to δD(φ)(p) = g(φ),l)(s0)|kδφ(p)| based on the integral mean value theorem, where g(φ,l)(s0) is the mean value of on l. An approximation of g(φ,l)(s0) is calculated as the average g̃(φ, Δ(q1)) of the means of over Δ(q1). Consequently, (7) is written as
| (8) |
For the implementation convenience, Δ(q1) is translated to a local domain Ω = [0, M, 0, M, 0, M] such that any point {x, y, z} in Δ(q1) is shifted to {x − x(q1) + M/2, y − y(q1) + M/2, z − z(q1) + M/2} where M is set to 48 mm. With the large value of M, Ω is able to cover the translated Δ(q1) for any given q1. The translated domain is employed for calculating the mean of all the dose gradients in Δ(q1) for each q1. Next, we will demonstrate that the definition of (8) is comparable to a contour-based dose error evaluation.
4.2. Contour-based evaluation of dose reconstruction error
For the validation of DIR, mathematical simulation is often employed as a reference frame. Its advantage is that when an image registration is performed on the pair of the referenced source and target images, its DVF can be compared with the referenced mapping voxel by voxel. The mathematical simulation could be derived from a finite element simulation or another registration result. However, these simulations are still limited in their fidelity to a physical deformation, which may prevent its service as an objective reference frame. For example, within the TPS-simulation frame described in section 3, the ‘demons’ registrations may have different realism when they are evaluated inside or outside the prostate. This possibility is consistent with the high similarity (correlation coefficient) between SEI and UEI when the region for their comparison is restricted within the prostate volume instead of the whole imaging domain.
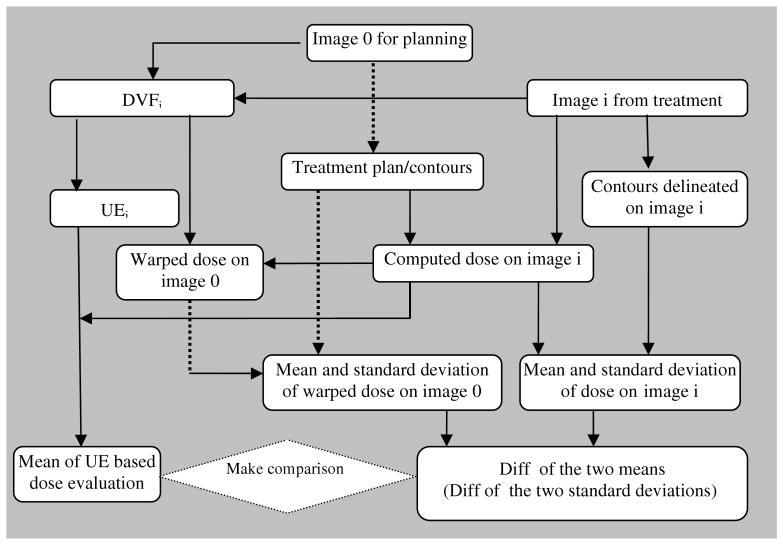
To avoid errors potentially introduced from any inaccurate simulation frame, we next employ a contour-based evaluation approach to demonstrate that the definition of (8) can characterize the dose accumulation error. Ten fractionated CT images are used in this study. The primary image is named as image 0, used for treatment planning. Images 1-9 are obtained in the subsequent treatments. The error in the accumulated dose resulting from the warping operation will be evaluated as follows (figure 6).
Figure 6.
A procedure to compare the UE-based dose accumulation error with contour-based evaluation.
An IMRT treatment plan is first developed on image 0 with contours delineated by an experienced physician. The dose grid size is 4 × 4 × 4 mm3, and the planning dose is calculated and denoted by D0. The primary CT image in the IMRT plan is then replaced by each of the nine treatment CT images, respectively, while the beam settings are unchanged. With an updated Image i, i = 1,…, 9, the dose distribution Di is calculated as the delivered dose for fraction i. On each of the nine treatment images, the physician delineates prostate contours and expands them 10 mm on each direction to form target contours, the same way as the planning target volume (PTV) was generated for treatment planning. These contours drawn on image i, i = 0, 1,…, 9, is named target contour i and denoted by Ci. Using these contours Ci, we can measure the mean ε(Di, Ci), and standard deviation σ(Di, Ci) of the delivered doses Di inside the contour Ci, i = 1,…, 9.
Next, we make DIRs from the planning image to the treatment image i (i = 1,…, 9), again using ITK ‘demons’ algorithm. The standard deviation of its Gaussian kernel is set to σ = 1.3. Using the DVFs generated from these registrations, we warp the dose distribution Di back to the planning image based on the procedure described in section 2. The reconstructed dose distributions are named as w(Di), and consequently the mean ε(w(Di), C0) and standard deviation σ(w(Di), C0) of the warped dose w(Di) located in the contour C0 can be calculated.
4.3. Results of contour-based evaluation
Figure 7(a) shows the DVHs of the doses delivered in the first three fractions and measured in Ci, i = 1, 2, 3. Since C1 is more closely aligned to C0 than C2 and C3, the DVHs in figure 7(a) show that fraction one has a better dose coverage over Ci than any other fraction. In figure 7(b), the delivered doses are warped back to the planning image and measured in C0. Note that the warping resultant dose is not expected to be equal to the planned dose. Instead, a high-fidelity warping should keep a similar DVH distribution between the delivered dose and the warped dose. In figures 7(a) and (b), it can be observed that the DVH of fraction one has a large variation before and after the dose warping, which means that the dose of fraction one is poorly warped.
Figure 7.
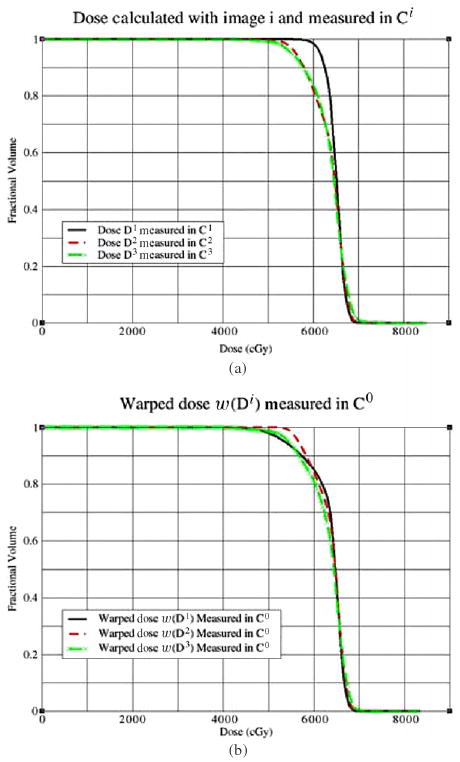
(a) Dose calculated with Image i, i = 1, 2, 3, is measured in its corresponding Ci; (b) dose calculated on image i is warped back to the planning image and measured in C0.
Although a treatment plan, such as the hypothetical plan used for this study, is usually delivered over 28 fractions, we only have nine acquired CT images in this study. For each image, the mean of the delivered doses measured in Ci and the mean of the warped doses measured in C0 are compared in figure 8(a). Their corresponding standard deviations are shown in figure 8(b). The largest discrepancy between the two criteria occurs at images 1 and 8. While the mean dose of image 3 has the largest deviation from the planned dose, its warping operation has a high fidelity.
Figure 8.
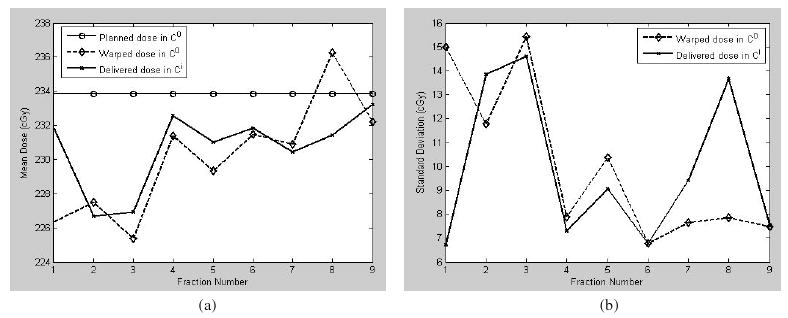
The doses (cGy) calculated from the nine treatment images are measured in Ci, and their warped doses are measured in C0. Their means are illustrated in (a), and their standard deviations are shown in (b).
The mean and standard deviation of the dose distributions from the above calculation have quantified the dose delivered to each given anatomic structure, especially the treatment volume. Their changes before and after warping should be limited to a small range for an ideal warping operation. Here, the dose delivered to each physical point is assumed to be invariant in the dose-warping operation. Consequently, the mean and standard deviation of the delivered dose in a physical domain should not change if the dose warping is committed to the physical deformation. Otherwise, their changes, defined as
| (9) |
respectively, could reflect the quality of the dose-warping performance. The explicit values of and over the nine warping operations are listed in table 2.
Table 2.
The dose reconstructions errors from ‘demons’ with σ = 1.3 are evaluated with different criteria.
| (cGy) | w1 | w2 | w3 | w4 | w5 | w6 | w7 | w8 | w9 | |
|---|---|---|---|---|---|---|---|---|---|---|
| δφi | 2.9 | 1.2 | 0.6 | 1.0 | 1.4 | 1.4 | 1.2 | 2.4 | 2.0 | |
| ε̃(Di,φi) | 6.4 | 3.9 | 2.0 | 2.8 | 4.1 | 3.6 | 2.8 | 5.3 | 4.5 | |
|
|
5.5 | 0.82 | 1.58 | 1.21 | 1.70 | 0.38 | 0.46 | 4.85 | 1.01 | |
|
|
8.29 | 2.07 | 0.82 | 0.57 | 1.31 | 0.01 | 1.74 | 5.82 | 0.03 |
4.4. UE-based evaluation of dose accumulation error
After the contour-based evaluation in table 2, we next turn to the UE to calculate the UE-based dose-warping errors. We create a mesh consisting of 132 K nodes and 780 K tetrahedrons, covering the whole image domain (46 × 46 × 27 cm3). The displacements of each node are obtained from the interpolation of its corresponding DVF. Because the mesh consists of a large number of elements, its global stiffness matrix may contain up to 396 K × 396 K entries. It is impossible to create such a large matrix to hold all the entries. Actually, for a 3D linear tetrahedral mesh, each row in its stiffness matrix contains only about 24 nonzero entries, where each node is assumed to have, at most, 24 adjacent nodes. This specification allows the sparse matrix to be written as a 50 MB array during the assembling process. With the code implemented in C++, the resultant program can be executed on a desktop computer.
For the nine ‘demons’ registrations φi which are from image 0 to image i, the UE δφi is calculated from its definition in equation (4). Figure 9(a) is image 1 and (b) is the output image from image 0 warped by φ1. The obvious distortions detected from the two images are in the rectum and at the anterior of the prostate. These distortions are clearly demonstrated as the registration error in the term of UE in figure 9(c).
Figure 9.

(a) Image 1 obtained from fraction one, (b) the output image of the registration φ1 from image 0 to image 1 and (c) the UE δφ1 of the registration φ1.
To get the UE-based dose error evaluation δD(φi)(p), the dose gradient ∇Di, i = 1,…, 9, is calculated and averaged over the registration error domain Δ(q1). The averaged value is multiplied by the corresponding kδφi (p) to get the dose-warping discrepancy δD(φi)(p) at the voxel p.
The voxel-based dose error estimate can be used for further dosimetry analysis. For example, the potential maximum dose at a point p can be calculated as D(φi)(p) + δD(φi)(p) and incorporated with contour-based dose evaluations. The potential minimum dose at p can be similarly evaluated. In figure 10(a), the PTV contour (thick) is illustrated on the planning image, and the thin curves are the 90% isodose warped from the delivered dose D(φi) at fraction 1. In figures 10(b) and (c), the warped-dose distribution is corrected by adding and subtracting the dose-warping discrepancy δD(φi)(p) at each point p, respectively, to estimate the potential maximum or minimum of the delivered dose. Consequently, the 90% isodose curves (thin) are enlarged (maximum dose) or shrunk (minimum dose), with the obvious differences illustrated by the PTV contour in figures 10(b) and (c).
Figure 10.

(a) PTV (thick) versus the 90% warped isodose (thin), PTV (thick) versus the 90% warped isodose (b) added or (c) subtracted by the UE-based dose-warping error (thin).
When the UE-based dose discrepancy δD(φi)(p) is calculated within the PTV contour C0, we get its mean dose error ε̃(Di, φi), which can be compared with and . Their consistency will be demonstrated through the nine warping operations.
4.5. Comparison between two types of evaluations
Before making numerical comparison between the two types of dose-warping evaluations presented, respectively, in sections 4.3 and 4.4, we first study their theoretical relationship. From its definition, we know that is the difference between the mean of the warped dose on the C0 and the mean of the delivered dose on Ci, i = 1,…, 9, i.e.,
where ‖ΔC0‖ represents the volume of the target contour C0 on the planning image, and ‖ΔCi‖ represents the region bounded by the contour Ci in the ith CT image. Suppose the true physical deformation map for the ith image is denoted by . If the target volume in C0 is preserved during the physical deformation and the manually drawn contours are accurate, then . From the notations used previously, suppose and , where the point p ∈ T, and φi represent the physical deformation and the DVF mapping of the ith image registration, respectively. Then, from the dose-warping approach specified in section 2, we have
| (10) |
When the unknown right-hand side of (10) is approximated by ε̃(Di,φi), an average of δD(φi)(p) over the volume of C0, it is expected that
| (11) |
This inequality provides an additional criterion to estimate the lower bound of k in equation (8) for clinical settings. In addition, the values on both sides of (11) should tend to zero if the DIR is accurate.
Table 2 lists theUE δφi, the UE-based dose error evaluation ε̃(Di,φi), and the contour-based discrepancy evaluations of means and standard deviations measured in C0 for the nine dose-warping operations. In this treatment plan, the prescribed dose is 234 cGy per fraction to 100% of the PTV volume. For the registrations between these clinical images, the parameter k in (8) is set to 0.54, which is at the middle of the range (0.32–0.76) derived from the TPS simulations in section 3.3. The average ratio of ε̃(Di,φi) to the prescribed dose on C0 over the nine fractions is 1.68% whereas the average ratio for is 0.9%. This result is consistent with the inequality of (11).
The results in table 2 are plotted as figure 11. It can be observed that the UE-based dose-warping discrepancy in general is consistent with the contour-based evaluations of mean and standard deviation (figure 11(a)). The largest warping discrepancies at fractions 1 and 8 can be identified from both the evaluation criteria.
Figure 11.
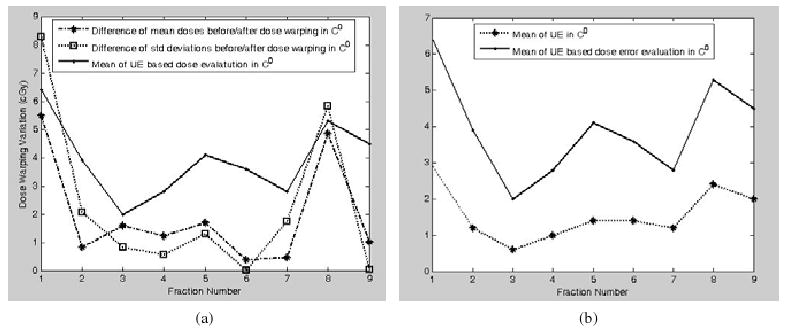
(a) Dose-warping errors of nine fractions are represented as the differences of mean doses, the differences of standard deviations before and after dose warping, and the means of UE-based evaluation (8) in target contour 0; (b) the relation between the UE and the UE-based dose evaluation in the target contour C0 is illustrated.
Considering that ε̃(Di,φi) and are two different error indicators, their difference is not expected to be constant for all the instances. They satisfy only the relation of , demonstrated in figure 11(a). The UE and its corresponding dose error evaluation are illustrated in figure 11(b). There is no surprise that the image registration error is exaggerated when it is combined with dose distributions.
5. Discussion
Dose reconstruction is used to add the delivered dose distributions according to the physical deformation of the tissue. Usually the physical deformation cannot be measured directly. Deformable image registration may provide an approximate solution, but the accuracy of the approximation at each point is still unknown. Because of the lack of a general method to measure the displacement error of the approximation, the concept of UE was proposed and developed in our previous work (Zhong et al 2007) to quantify the local inconsistency of the DVF mapping, which may directly contribute to the displacement error.
In this paper, we have exploited the quantitative relation between UE and SDE. The similarities of their 3D distributions characterized by Pearson correlation coefficient are calculated within simulated reference frames. Their high similarities suggest that SDE can be linearly approximated by UE with the linear coefficient k quantifiable with simulated reference frames. The exact value of k, which is dependent on the absolute value of UE, is proportional to Young's modulus of the underlying mechanical model. When Young's modulus is set to one, the range of k is between 0.32 and 0.76 in our simulated reference frames. While differences in the values of k exist, they are generally in the same range, and therefore the resultant UE-based dose error assessment is able to serve as a reference. However, for clinical applications, the exact value of k associated with a given Young's modulus may need further investigation.
When the discrepancy of a given DIR at a point p is approximated by its UE, the dose-warping error at p can be calculated as the product of the mean of the dose gradients over its local registration error domain and the UE-based estimate of the registration displacement error. Different from the contour-based evaluation of the dose-warping errors, which calculates the differences of means or standard deviations between the delivered dose and its warped dose at an anatomic level, the UE-based dose-warping evaluations can be performed at individual voxels. The two different error indicators derived from nine registration instances satisfy equation (11), as expected.
To calculate the UE-based dose-warping discrepancy, the mean of dose gradients over the integral path l is substituted by their mean in the voxel's registration error domain. This approximation therefore gives each voxel only an averaged dose-error estimate. In addition, the accuracy of the dose-warping evaluation may depend on the factors of the parameter k, Young's modulus and mesh grid resolution. In this paper, Young's modulus E0 of the underlying mechanical model is set to 1 kPa, a low bound for soft tissue used in the literature (Sarvazyan et al 1998, Greenleaf et al 2003). This value could be different from the accurate modulus of each organ in the images. However, if we use the same Young's modulus in the models for all of the registration instances, the resultant k values should be equivalent to each other because k is proportional to E0. Consequently, the linear coefficient k obtained from the registration between simulated reference frames (section 3) can be used as a reference in the calculation of dose-warping errors in clinical settings (section 4).
6. Conclusion
Dose reconstruction is fundamental to IGRT, and its quality depends on the underlying DIR. In this paper, the correlation between the registration displacement errors and their UE has been established and validated within TPS-simulated reference frames. Their similarity reaches 88%. While the similarity could vary among different registration instances, it provides a method to understand and estimate the registration error in general and could be used in various clinical applications. The advantage of the UE-based assessment is that it can be automatically performed at each voxel without the need for knowledge of the ground truth in tissue deformation.
With this relation, the dose reconstruction discrepancy induced from the deformable registration error can be defined and calculated at each voxel. Although this method requires further investigation, the initial results from the validation of nine clinical registration instances show that the UE-based assessments of the dose reconstruction discrepancies are generally consistent with the contour-based mean dose evaluations.
Acknowledgments
The authors thank Dr Jan-Jakob Sonke from the Netherlands Cancer Institute for kindly providing the CT datasets used in this study. They acknowledge financial support from NCI P01 CA 116602.
References
- Baldwin LN, Wachowicz K, Fallone BG. Towards MR-based treatment planning: characterisation of geometric distortion in 3 tmr images. Med Phys. 2005;32:2424. doi: 10.1118/1.2402331. [DOI] [PubMed] [Google Scholar]
- Bharatha A, et al. Evaluation of three-dimensional finite element-based deformable registration of pre- and intraoperative prostate imaging. Med Phys. 2001;28:2551–60. doi: 10.1118/1.1414009. [DOI] [PubMed] [Google Scholar]
- Booth JT, Zavgorodni SF. The effects of radiotherapy treatment uncertainties on the delivered dose distribution and tumor control probability. Australas Phys Eng Sci Med. 2001;24:71–8. doi: 10.1007/BF03178349. [DOI] [PubMed] [Google Scholar]
- Bortfeld T, Jiang SB, Rietzel E. Effects of motion on the total dose distribution. Semin Radiat Oncol. 2004;14:41–51. doi: 10.1053/j.semradonc.2003.10.011. [DOI] [PubMed] [Google Scholar]
- Brock KK, Sharpe MB, Dawson LA, Kim SM, Jaffray DA. Accuracy of finite element model-based multi-organ deformable image registration. Med Phys. 2005;32:1647–59. doi: 10.1118/1.1915012. [DOI] [PubMed] [Google Scholar]
- Chi Y, Liang L, Yan D. A material sensitivity study on the accuracy of deformable organ registration using linear biomechanical models. Med Phys. 2006;33:421–33. doi: 10.1118/1.2163838. [DOI] [PubMed] [Google Scholar]
- Christensen GE, et al. Image-based dose planning of intracavitary brachytherapy: registration of serial-imaging studies using deformable anatomic templates. Int J Radiat Oncol Biol Phys. 2001;51:227–42. doi: 10.1016/s0360-3016(01)01667-4. [DOI] [PubMed] [Google Scholar]
- Chung H, Jin H, Palta J, Suh T, Kim S. Dose variations with varying calculation grid size in head and neck IMRT. Phys Med Biol. 2006;51:4841–56. doi: 10.1088/0031-9155/51/19/008. [DOI] [PubMed] [Google Scholar]
- Hill DLG, Batchelor PG, Holder M, Hawkes DJ. Medical image registration. Phys Med Biol. 2001;46:R1–R45. doi: 10.1088/0031-9155/46/3/201. [DOI] [PubMed] [Google Scholar]
- Flampouri S, Jiang SB, Sharp GC, Wolfgang J, Patel AA, Choi NC. Estimation of the delivered patient dose in lung IMRT treatment based on deformable registration of 4D-CT data and Monte Carlo simulations. Phys Med Biol. 2005;51:2763–79. doi: 10.1088/0031-9155/51/11/006. [DOI] [PubMed] [Google Scholar]
- Foskey M, Davis B, Goyal L, Chang S, Chaney E, Strehl N, Tomei S, Rosenman J, Joshi S. Large deformation three-dimensional image registration in image-guided radiation therapy. Phys Med Biol. 2005;50:5869–92. doi: 10.1088/0031-9155/50/24/008. [DOI] [PubMed] [Google Scholar]
- Fox C, Aleman D, Romeijn H, Li J, Dempsey J. Gamma-ray intensity modulated radiation therapy. Int J Radiat Oncol Biol Phys. 2006;66:S673–S674. [Google Scholar]
- Gao S, Zhang L, Wang H, Crevoisier RD, Kuban DD, Mohan R, Dong L. A deformable image registration method to handle distended rectums in prostate cancer radiotherapy. Med Phys. 2006;33:3304–12. doi: 10.1118/1.2222077. [DOI] [PubMed] [Google Scholar]
- Gordon JJ, Siebers JV. Convolution method and CTV-to-PTV margins for finite fractions and small systematic errors. Phys Med Biol. 2007;52:1967–90. doi: 10.1088/0031-9155/52/7/013. [DOI] [PubMed] [Google Scholar]
- Greenleaf JF, Fatemi M, Insana M. Selected methods for imaging elastic properties of biological tissues. Annu Rev Biomed Eng. 2003;5:57–78. doi: 10.1146/annurev.bioeng.5.040202.121623. [DOI] [PubMed] [Google Scholar]
- Guerrero T, Zhang G, Segars W, Huang TC, Bilton S, Ibbott G, Dong L, Forster K, Lin KP. Elastic image mapping for 4-D dose estimation in thoracic radiotherapy. Radiat Prot Dosim. 2005;115:497–502. doi: 10.1093/rpd/nci225. [DOI] [PubMed] [Google Scholar]
- Jaffray DA, Siewerdsen JH, Wong JW, Martinez AA. Flat-panel cone-beam computed tomography for image-guided radiation therapy. Int J Radiat Oncol Biol Phys. 2002;53:1337–49. doi: 10.1016/s0360-3016(02)02884-5. [DOI] [PubMed] [Google Scholar]
- Keall PJ, Joshi S, Tracton G, Kini V, Vedam S, Mohan R. Four-dimensional radiotherapy planning. Int J Radiat Oncol Biol Phys. 2003;57:S233. [Google Scholar]
- Keall PJ, Siebers JV, Jeraj R, Mohan R. The effect of dose calculation uncertainty on the evaluation of radiotherapy plans. Med Phys. 2000;27:478–84. doi: 10.1118/1.598916. [DOI] [PubMed] [Google Scholar]
- Li T, Schreibmann E, Thorndyke B, Tillman G, Boyer A, Koong A, Goodman K, Xing L. Radiation dose reduction in four-dimensional computed tomography. Med Phys. 2005;32:3650–60. doi: 10.1118/1.2122567. [DOI] [PubMed] [Google Scholar]
- Lu W, Olivera GH, Chen Q, Ruchala KJ, Haimerl J, Meeks SL, Langen KM, Kupelian P. Deformable registration of the planning image (KVCT) and the daily images (MVCT) for adaptive radiation therapy. Phys Med Biol. 2006;51:4357–74. doi: 10.1088/0031-9155/51/17/015. [DOI] [PubMed] [Google Scholar]
- Ma CM, Paskalev K. In-room CT techniques for image-guided radiation therapy. Med Dosim. 2006;31:30–9. doi: 10.1016/j.meddos.2005.12.010. [DOI] [PubMed] [Google Scholar]
- Maleike D, Unkelbach J, Oelfke U. Simulation and visualization of dose uncertainties due to interfractional organ motion. Phys Med Biol. 2006;51:2237–52. doi: 10.1088/0031-9155/51/9/009. [DOI] [PubMed] [Google Scholar]
- Malsch U, Thieke C, Huber PE, Bendl R. An enhanced block matching algorithm for fast elastic registration in adaptive radiotherapy. Phys Med Biol. 2006;51:4789–806. doi: 10.1088/0031-9155/51/19/005. [DOI] [PubMed] [Google Scholar]
- Modersitzki J. Numerical Methods for Image Registration. New York: Oxford University Press; 2004. [Google Scholar]
- Oldham M, Létourneau D, Watt L, Hugo G, Yan D, Lockman D, Kim L, Chen P, Martinez A, Wong J. Cone-beam-CT guided radiation therapy: a model for on-line application. Radiother Oncol. 2005;75:271–8. doi: 10.1016/j.radonc.2005.03.026. [DOI] [PubMed] [Google Scholar]
- Rosu M, Chetty IJ, Balter JM, Kessler ML, McShan DL, Haken RKT. Dose reconstruction in deforming lung anatomy: dose grid size effects and clinical implications. Med Phys. 2005;32:2487–95. doi: 10.1118/1.1949749. [DOI] [PubMed] [Google Scholar]
- Sarvazyan T, Stolarsky V, Fishman V, Sarvazyan A. Development of mechanical models of breast and prostate with palpable nodules. EMBS Proc 20th Ann Int Conf IEEE. 1998;2:736–9. [Google Scholar]
- Schaly B, Kempe JA, Bauman GS, Battista JJ, Van Dyk J. Tracking the dose distribution in radiation therapy by accounting for variable anatomy. Phys Med Biol. 2004;49:791–805. doi: 10.1088/0031-9155/49/5/010. [DOI] [PubMed] [Google Scholar]
- Schnabel JA, Tanner C, Smith ADC, Leach MO, Hayes C, Degenhard A, Hose R, Hill DLG, Hawkes DJ. Validation of nonrigid image registration using finite-element methods: application to breast MR images. IEEE Trans Med Imaging. 2003;22:238–47. doi: 10.1109/TMI.2002.808367. [DOI] [PubMed] [Google Scholar]
- Siebers JV, Keall PJ, Wu Q, Williamson J, Schmidt-Ullrich RK. Effect of patient setup errors on simultaneously integrated boost head and neck IMRT treatment plans. Int J Radiat Oncol Biol Phys. 2005;63:422–33. doi: 10.1016/j.ijrobp.2005.02.029. [DOI] [PubMed] [Google Scholar]
- Sykes JR, Amer A, Czajka J, Moore CJ. A feasibility study for image guided radiotherapy using low dose, high speed, cone beam X-ray volumetric imaging. Radiother Oncol. 2005;77:45–52. doi: 10.1016/j.radonc.2005.05.005. [DOI] [PubMed] [Google Scholar]
- Thirion JP. Image matching as a diffusion process: an analogy with Maxwell's demons. Med Image Anal. 1998;2:243–60. doi: 10.1016/s1361-8415(98)80022-4. [DOI] [PubMed] [Google Scholar]
- Tomas K, David E, John LS, Jerry B. Magnetic resonance imaging for adaptive cobalt tomotherapy: a proposal. J Med Phys. 2006;31:242–54. doi: 10.4103/0971-6203.29194. [DOI] [PMC free article] [PubMed] [Google Scholar]
- Unkelbach J, Oelfke U. Inclusion of organ movements in IMRT treatment planning via inverse planning based on probability distributions. Phys Med Biol. 2004;49:4005–29. doi: 10.1088/0031-9155/49/17/013. [DOI] [PubMed] [Google Scholar]
- Wang H, Dong L, O'Daniel J, Mohan R, Garden AS, Ang KK, Kuban DA, Bonnen M, Chang JY, Cheung R. Validation of an accelerated ‘demons’ algorithm for deformable image registration in radiation therapy. Phys Med Biol. 2005;50:2887–905. doi: 10.1088/0031-9155/50/12/011. [DOI] [PubMed] [Google Scholar]
- Webb S. Does elastic tissue intrafraction motion with density changes forbid motion-compensated radiotherapy? Phys Med Biol. 2006;51:1449–62. doi: 10.1088/0031-9155/51/6/006. [DOI] [PubMed] [Google Scholar]
- Xiong L, Viswanathan A, Stewart AJ. Deformable structure registration of bladder through surface mapping. Med Phys. 2006;33:1848–56. doi: 10.1118/1.2198192. [DOI] [PubMed] [Google Scholar]
- Yan D, Jaffray DA, Wong J. A model to accumulate fractionated dose in a deforming organ. Int J Radiat Oncol Biol Phys. 1999;44:665–75. doi: 10.1016/s0360-3016(99)00007-3. [DOI] [PubMed] [Google Scholar]
- Yan D, Vicini F, Wong J, Martinez A. Adaptive radiation therapy. Phys Med Biol. 1997;42:123–32. doi: 10.1088/0031-9155/42/1/008. [DOI] [PubMed] [Google Scholar]
- Zhang X, Dong L, Lee A, Cox J, Kuban D, Zhu R, Wang X, Li Y, Newhauser W, Gillin M. Effect of anatomic motion on proton therapy dose distributions in prostate cancer treatment. Int J Radiat Oncol Biol Phys. 2007;67:620–9. doi: 10.1016/j.ijrobp.2006.10.008. [DOI] [PMC free article] [PubMed] [Google Scholar]
- Zhong H, Peters T, Siebers J. FEM based evaluation of deformable image registration in radiation therapy. Phys Med Biol. 2007;52:4721–38. doi: 10.1088/0031-9155/52/16/001. [DOI] [PubMed] [Google Scholar]


