

Abstract
Combination antiretroviral therapy (cART) limits human immunodeficiency virus (HIV) replication in the central nervous system (CNS) and prevents progressive neurological dysfunction. We examined if the degree of CNS penetration by cART, as estimated by the CNS penetration effectiveness (CPE) score, affects brain activity as measured by the amplitude of the blood oxygen level–dependent functional magnetic resonance imaging (BOLD fMRI) response. HIV+ patients on low-CPE cART (n = 12) had a significantly greater BOLD fMRI response amplitude than HIV+ patients on high-CPE cART (n = 12) or seronegative controls (n = 10). An increase in the BOLD fMRI response in HIV patients on low-CPE cART may reflect continued HIV replication in the CNS leading to increased oxidative stress and associated metabolic demands.
Keywords: combination antiretroviral therapy (cART), functional magnetic resonance imaging, HIV-associated neurocognitive disorders
Introduction
Human immunodeficiency virus (HIV)-1 quickly invades the central nervous system (CNS) after infection. HIV replication in the CNS is associated with neuronal damage (Chang et al, 2004a; Ernst et al, 2003; Sacktor et al, 2005) and alterations in brain metabolism (Roc et al, 2007). Morphological changes occur in both neurons—as seen by the loss of neuronal integrity (i.e., synaptic loss, dendritic pruning, apoptosis)—and in astrocytes via astrogliosis. Functional metabolic disturbances have been attributed to impaired glutamate regulation (Kaul et al, 2001).
The introduction of combination antiretroviral therapy (cART) has decreased the incidence but not prevalence of HIV-associated neurocognitive impairment (Tozzi et al, 2001), suggesting chronic progression in the CNS despite viral burden reductions (Ellis et al, 2007). This development may reflect poor penetration of antiretroviral (ARV) medications across the blood-brain barrier, resulting in inadequate virological control (Ances and Ellis, 2007). Recently, a practical method has been devised to quantifiably assess the CNS penetration effectiveness (CPE) of various ARV medications (Letendre et al, 2008). A cART regimen is designated as either having a low or high CPE score by algorithmically combining individual drug rankings according to their pharmacokinetic characteristics, cerebral spinal fluid (CSF) concentrations, and effectiveness in suppressing CNS viral replication.
The utility of CPE classification scheme has previously been validated by measuring both CSF viral load and neuropsychological performance (NP) testing (Letendre et al, 2008). Other complementary measures are needed, as both lumbar punctures and NP testing can be time-consuming and invasive. Blood oxygen level–dependent functional magnetic resonance imaging (BOLD fMRI) provides a noninvasive method to assess HIV within the CNS (Castelo et al, 2006; Chang et al, 2001, 2004b). The amplitude of the BOLD fMRI response can be a useful indicator of regional changes in cerebral blood flow and metabolism (Buxton, 2002). Previous BOLD fMRI studies of HIV+ patients have shown functional recruitment of additional brain regions for simple cognitive tasks (Castelo et al, 2006; Chang et al, 2001, 2004b). To determine whether BOLD fMRI can reliably predict the efficacy of cART on HIV in the CNS, we studied the amplitude of the BOLD fMRI response in HIV+ patients on either low- or high-CPE cART.
Results
Twenty-four HIV+ patients were classified with either a low (n = 12) or high (n = 12) CPE score. There were no significant differences amongst the two HIV+ subgroups and seronegative controls (SNCs) in regards to age, gender, and years of formal education (Table 1). Between the two HIV+ subgroups, laboratory values such as CD4 + cell counts, log plasma viral load, and hematocrit were also similar, and an equal number of patients within each group had virological suppression within the plasma (Table 1). None of the HIV+ patients were naïve to cART. Both CPE groups had a similar average overall duration of therapy that consisted of at least two ARV agents (Table 1).
Table 1.
Demographics, laboratory values, medications, and performance measuresComp: Bottom align THs. Top align TB entries across row. No internal rules. TB col 1: Indent overruns. Stet sublevel entry indents. TB col 5: Delete all p = and zero before decimal (see row 1) pls.
| SNC (n = 10) | Low CPE cART (n = 12) | High CPE Cart (n = 12) | P value | |
|---|---|---|---|---|
| Demographics | ||||
| Age (years old) | 46±4 | 44±2 | 47±2 | p=0.24 |
| Education (Years) | 14±1 | 14±1 | 15±1 | p=0.78 |
| Males (%) | 60 | 67 | 75 | p=0.42 |
| Caucasian (%) | 40 | 33 | 42 | p=0.56 |
| Laboratory values | ||||
| Median CD4 (cells/μl) | NA | 386±77 | 350±31 | p=0.11 |
| Median log plasma viral load (IQRs) | NA | 2.88 (1.70–3.65) | 2.33 (2.15–2.67) | p=0.13 |
| % Virological suppression | NA | 25% | 25% | p=0.92 |
| Hematocrit (%) | NA | 40±1 | 40±1 | p=0.98 |
| Hematocrit (%) | NA | 40±1 | 40±1 | p=0.97 |
| Medications | ||||
| Composition: | NA | |||
| % PI | 50 | 42 | p=0.53 | |
| % NRTI | 66 | 83 | p=0.21 | |
| % NNRTI | 33 | 42 | p=0.47 | |
| Duration of therapy (months) | NA | 18±3 | 22±4 | p=0.10 |
| Performance measures | ||||
| Global deficit score | 0.3±0.1 | 1.0±0.3 | 0.9±0.3 | *p=0.02 |
| Composition: | NA | |||
| % NN | 33 | 42 | p=0.59 | |
| % MND | 33 | 25 | p=0.42 | |
| % HAD | 33 | 33 | p=0.88 | |
| Mean squeeze pressure (lbs/in2) | 0.85±0.06 | 0.91±0.03 | 0.89±0.03 | p=0.67 |
Note. cART, combination antiretroviral therapy; CNS, central nervous system; CPE, CNS penetration effectiveness; HAD, HIV-associated dementia; IQR, interquartile values; NA, not available; NN, neuropsychologically normal; NNRTI, non-nucleoside reverse transcriptase inhibitor; NRTI, nucleoside reverse transcriptase inhibitor; MND, mild neurocognitive disease; PI, protease inhibitor; SNC, seronegative controls. Mean±standard error.
A significant difference in GDS was seen for SNCs compared to low- or high-CPE cART groups.
The degree of HIV-associated neurocognitive disorder in both CPE groups was similar and reflected the diverse spectrum of the disease. However, a significant difference in the global deficit scale (GDS) scores was seen between SNC and each of the HIV subgroups. Those patients on low-CPE cARTs consisted of four neuropsychologically normal (NN), four mild neurocognitve disorder (MND), and four HIV-associated dementia (HAD) patients, whereas those patients on high-CPE cARTs consisted of five NN, three MND, and four HAD patients. The bilateral mean squeeze pressure (lbs/in2) was also similar between the two CPE groups (one-way analysis of variance [ANOVA], P = .23) (Table 1).
The overall shape and temporal dynamics of the BOLD fMRI responses were similar among all groups (data not shown). However, the amplitude of the BOLD fMRI response was significantly greater in the low-CPE group in comparison with the high-CPE group and SNCs (Figure 1; one-eay ANOVA with Sidak correction for multiple correction, F(2, 31) = 4.4, P<.03). This difference was observed even after correcting for possible differences in task performance as reflected by bilateral squeeze pressure (analysis of covariance [ANCOVA], F(2, 30) = 4.8, P<.03). However, when all HIV+ patients were combined, there was no significant difference in the amplitude of the hemodynamic response function (HRF) in comparison to SNCs (P = .56).
Figure 1.
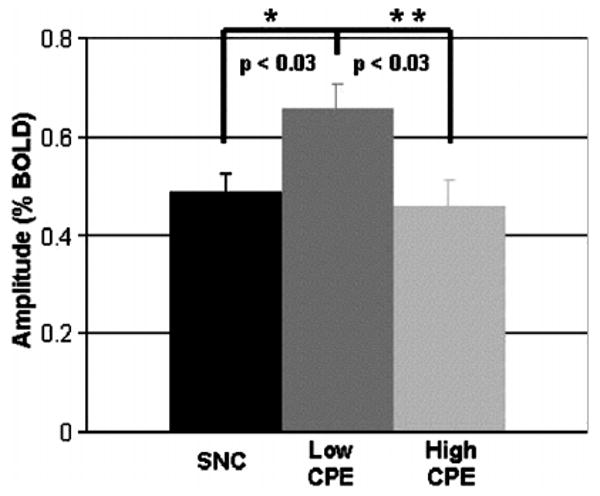
The amplitude of the blood oxygen level dependent functional magnetic resonance imaging (BOLD fMRI) response for seronegative controls (SNCs) and HIV+ patients on either low or high central nervous system penetration effectiveness (CPE) combination antiretroviral therapy (cART). * =a significant difference was observed between HIV+ patients on low CPE cART and SNCs (P<0.03), ** =a significant difference was observed between HIV+ on low and high CPE cART (p<0.03). Error bars signify the standard error from the mean.
Discussion
In this cross-sectional observational study, poor ARV penetration, as estimated by low CPE scores, was associated with a significant increase in the amplitude of the BOLD fMRI response. This relationship was independent of current CD4 count, systemic potency, and duration of the regimen (as estimated by plasma viral loads).
Although no significant changes in motor task performance were observed among the low- and high-CPE groups and SNCs, a significant correlation was found between motor squeeze pressure and the degree of HIV-associated neurocognitive disorder. Specifically, HAD patients in both CPE groups demonstrated a significant reduction in squeeze ball pressures in comparison with SNCs (data not shown). This motor dysfunction within our HAD patients is consistent with previous studies that demonstrated psychomotor slowing as a characteristic feature of advanced neurocognitive disorders (Juengst et al, 2007; Sacktor et al, 1996). The overall lack of task performance differences between CPE groups likely reflects the relatively equal distribution of various degrees of HIV-associated neurocognitive disorder.
Observed differences in the BOLD fMRI responses due to high or low CPE could reflect one or more direct or indirect effects of cART within the brain including: (a) alterations in metabolic demand associated with suppression of HIV replication (Rottenberg et al, 1996); (b) toxic effects of cART on cellular integrity (Schweinsburg et al, 2005); and (c) direct vascular effects of cART on cerebral blood flow (Grubb et al, 2006; Solages et al, 2006; Stein et al, 2001). When a task is performed, increased neural activity is associated with metabolic demands that are coupled with a compensatory delivery and consumption of glucose and oxygen. The BOLD fMRI signal reflects this complex combination of changes in cerebral blood flow, cerebral metabolic rate of oxygen consumption, and cerebral blood volume (Buxton, 2002). HIV replication within the CNS occurs primarily in parenchymal microglia and perivascular macrophages (Kaul et al, 2001). Such replication is associated with immune activation of both infected and noninfected cells, resulting in the release of cellular factors including cytokines, chemokines, reactive oxygen species, and excitotoxins. These molecules can stimulate an excessive release of glutamate from neurons as well as reduce its reuptake by astrocytes. Excessive glutamatergic neurotransmission could stimulate signaling pathways and augment cerebral blood flow to meet regional metabolic demands (Rottenberg et al, 1996).
HIV replication in the brain may continue in reservoirs within perivascular macrophages and resident parenchymal microglia despite the introduction of cART. Low levels of viral replication may persist in parenchymal microglia due to the relatively slow turnover of these cells compared with perivascular macrophages (Wiley et al, 1986). In addition, cART may differentially affect viral levels within various reservoirs. Recently, Letendre and colleagues demonstrated that HIV+ patients on low-CPE cART had nearly double the odds (dds ration [OR] 1.88) of having detectable CSF HIV RNA viral loads compared to patients on high-CPE cARTs despite comparable plasma viral loads between groups. Thus, high-CPE cARTs may have increased specificity for semiprotected HIV reservoirs in the CNS, resulting in decreased metabolic demands and a greater normalization of the BOLD fMRI response (Letendre et al, 2008).
It is less likely that high-CPE cARTs could reduce the amplitude of the HRF due to direct cellular toxicity on target cells. A previous magnetic resonance spectroscopy (MRS) study has shown that nucleoside reverse transcriptase inhibitors (NRTIs) can induce mitochondrial dysregulation and impair cellular respiration (Schweinsburg et al, 2005). N-acetylaspartate (NAA), a neuronal marker sensitive to alterations in mitochondrial integrity, was diminished in the frontal white matter of HIV+ patients taking NRTIs compared to SNCs. Although MRS was not used in this BOLD fMRI study, similar proportions of patients in both low-CPE and high-CPE cART groups were on NRTIs (Table 1). This small observational study does not have enough power to determine the extent to which NRTIs can affect the BOLD HRF. However, compared to SNCs. the high-CPE subject group had similar amplitude of the BOLD signal (P = .65) and squeeze ball pressure (P = .67).
More recently, a few studies have demonstrated that protease inhibitors (PIs) may cause endothelial dysfunction (Grubb et al, 2006; Solages et al, 2006; Stein et al, 2001). These studies have concentrated on the vasculature outside of the cranium and have typically investigated arteries with diameters much greater than those typically studied by BOLD fMRI. In an attempt to elucidate possible contributing effects from PIs, we classified our HIV+ patients according to this medication subtype. No significant differences in the BOLD HRF were observed between HIV+ patients on PI therapy compared to those on non-PI therapy (data not shown). Larger longitudinal BOLD fMRI studies of HIV+ patients both prior to and after starting cART are required.
Although we cannot state with certainty the mechanism(s) of action of cART on the BOLD fMRI response, we favor the hypothesis that more efficient suppression of CNS HIV replication by high-CPE cART most likely reduces the metabolic demand in brain microenvironments where HIV is replicating, thereby leading to a greater normalization of the BOLD fMRI response. An inherent limitation of the present study is a direct confirmation of HIV viral levels in the cerebral spinal fluid of HIV+ patients and its application to CPE scores, which are based on limited available information about ARV penetration into the CNS. In lieu of directly measuring ARV drug concentrations and virological suppression in brain tissue, we used the amplitude of the BOLD fMRI as a surrogate marker to assess the efficacy of cART in the CNS. Larger prospective studies that correlate the amplitude of the BOLD HRF with CSF HIV RNA viral loads, neuroimmune markers, and specific neurological performance measures are necessary to define the potential predictive value of the BOLD fMRI response for neurological outcomes in HIV+ individuals on cART (Castelo et al, 2006; Juengst et al, 2007).
In summary, we observed a significant increase in the amplitude of the BOLD HRF within the motor hand area (MHA) of HIV+ patients on low-CPE cART in comparison with those on high-CPE cART or SNCs. This difference remained even after correcting for performance effects or for possible effects due to an ARV class. An increase in the amplitude of the BOLD fMRI response in patients on low-CPE regimens may reflect continued low levels of HIV replication within the CNS causing increased metabolic demands. These results suggest the complementary addition of BOLD fMRI to the existing armamentarium to evaluate the efficacy of cART regimens in HIV+ patients.
Materials and methods
Subjects
Twenty-four HIV+ patients and 10 seronegative controls (SNCs) from the community were evaluated by neuropsychological testing and neurological examination (Sacktor et al, 1996). Serological status of all HIV+ patients was confirmed by Western blot and/or plasma HIV detection. Laboratory screening evaluations were performed within 6 weeks of fMRI scanning and included basic metabolic panel, complete blood count, thyroid panel, rapid plasma reagin, CD4+ lymphocyte count, and HIV RNA level or viral load in plasma (Roche Amplicor v.1.5; lower limit of quantification 50 copies/ml).
Patients were recruited using the following inclusion criteria: history of HIV infection for greater than 1 year; history of CD4+ count <500 cells/μl; negative urine toxicology screen to cocaine, amphetamines, marijuana, benzodiazepines, barbiturates, and opiates; no other chronic medical or psychiatric illnesses; MRI without major structural abnormalities (e.g., cortical infarcts, arteriovenous malformations, tumors); absence of head trauma with loss of consciousness for more than 30 min; and lack of seizure disorder, hypertension, diabetes, and active neurosyphilis. HIV+ patients spanned a range of HIV-associated neurocognitive impairment, with all on either low- or high-CPE regimens that had been selected by their health care providers. All HIV + patients had been on a cART for at least 3 months prior to neuroimaging to ensure adequate virological suppression (Langford et al, 2006). Healthy SNCs matched by age and education and who were not on medications and had no history of substance abuse were also recruited. Prior to enrollment, all participants were verbally informed of the study protocol and provided informed and written consent. The Human Subjects Institutional Review Board at the Hospital of the University of Pennsylvania approved this protocol.
Neuropsychological testing
Enrolled individuals were assessed by published neurobehavioral methods (Marder et al, 2003). Raw scores from standardized NP testing of verbal memory and recall, psychomotor skills, motor skills and praxis, and executive functioning were converted into T-scores by applying demographic corrections for age, gender, and education. A global deficit scale (GDS) rating, which provides a summary index of cognitive dysfunction by combining multiple neuropsychological tests (Carey et al, 2004), was calculated for each participant. In addition, a detailed standardized neurological examination of cranial nerve function, motor strength and coordination, reflexes, gait and sensation, as well as an interrogative assessment of mood, bowel/bladder dysfunction, and difficulties with activities of daily living was performed. Subjects were classified by neurological examination, ability to perform everyday activities, and GDS rating as either neuropsychologically normal (NN) (GDS < 0.5), mild neurocognitve disorder (MND) (0.5 ≤ GDS < 1), or HIV-associated dementia (HAD) (GDS ≥ 1) (Antinori et al, 2007).
CPE score determination
For the HIV+ patients, cART CPE scores were characterized using a hierarchical approach. Each antiretroviral agent was assigned a CPE score of 0 (low CNS penetration), 0.5 (intermediate CNS penetration), or 1 (high CNS penetration). A composite CPE score for a cART regimen was determined by summing individual CPE scores for each antiretroviral agent. A cART regimen was further dichotomized as being either a low or high CPE score using the median (1.5) as a cut-off (Letendre et al, 2008).
Stimulus presentation
The stimulus paradigm followed an event-related BOLD fMRI design of 24 stimulus presentation trials; a trial consisted of a black-and-white checkerboard that flickered at 10 Hz, followed by 17 s of a black field (rest condition). Study participants were instructed to quickly squeeze a rubber ball within each hand when the flickering stimulus appeared. The squeeze-ball apparatus was locally constructed and consisted of two rubber balls connected by semirigid plastic tubing to a battery-driven pressure-transducer (Honeywell 185PC15DT). Behavioral data was sampled every 20 ms. Voltages from the pressure-transducer were digitized using an A-D card (National Instruments, Austin, TX). Squeeze pressure was calculated as the integrated voltage per trial. Voltage was proportional to the ball pressure except for negligible losses through the connective tubing. In an attempt to eliminate motion artifacts associated with squeezing, all participants were trained prior to scanning and foam padding was placed around the head to reduce possible head movements.
BOLD fMRI protocol
A 3.0-T Trio Siemens whole body scanner (Erlangen, Germany) was used to acquire three-dimensional (3D) axial T1-weighted anatomical images (TR/TE/TI = 1620/3.9/950 ms, 192 × 256 matrix size, 160 slices, 1 mm slice thickness, 5 min in duration) and echo-planar images (EPIs; single-shot T2*-weighted, TR/TE = 2000/50 ms, flip angle of 90°, 24 mm field of view, 5 mm slice thickness, 64 × 64 matrix size, with a resolution of 3.75 × 3.75 mm2). A total of 21 axial slices were acquired during each repetition.
Data analysis
For each participant, a region of interest (ROI) analysis was performed on the motor hand area (MHA) of the parietal cortex. This ROI was chosen as both morphometric and BOLD fMRI studies have shown cortical involvement by HIV (Juengst et al, 2007; Thompson et al, 2005). The MHA is a broad precentral structure with an inverted omega shape that lies posterior to the junction of the superior frontal sulcus with the precentral sulcus and extends posterior and laterally to the central sulcus (Yousry et al, 1997). It was manually segmented on T1-weighted images using anatomical landmarks and guided by a MRI atlas. Anatomical scans were reviewed by a trained neuroradiologist (R.W.) blinded to the diagnosis of the participant in order to confirm that no structural abnormalities were visualized within the MHA.
Preprocessing and statistical analysis of BOLD signal were performed using VoxBo (http://www.voxbo.org). Physiological measurements such as cardiac rate were not obtained for these experiments (Shmueli et al, 2007). A modified general linear model (Friston et al, 1995) that included head movement correction was used after which the time course of the hemodynamic response function (HRF) was extracted from the ROI of each participant. The time course within the ROI was expressed as a percentage of the BOLD signal change from the rest condition. The mean event-related BOLD fMRI response within the MHA reflected the average across all voxels within the ROI and stimulus presentation trials.
Statistical analysis
The amplitude of the BOLD fMRI response for each participant was determined by averaging over the second prior to and after the maximal mean of the response. A one-way analysis of variance (ANOVA) of group (SNC, low CPE, and high CPE) on the amplitude of BOLD fMRI response was performed. This was followed by a post hoc set of three pairwise t test comparisons using a Sidak correction (P < .03). In an attempt to control for task performance effects, the mean squeeze pressure was added as a covariate in a one-way analysis of covariance (ANCOVA) of group (SNC, low CPE, and high CPE) on the amplitude of BOLD fMRI response followed by post hoc pairwise t test comparisons using a Sidak correction (P < .03).
Acknowledgments
This work was supported by the Center for AIDS Research (AI045008) (A.C.R., D.L.K., B.M.A.), the Center for Functional Neuroimaging (NS045839) (A.C.R., M.K.) at the University of Pennsylvania, the University of Pennsylvania AIDS Clinical Trials Unit (NIH AI 32783) (A.C.R., D.L.K., B.M.A.), a Universitywide AIDS Research Program Grant (CF05-SD-301) (B.M.A.), an American Foundation of AIDS Research (amFAR) (106729-40-RFRL) (B.M.A.), Dana Foundation for Brain and Immuno-Imaging (B.M.A.), and NIH grant (1K23MH081786) (B.M.A.). The authors would like to thank Drs. Ronald Ellis, Scott Letendre, and Richard Buxton for their helpful comments and insights.
Footnotes
Declaration of interest: The authors report no conflicts of interest. The authors alone are responsible for the content and writing of the paper.
References
- Ances BM, Ellis RJ. Dementia and neurocognitive disorders due to HIV-1 infection. Semin Neurol. 2007;27:86–92. doi: 10.1055/s-2006-956759. [DOI] [PubMed] [Google Scholar]
- Antinori A, Arendt G, Becker JT, Brew BJ, Byrd DA, Cherner M, Clifford DB, Cinque P, Epstein LG, Goodkin K, Gisslen M, Grant I, Heaton RK, Joseph J, Marder K, Marra CM, McArthur JC, Nunn M, Price RW, Pulliam L, Robertson KR, Sacktor N, Valcour V, Wojna VE. Updated research on nosology for HIV-associated neurocognitive disorders. Neurology. 2007;69:1789–1799. doi: 10.1212/01.WNL.0000287431.88658.8b. [DOI] [PMC free article] [PubMed] [Google Scholar]
- Buxton RB. Introduction to functional magnetic resonance imaging: principles and techniques. Cambridge, UK: Cambridge University Press; 2002. [Google Scholar]
- Carey CL, Woods SP, Gonzalez R, Conover E, Marcotte TD, Grant I, Heaton RK. Predictive validity of global deficit scores in detecting neuropsychological impairment in HIV infection. J Clin Exp Neuropsychol. 2004;26:307–319. doi: 10.1080/13803390490510031. [DOI] [PubMed] [Google Scholar]
- Castelo JM, Sherman SJ, Courtney MG, Melrose RJ, Stern CE. Altered hippocampal-prefrontal activation in HIV patients during episodic memory encoding. Neurology. 2006;66:1688–1695. doi: 10.1212/01.wnl.0000218305.09183.70. [DOI] [PubMed] [Google Scholar]
- Chang L, Lee PL, Yiannoutsos CT, Ernst T, Marra CM, Richards T, Kolson D, Schifitto G, Jarvik JG, Miller EN, Lenkinski R, Gonzalez G, Navia BA. A multicenter in vivo proton-MRS study of HIV-associated dementia and its relationship to age. Neuroimage. 2004a;23:1336–1347. doi: 10.1016/j.neuroimage.2004.07.067. [DOI] [PubMed] [Google Scholar]
- Chang L, Speck O, Miller EN, Braun J, Jovicich J, Koch C, Itti L, Ernst T. Neural correlates of attention and working memory deficits in HIV patients. Neurology. 2001;57:1001–1007. doi: 10.1212/wnl.57.6.1001. [DOI] [PubMed] [Google Scholar]
- Chang L, Tomasi D, Yakupov R, Lozar C, Arnold S, Caparelli E, Ernst T. Adaptation of the attention network in human immunodeficiency virus brain injury. Ann Neurol. 2004b;56:259–272. doi: 10.1002/ana.20190. [DOI] [PubMed] [Google Scholar]
- Ellis R, Langford D, Masliah E. HIV and antiretroviral therapy in the brain: neuronal injury and repair. Nat Rev Neurosci. 2007;8:33–44. doi: 10.1038/nrn2040. [DOI] [PubMed] [Google Scholar]
- Ernst T, Chang L, Arnold S. Increased glial metabolites predict increased working memory network activation in HIV brain injury. Neuroimage. 2003;19:1686–1693. doi: 10.1016/s1053-8119(03)00232-5. [DOI] [PubMed] [Google Scholar]
- Friston KJ, Holmes AP, Poline JB, Grasby PJ, Williams SC, Frackowiak RS, Turner R. Analysis of fMRI time-series revisited. Neuroimage. 1995;2:45–53. doi: 10.1006/nimg.1995.1007. [DOI] [PubMed] [Google Scholar]
- Grubb JR, Dejam A, Voell J, Blackwelder WC, Sklar PA, Kovacs JA, Cannon RO, Masur H, Gladwin MT. Lopinavir-ritonavir: effects on endothelial cell function in healthy subjects. J Infect Dis. 2006;193:1516–1519. doi: 10.1086/503807. [DOI] [PubMed] [Google Scholar]
- Juengst SB, Aizenstein HJ, Figurski J, Lopez OL, Becker JT. Alterations in the hemodynamic response function in cognitively impaired HIV/AIDS subjects. J Neurosci Methods. 2007;163:208–212. doi: 10.1016/j.jneumeth.2007.03.004. [DOI] [PubMed] [Google Scholar]
- Kaul M, Garden GA, Lipton SA. Pathways to neuronal injury and apoptosis in HIV-associated dementia. Nature. 2001;410:988–994. doi: 10.1038/35073667. [DOI] [PubMed] [Google Scholar]
- Langford D, Marquie-Beck J, de Almeida S, Lazzaretto D, Letendre S, Grant I, McCutchan JA, Masliah E, Ellis RJ. Relationship of antiretroviral treatment to postmortem brain tissue viral load in human immunodeficiency virus-infected patients. J NeuroVirol. 2006;12:100–107. doi: 10.1080/13550280600713932. [DOI] [PubMed] [Google Scholar]
- Letendre S, Marquie-Beck J, Capparelli E, Best B, Clifford D, Collier A, Gelman B, McArthur J, McCutchan J, Morgello S, Simpson D, Grant I, Ellis R, CHARTER group Validation of the CNS penetration-effectiveness rank for quantifying antiretroviral penetration into the central nervous system. Arch Neurol. 2008;65:65–70. doi: 10.1001/archneurol.2007.31. [DOI] [PMC free article] [PubMed] [Google Scholar]
- Marder K, Albert SM, McDermott MP, McArthur JC, Schifitto G, Selnes OA, Sacktor N, Stern Y, Palumbo D, Kieburtz K, Cohen B, Orme C, Epstein LG. Inter-rater reliability of a clinical staging of HIV-associated cognitive impairment. Neurology. 2003;60:1467–1473. doi: 10.1212/01.wnl.0000064172.46685.82. [DOI] [PubMed] [Google Scholar]
- Roc A, Ances B, Chawla S, Korczykowski M, Wolf R, Kolson D, Detre J, Poptani H. MRS detects HIV-induced inflammation and oxidative stress in lenticular nuclei despite antiretroviral therapy. Arch Neurol. 2007;64:1249–1257. doi: 10.1001/archneur.64.9.noc60125. [DOI] [PubMed] [Google Scholar]
- Rottenberg DA, Sidtis JJ, Strother SC, Schaper KA, Anderson JR, Nelson MJ, Price RW. Abnormal cerebral glucose metabolism in HIV-1 seropositive subjects with and without dementia. J Nucl Med. 1996;37:1133–1141. [PubMed] [Google Scholar]
- Sacktor N, Skolasky RL, Ernst T, Mao X, Selnes O, Pomper MG, Chang L, Zhong K, Shungu DC, Marder K, Shibata D, Schifitto G, Bobo L, Barker PB. A multicenter study of two magnetic resonance spectroscopy techniques in individuals with HIV dementia. J Magn Reson Imaging. 2005;21:325–333. doi: 10.1002/jmri.20272. [DOI] [PubMed] [Google Scholar]
- Sacktor NC, Bacellar H, Hoover DR, Nance-Sproson TE, Selnes OA, Miller EN, Dal Pan GJ, Kleeberger C, Brown A, Saah A, McArthur JC. Psychomotor slowing in HIV infection: a predictor of dementia, AIDS and death. J NeuroVirol. 1996;2:404–410. doi: 10.3109/13550289609146906. [DOI] [PubMed] [Google Scholar]
- Schweinsburg BC, Taylor MJ, Alhassoon OM, Gonzalez R, Brown GG, Ellis RJ, Letendre S, Videen JS, McCutchan JA, Patterson TL, Grant I. Brain mitochondrial injury in human immunodeficiency virus-seropositive (HIV +) individuals taking nucleoside reverse transcriptase inhibitors. J NeuroVirol. 2005;11:356–364. doi: 10.1080/13550280591002342. [DOI] [PubMed] [Google Scholar]
- Shmueli K, van Gelderen P, de Zwart JA, Horovitz SG, Fukunaga M, Jansma JM, Duyn JH. Low-frequency fluctuations in the cardiac rate as a source of variance in the resting-state fMRI BOLD signal. Neuroimage. 2007;38:306–320. doi: 10.1016/j.neuroimage.2007.07.037. [DOI] [PMC free article] [PubMed] [Google Scholar]
- Solages A, Vita JA, Thornton DJ, Murray J, Heeren T, Craven DE, Horsburgh CR., Jr Endothelial function in HIV-infected persons. Clin Infect Dis. 2006;42:1325–1332. doi: 10.1086/503261. [DOI] [PMC free article] [PubMed] [Google Scholar]
- Stein JH, Klein MA, Bellehumeur JL, McBride PE, Wiebe DA, Otvos JD, Sosman JM. Use of human immunodeficiency virus-1 protease inhibitors is associated with atherogenic lipoprotein changes and endothelial dysfunction. Circulation. 2001;104:257–262. doi: 10.1161/01.cir.104.3.257. [DOI] [PubMed] [Google Scholar]
- Thompson PM, Dutton RA, Hayashi KM, Toga AW, Lopez OL, Aizenstein HJ, Becker JT. Thinning of the cerebral cortex visualized in HIV/AIDS reflects CD4 + T lymphocyte decline. Proc Natl Acad Sci U S A. 2005;102:15647–15652. doi: 10.1073/pnas.0502548102. [DOI] [PMC free article] [PubMed] [Google Scholar]
- Tozzi V, Balestra P, Galgani S, Narciso P, Sampaolesi A, Antinori A, Giulianelli M, Serraino D, Ippolito G. Changes in neurocognitive performance in a cohort of patients treated with HAART for 3 years. J Acquir Immune Defic Syndr. 2001;28:19–27. doi: 10.1097/00042560-200109010-00004. [DOI] [PubMed] [Google Scholar]
- Wiley CA, Schrier RD, Nelson JA, Lampert PW, Oldstone MB. Cellular localization of human immunodeficiency virus infection within the brains of acquired immune deficiency syndrome patients. Proc Natl Acad Sci U S A. 1986;83:7089–7093. doi: 10.1073/pnas.83.18.7089. [DOI] [PMC free article] [PubMed] [Google Scholar]
- Yousry TA, Schmid UD, Alkadhi H, Schmidt D, Peraud A, Buettner A, Winkler P. Localization of the motor hand area to a knob on the precentral gyrus. A new landmark. Brain. 1997;120(Pt 1):141–157. doi: 10.1093/brain/120.1.141. [DOI] [PubMed] [Google Scholar]