Abstract
A high-throughput approach and platform using 15 minute reversed-phase capillary liquid chromatography (RPLC) separations in conjunction with ion mobility spectrometry-mass spectrometry (IMS-MS) measurements was evaluated for the rapid analysis of complex proteomics samples. To test the separation quality of the short LC gradient, a sample was prepared by spiking twenty reference peptides at varying concentrations from 1 ng/mL to 10 µg/mL into a tryptic digest of mouse blood plasma and analyzed with both a LC-Linear Ion Trap Fourier Transform (FT) MS and LC-IMS-TOF MS. The LC-FT MS detected thirteen out of the twenty spiked peptides that had concentrations ≥100 ng/mL. In contrast, the drift time selected mass spectra from the LC-IMS-TOF MS analyses yielded identifications for nineteen of the twenty peptides with all spiking levels present. The greater dynamic range of the LC-IMS-TOF MS system could be attributed to two factors. First, the LC-IMS-TOF MS system enabled drift time separation of the low concentration spiked peptides from the high concentration mouse peptide matrix components, reducing signal interference and background, and allowing species to be resolved that would otherwise be obscured by other components. Second, the automatic gain control (AGC) in the linear ion trap of the hybrid FT MS instrument limits the number of ions that are accumulated to reduce space charge effects and achieve high measurement accuracy, but in turn limits the achievable dynamic range compared to the IMS-TOF instrument.
Keywords: Ion mobility spectrometry, IMS-MS, LC-IMS-MS, high-throughput RPLC
Introduction
With the ability to quantify peptides and proteins in organisms, tissues, cells, and biological fluids, mass spectrometry (MS) based technologies are playing a crucial role in the discovery of new candidate biomarkers.1,2,3,4,5,6 In spite of significant advances, these technologies remain challenged by biofluid samples such as plasma in which protein concentrations of interest span a dynamic range greater than 10 orders of magnitude.7,8 This extreme dynamic range challenge coupled with the large heterogeneity of plasma samples has greatly hindered current proteomic approaches from effectively discovering low level candidate biomarkers.9,10,11 Approaches to increase the dynamic range and uncover low-level proteins of potential interest often involve a depletion step to remove high abundance proteins and/or use of some form of fractionation to decrease sample complexity prior to liquid chromatography (LC)-MS analysis. While fractionation reduces sample complexity and dynamic range, it also transforms each sample into many subsamples and thus reduces measurement throughput. Inadequate measurement throughput e.g. to effectively account for biological diversity has been another major challenge. To increase the analysis throughput and detectable dynamic range in LC-MS measurements, several strategies have been utilized. First, 2-column LC systems12,13 were designed to perform a gradient sample separation on one column while at the same time re-equilibrating the other column. However, the duty cycle of 2-column systems was limited because both columns were connected to the same mobile phase mixer preventing the overlap of sample loading and gradient runs. To surpass this limitation, a fully automated 4-column LC system with 2 mobile phase mixers was developed.14 Because the 2-mixers are independent of each another, a gradient may be performed on one mixer while a sample is loaded onto a column connected to the other mixer. This leads to a duty cycle of nearly 100%, more than doubling that of a 1-column system operating with similar chromatographic parameters. To further reduce analysis time, the LC gradient time can also be decreased.15,16 Although throughput increases with the use of short gradients, separation efficiency decreases resulting in a reduced number of peptide identifications e.g. as a result of co-eluting peptides occurring simultaneously at the MS detector.
To both increase measurement throughput and the number of peptides identifications (while still utilizing short LC gradients), an additional fast separation stage such as ion mobility spectrometry (IMS) prior to the MS analysis would be beneficial. IMS separates ions based on the fact that different ion shapes and charge states travel at different velocities when pulled by a weak electric field through a drift cell filled with an inert buffer gas.17 By coupling IMS to time-of-flight (TOF) MS, samples can be analyzed based on both size and m/z, and the high speed of IMS separations (~10–100 ms) and TOF MS spectrum acquisition (~100 µs) also allows the multidimensional IMS-MS analysis to occur much faster than typical elution peak profiles in fast LC separations.18,19, 20 Thus, by adding the IMS separation between LC and MS measurements, an increase in the overall peak capacity of a high-throughput LC-MS system and the depth of coverage characteristic of longer (more traditional) LC-MS experiments might be achieved simultaneously.
In this study, we demonstrate the coupling of a fast (~15-min gradient) LC system with an IMS-TOF MS platform. Previously, LC-IMS-MS analyses of complex proteomic samples have been reported by coupling commercially-available, 1-column LC systems with IMS-TOF MS instruments.21,22,23,24 These measurements utilized LC gradients from 21 to 145 minutes and although promising results were reported, the duty cycle of the 1-column LC separation ultimately limited analysis throughput. The present 4-column, 2-mixer LC platform performs staggered separations and can attain almost 100% duty cycle when operated within well-defined time parameters for column load, gradient elution, purge, and regeneration steps. To evaluate this platform, we analyzed a mouse plasma sample digested with trypsin and spiked with 20 different peptides at concentration levels that varied from 1 ng/mL to 10 µg/mL. The same sample was analyzed with an LC-linear ion trap-Fourier transform ion cyclotron resonance (FTICR) MS platform, using 15.5- and 100-min LC gradients, and the results from two experiments were compared. In addition to the number of detected spiked peptides and concentration levels observed with each platform, we also report the peak area coefficient of variation (CV) for each spiked peptide, which was determined from ten technical replicates to assess the error associated with each measurement.
Experimental Methods
Materials
The initial concentration of mouse plasma purchased from Sigma-Aldrich (St. Louis, MO), was 41.9 mg/mL based on a Pierce BCA protein assay. Three high abundance plasma proteins (i.e., albumin, IgG, and transferrin) that constitute ~80% of the total protein mass were removed from the mouse plasma using a prepacked 4.6 × 50-mm (loading capacity, 37–50 µL of plasma) multiple affinity removal (MARS) column and an Agilent 1100 series HPLC system (both from Agilent, Palo Alto, CA). Loading/equilibrating buffer (Buffer A) and stripping buffer (Buffer B) were also obtained from Agilent. The mouse plasma sample was subjected to 24 individual MARS separations, each of which consisted of sample loading-washing-eluting steps followed by re-equilibration for a total cycle time of 20 min. The resulting flow-through fractions were collected and concentrated in Amicon Ultra-15 concentrators (Millipore, Billerica, MA) with 5-kDa molecular mass cutoffs, and the buffer was exchanged to 50 mM NH4HCO3 in the same unit, according to the manufacturer’s instructions.
Tryptic digestion was performed by denaturing the flow-through proteins, using 8 M urea for 1 h at 37°C, followed by reduction using 10 mM dithiothreitol for 1 h at 37 °C. The proteins were subsequently alkylated by incubating the plasma sample with 40 mM iodoacetamide for 1 h at room temperature in the dark. The protein mixture was then diluted 10 fold using 50 mM NH4HCO3, after which sequencing grade modified porcine trypsin (Promega, Madison, WI) was added at a trypsin:protein ratio of 1:50. CaCl2 was also added to the protein mixture to a final concentration of 1 mM, and the mixture was incubated at 37 °C for 3 h. The tryptic digest was loaded onto a 1-mL, 100-mg solid-phase extraction (SPE) C18 column (Supelco, Bellefonte, PA) and washed with 4 mL of 0.1% TFA:5% ACN:95% water. Peptides eluted from the SPE column with 1 mL of 0.1% TFA:80% ACN:20% water were lyophilized. The samples were concentrated in a speed-vac, combined, and reconstituted in 25 mM NH4HCO3. The final peptide concentration was 15.6 mg/mL according to BCA protein assay.
Twenty non-plasma peptides (Table 1) were purchased from Sigma-Aldrich and used without further purification. A final concentration of 1 mg/mL was desired for the tryptically-digested mouse plasma sample to avoid undesirable clogging effects. The plasma sample was diluted to 1 mg/mL with mobile phase A [purified water:0.2% acetic acid (Sigma-Aldrich):0.05% trifluoroacetic acid (Sigma-Aldrich)] and the 20 non-plasma peptides which had specific final concentrations from 1 ng/mL to 10 µg/mL (noted in Table 1). An additional standard sample consisting of the 20 peptides spiked into mobile phase A at the same concentrations as in the mouse plasma sample was prepared to determine the elution times of the spiked peptides and to compare the dynamic range of detection with the spiked mouse plasma sample.
Table 1.
Non-plasma peptides spiked into mouse plasma and standard
| Spiking Level | Peptide |
|---|---|
| 1 ng/mL | ACTH Fragment 18–39, Fibrinopeptide A |
| 10 ng/mL | (D-Ala-6) LHRH, Bradykinin Fragment, Fibrinopeptide B 1–7, Renin Substrate Porcine |
| 100 ng/mL | Gamma-Endorphin, Leucine Enkephalin, Kemptide, ProteoMass P14R MALDI-MS, Diazepam Binding Inhibitor Standard |
| 1 µg/mL | 3X FLAG Peptide, Methionine Enkephalin, Syntide 2, Des Pro Ala Bradykinin |
| 10 µg/mL | Tyr C Peptide, [D-Ala2]-Deltorphin II, Osteocalcin Fragment 7–19 Human, [Ala92]- Peptide 6, Dynorphin A Porcine Fragment 1–13 |
RPLC System
Reverse phase LC was performed using a fully automated 4-column, 2-mixer LC system designed in house and previously characterized.14 Briefly, the system consists of two 1.5 mL stainless mixers and four 10-cm long, 50 µm i.d. reversed-phase capillary columns (two for each sub-system) packed in-house with porous 3-µm C18 bonded particles (Phenomenex, Torrance, CA)25. Each column was preceded with a ~45 cm long × 50 µm i.d. extension capillary coupled to the column selection valve and was terminated by a chemically-etched 20-µm i.d. fused-silica emitter26 at the end for electrospray ionization (ESI).
Mobile phase A consisted of nanopure water with 0.2% acetic acid (Sigma-Aldrich) and 0.05% trifluoroacetic acid (Sigma-Aldrich). Mobile phase B consisted of a 90:10 v:v acetonitrile (Fisher Scientific, Waltham, MA):nanopure water with 0.1% trifluoroacetic acid (Sigma-Aldrich). After loading 5 µL of sample onto the column, 100% mobile phase A was applied for 10 min and an average flow rate of 1.43 ± 0.11 µL/min was observed through all columns. An exponential gradient was accomplished by increasing mobile phase B from 0 to 70% over 17.5 min. Data were not collected during the first 2 min since only solvent ions would elute, so the effective gradient was 15.5-min. The duty cycle was calculated to be ~95% between automated refills.
IMS-TOF MS
Eluting peptides from the LC column were analyzed in positive ESI mode by the IMS-TOF MS.27 The electrospray plume was sampled using a 64-mm long heated capillary inlet heated to 120°C,28 and the ions were then transmitted into an hourglass ion funnel29 that focuses and traps the ions, converting the continuous ion beam from the ESI source into a discrete short ion pulse for mobility measurements. Ions were ejected from the ion funnel and passed into the drift cell filled with 4.0 Torr of ultra-pure nitrogen buffer gas, by pulsing the high-transmission ion gate 2-mm behind the last ion funnel electrode for 100 µs. Once inside the 98-cm drift cell region,26 the ions were gently pulled through the buffer gas by a uniform, weak electric field E (~16 V/cm). The ions quickly reached an equilibrium between the forward acceleration force imposed by the electric field and the frictional drag force from the buffer gas. As a consequence, the ions drifted at constant velocity, vd, proportional to the applied field E:17
| (1) |
where the proportionality constant K is termed the mobility of the ions. As the ions exited the drift cell, they were refocused by the rear ion funnel and transmitted through two differentially pumped short quadrupole chambers. The pressure in the second quadrupole chamber was maintained at 170 mTorr to minimize the ion transient time between the drift cell at 4 Torr and the TOF detector at 10−7 Torr. An orthogonal acceleration TOF MS (Agilent Technologies) was utilized for accurate m/z measurement of mobility separated ions and a time-to-digital converter (TDC) recorded the ion counts that were signal averaged for 10 s. A detailed description of the instrument control software and data acquisition scheme is reported elsewhere.28
LTQ-FT MS
Samples were also analyzed using a hybrid linear ion trap-FTICR mass spectrometer (Thermo Finnigan LTQ-FT) for comparison with the IMS-MS analyses. An ESI interface incorporating an electrodynamic ion funnel was designed and implemented on the LTQ-FT with ion funnel dimensions and voltage settings similar to those previously reported.29 The ESI voltage was set to 2.4 kV and the temperature of the heated inlet capillary was set to 200°C. FTICR analyses were performed in an m/z range of 400 to 2000 at a maximum ion accumulation time of 2500 ms in the ICR trap, and an automated gain control (AGC) target of 5×10⁵ to maintain high mass measurement accuracy.
Results and Discussion
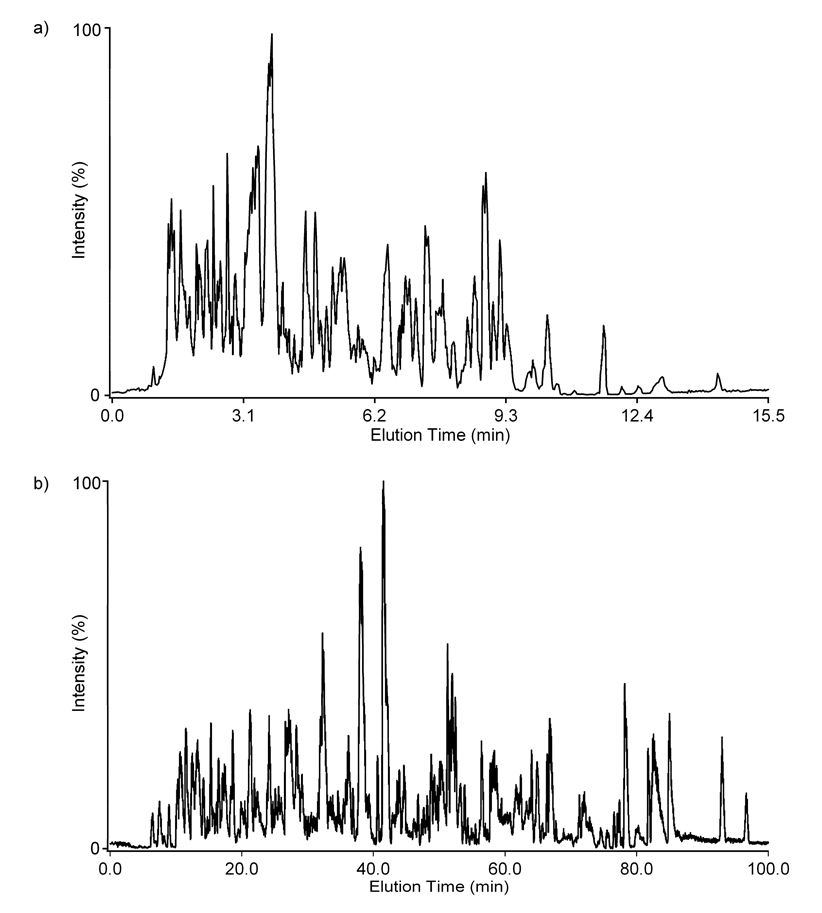
To evaluate the separation quality of the short 15.5-min LC gradient and the utility of the IMS separation, we analyzed a complex tryptic digest of mouse plasma spiked with 20 reference peptides (Table 1) using both the LC-(LTQ)-FT MS and LC-IMS-TOF MS platforms. Since mouse plasma has many peptides with masses similar to those of the spiked peptides, a standard sample containing only the 20 reference peptides (in Mobile phase A and diluted to the same concentrations as in the mouse plasma sample) was studied initially to establish m/z and elution time information for each. All 20 peptides were detected in the standard sample with the LC-FT MS allowing the accurate mass and normalized elution time (NET) values to be used in the search for the spiked components in the mouse plasma sample. However, when the mouse plasma sample was analyzed with the LC-FT MS, only 13 of the 20 spiked peptides could be detected and all 13 had concentrations ≥100 ng/mL (Table 2). Peptides at concentrations lower than 100 ng/mL were not detected in the mouse plasma sample and kemptide which had concentration of 100 ng/mL was also not observed. Since short LC gradients are known to exhibit lower peak capacities and co-elution of many peptides causes ion suppression in the ESI process,14,30,31 the same sample was reanalyzed using a 100-min gradient and the same LTQ-FT mass spectrometer. However, even with the longer 100-min LC gradient, only 14 of the 20 spiked peptides at concentration ≥100 ng/mL were detected including all the peptides identified in the 15.5-min LC-MS analysis plus kemptide. Since none of peptides spiked at concentrations <100 ng/mL were detected with either the 15.5- or 100-min LC gradient, ionization suppression did not play a dominant role in this study. The LC-MS base peak chromatograms for the spiked mouse plasma sample with the 15.5- and 100-min gradient are shown in Figure 1 to illustrate how the elution time profiles vary when the gradient time is changed.
Table 2.
Peak area CV values for the 20 non-plasma peptides spiked into mouse plasma and their 15.5-min LC-IMS-TOF MS and 15.5- and 100-min LC-MS analyses
| CV Values (%) a | ||||
|---|---|---|---|---|
| Spiking Level | Peptide | 15.5 min LC-IMS-MS |
15.5 min LC-MS |
100 min LC-MS |
| 1 ng/mL | ACTH Fragment 18–39 | ND | ND | ND |
| 1 ng/mL | Fibrinopeptide A | 11.52 | ND | ND |
| 10 ng/mL | (D-Ala-6) LHRH | 12.56 | ND | ND |
| 10 ng/mL | Bradykinin Fragment 1–7 | 12.11 | ND | ND |
| 10 ng/mL | Fibrinopeptide B | 11.42 | ND | ND |
| 10 ng/mL | Renin Substrate Porcine | 9.74 | ND | ND |
| 100 ng/mL | Gamma-Endorphin | 11.56 | 9.01 | 7.17 |
| 100 ng/mL | Leucine Enkephalin | 11.05 | 6.25 | 9.11 |
| 100 ng/mL | Kemptide | 9.78 | ND | 13.99 |
| 100 ng/mL | ProteoMass P14R MALDI-MS Standard | 9.65 | 17.40 | 3.36 |
| 100 ng/mL | Diazepam Binding Inhibitor | 5.78 | 14.38 | 19.50 |
| 1 µg/mL | 3X FLAG Peptide | 10.04 | 23.67 | 16.88 |
| 1 µg/mL | Methionine Enkephalin | 8.24 | 4.84 | 5.44 |
| 1 µg/mL | Syntide 2 | 5.51 | 7.16 | 12.88 |
| 1 µg/mL | Des Pro Ala Bradykinin | 2.74 | 8.31 | 5.56 |
| 10 µg/mL | Tyr C Peptide | 9.98 | 10.36 | 8.36 |
| 10 µg/mL | [D-Ala2]-Deltorphin II | 7.78 | 8.57 | 9.45 |
| 10 µg/mL | Osteocalcin Fragment 7–19 Human | 2.68 | 9.36 | 9.06 |
| 10 µg/mL | [Ala92]-Peptide 6 | 2.21 | 5.32 | 5.78 |
| 10 µg/mL | Dynorphin A Porcine Fragment 1–13 | 1.52 | 5.56 | 6.66 |
ND = not detected
Figure 1.
Typical LC-MS base peak chromatograms for the spiked mouse plasma sample with the a) 15.5 and b) 100 minute gradients. An average elution time for each peptide was ~4 seconds with the 15.5-min gradient and ~20 seconds in the 100-min gradient.
To understand why all of the spiked peptides could be observed in the standard sample without the mouse plasma matrix, but only peptides ≥100 ng/mL could be detected in both the 15.5-and 100-min gradients with mouse plasma, the components of the LTQ-FT were examined. The primary factor limiting the instrument’s dynamic range when analyzing complex samples is the automatic gain control (AGC) for the ion trap. AGC provides automated regulation of ion populations in the ion trap by monitoring ion beam intensity and performing on-the-fly adjustments to the ion injection time.32,33 The control over ion population is important for an ion trap whose performance degrades at excessive space charge. However, this ultimately reduces the dynamic range for analyzing complex samples because high abundance ions quickly fill the trap, while the number of lower abundance ions remains below the limit of detection.
In an attempt to detect the low concentration reference peptides in the mouse plasma sample and avoid the possible dynamic range reduction due to AGC, an IMS-TOF MS instrument was utilized. One of the advantages of using the IMS separation between an ion funnel trap and TOF MS arises from the fact that dense ion packets ejected from the ion funnel disperse in the IMS drift cell, reducing the ion impact on the detector per TOF MS acquisition. Second, an ion funnel trap has a greater charge capacity than the linear quadrupolar ion trap coupled to the FTICR. While the ion funnel trap capacity was measured to be 107 elementary charges under optimized conditions,34,35 the quadrupolar ion trap was limited to 105 elementary charges to avoid detrimental effects on mass measurement accuracy with FTICR. Third, the IMS stage enables separation of the low concentration reference peptides from the higher concentration mouse plasma peptides of similar m/z and elution time. This separation allows the ions to be spread through a range of drift times and not all arrive simultaneously at the detector.36,37
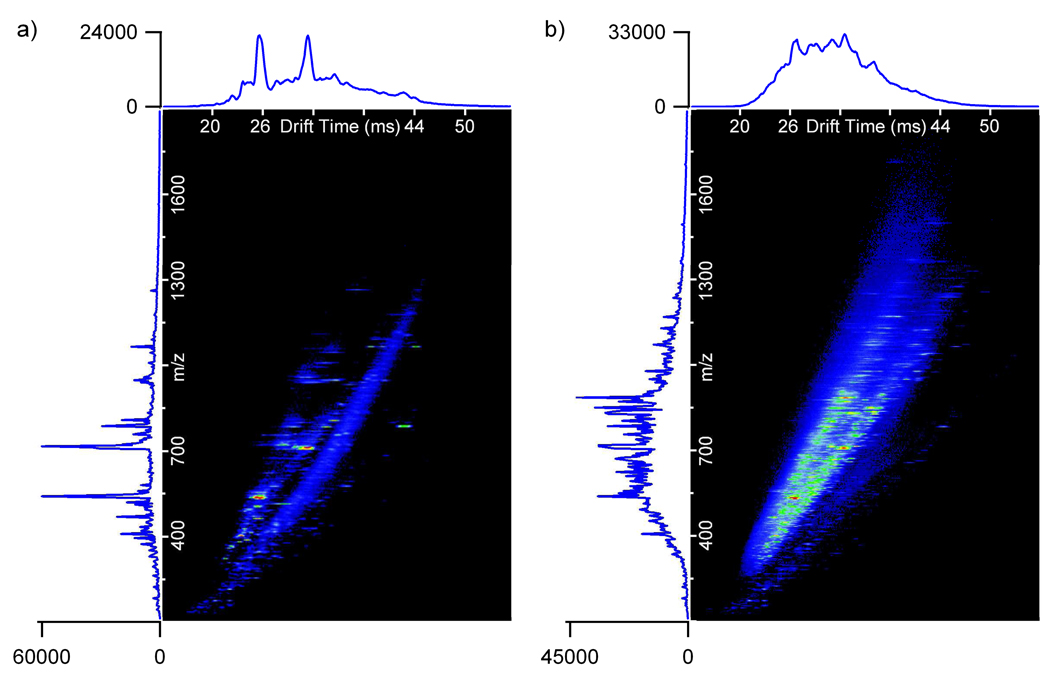
Prior to analyzing the mouse plasma sample with the LC-IMS-TOF MS platform, the standard sample was analyzed using the 15.5-min gradient. All 20 spiked peptides were observed in the standard, indicating that the sensitivity of the IMS-TOF MS was, at least, similar to that of LTQ-FT. The spiked mouse plasma sample was then studied with LC-IMS-TOF MS. To illustrate the difference in sample complexity between the standard and mouse plasma samples, Figure 2 shows IMS-TOF MS nested spectra summed over the entire LC separation for both measurements. In the LC-IMS-MS measurements of the mouse plasma sample, 19 of the 20 spiked peptides were detected at concentration levels from 1 ng/mL to 10 µg/mL (Table 2) using the known mass and elution time information from the standard sample. The only peptide not detected in the LC-IMS-MS analysis was ACTH fragment 18–39, which was injected at the lowest spiking level (1 ng/mL). However, fibrinopeptide A which was also injected at the lowest concentration (1 ng/mL) was observed due to the ionization efficiency differences between the two peptides. As described above, the LTQ-FT was only able to detect 13 of the spiked peptides with concentrations ranging from 100 ng/mL to 10 µg/mL when the 15.5-min LC gradient was employed. This indicates that IMS-TOF MS provides an extended dynamic range in the analysis of complex mixtures and is capable of detecting species in the concentration range of 1 ng/mL to 10 µg/mL.
Figure 2.
The 15.5-min LC-IMS-MS nested spectra summed over all LC elution times for the 20 peptides spiked into a) mobile phase A (standard) and b) mouse plasma.
The mass spectra from both LC-IMS-MS and LC-MS analyses were evaluated to better understand the observed differences in detection. For the purpose of this discussion, the spectra for renin substrate porcine (referred to as “renin” in the rest of the manuscript) and bradykinin fragment 1–7 will be used as examples since they were typical of peptides at the 10 ng/mL spiking level. Initially, the most abundant m/z value and elution time for each spiked peptide was extracted from the standard sample in the data analysis procedure. The most abundant charge state for renin was determined to be 3+ (m/z = 586.98) with an elution time of 5.2 min, while singly protonated bradykinin fragment 1–7 had an elution time of 2.8 min (m/z = 757.39). These values were utilized to search for the two peptides in the mouse plasma sample. However, neither peptide could be detected in the LC-MS spectrum, even with a range of elution times around the observed values in addition to ±5 ppm mass error and correct isotope spacing constraints. The mass error tolerance of ±5 ppm was slightly higher than the typical width of mass error histogram (generally 2 to 3 ppm) for the LTQ-FT after recalibration. The higher mass error was used to ensure peptide observation in case of the increased systematic frequency shifts.
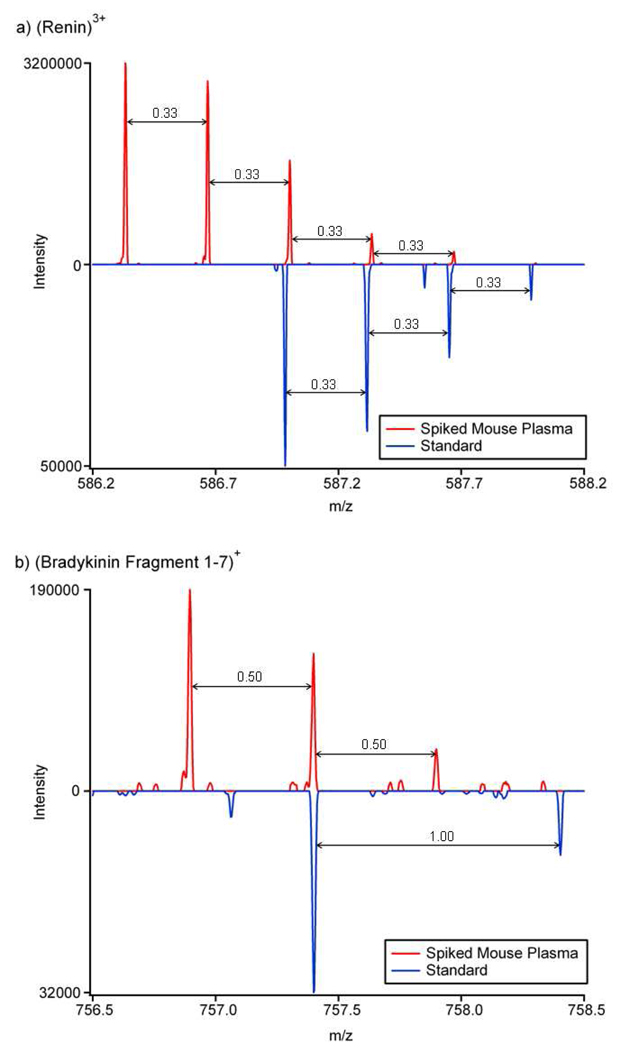
Representative LC-FT MS mass spectra are provided in Figure 3 for the mouse plasma (red) and standard (blue) samples. Close examination of these spectra illustrated that high concentration mouse plasma peptides interfere with the detection of both peptides. For example, in Figure 3a, the high intensity 3+ mouse plasma peptide with isotopes at similar m/z values as (renin)3+ elutes at the same time as renin and interferes with its lower intensity signal. Similarly, (Bradykinin 1–7)+ in Figure 3b could not be detected because of the overlapping with the isotope pattern of a 2+ mouse plasma peptide co-eluted with the spiked peptide. The mass spectra for the other low concentration peptides not observed in the LC-MS analysis of the mouse plasma sample [Fibrinopeptide B, (D-Ala-6) LHRH, Fibrinopeptide A and ACTH Fragment 18–39] also showed high intensity mouse plasma peptides co-eluting in their corresponding m/z ranges, which would detrimentally affect their signals.
Figure 3.
The 15.5 minute LC-MS spectra of the 10 ng/mL peptides a) (renin)3+ and b) (bradykinin fragment 1–7)+. The inverted blue spectra from the standard sample show the correct m/z and isotopic data for each peptide, while the red spectra from the mouse plasma sample show the spectra for the elution time when the spiked peptides should be observed.
With IMS, overlapping m/z species can be separated in the gas phase. However, since the arrival time distribution (ATD) for each ion extends over ~1 ms, better peak statistics are obtained when multiple drift times are summed to generate a mass spectrum. Therefore, we modified our Decon2LS38,39 software to sum the m/z information for a user specified drift time range, create a mass spectrum from that range, deisotope the mass spectrum, and move to the next drift time region. For example, if the total IMS drift time was from 0 to 60 ms with a resolution of 0.1 ms, and the user specified a ±0.5 millisecond drift time selection region, analysis of the data would start by summing the m/z information in the drift time region from 0–1 ms, deisotope that region and then move to 0.1–1.1 ms, 0.2–1.2 ms, 0.3–1.3 ms, …., 59–60 ms. A running sum was implemented while incorporating boundary conditions to efficiently process mass spectra for each and every drift time at a particular elution time window. To avoid incorrect quantitation, the original raw abundance information was also retained for each deisotoped peak.
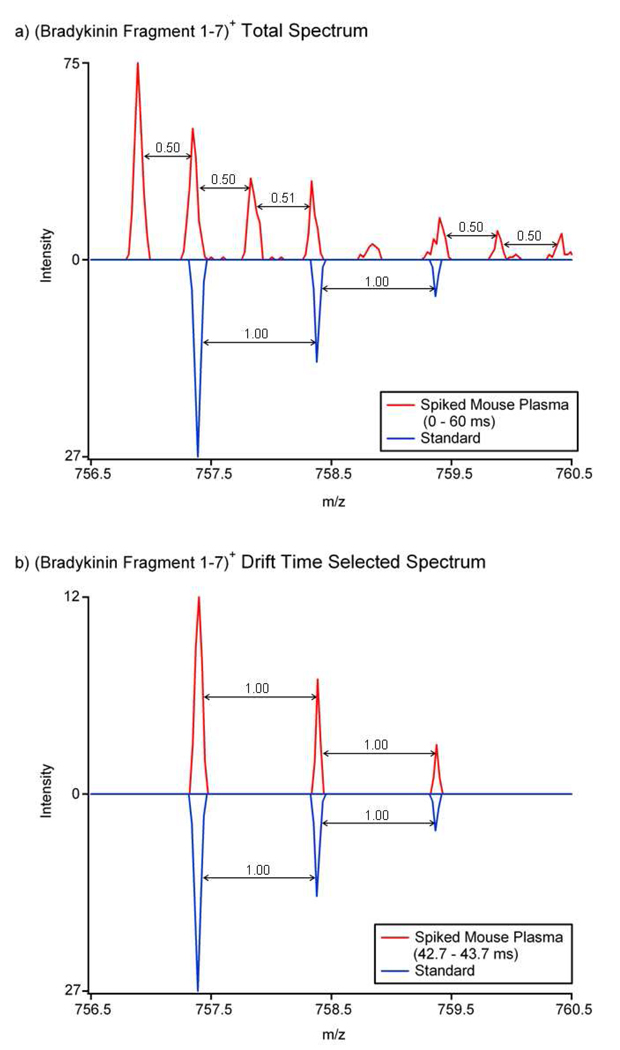
When deisotoping IMS data, it is very important to select the range of drift times for summing based on the peak widths observed in the ATDs; otherwise mass spectral peak interference results, as shown in Figure 4. In Figure 4a, a 60-ms drift time summing window was used on the LC-IMS-MS data for (bradykinin fragment 1–7)+, and the m/z information for all of the drift times were summed together. The resulting mass spectrum looked very similar to the LC-FT MS spectrum in Figure 3b and (bradykinin fragment 1–7)+ could not be distinguished from the higher abundance mouse plasma peptide. However, when a 1-ms drift time region was selected, as shown in Figure 4b, (bradykinin fragment 1–7)+ was observed in the mass spectrum acquired for the drift time region of 42.7–43.7 ms. Therefore, IMS separation and appropriate signal summation over the IMS domain distinguished the peptides of interests from ions with similar m/z values but different drift times, and increased their signal-to-noise ratios. As a result, the 2+ mouse plasma peptide which interfered in both the LC-FT MS (Figure 3b) and summed drift time mass spectra (Figure 4a), was removed from the drift time selected mass spectrum.
Figure 4.
The 15.5 minute LC-IMS-MS a) summed and b) drift time selected mass spectra for (bradykinin fragment 1–7)+. The mouse plasma sample spectra are red and the inverted blue spectra from the standard show the correct isotopic pattern for (bradykinin fragment 1–7)+. When all drift times are summed, (bradykinin fragment 1–7)+ cannot be observed because a 2+ mouse plasma peptide interferes with its deisotoping, but if drift time selection from 42.7 to 43.7 ms is carried out, bradykinin fragment 1–7 is easily deisotoped.
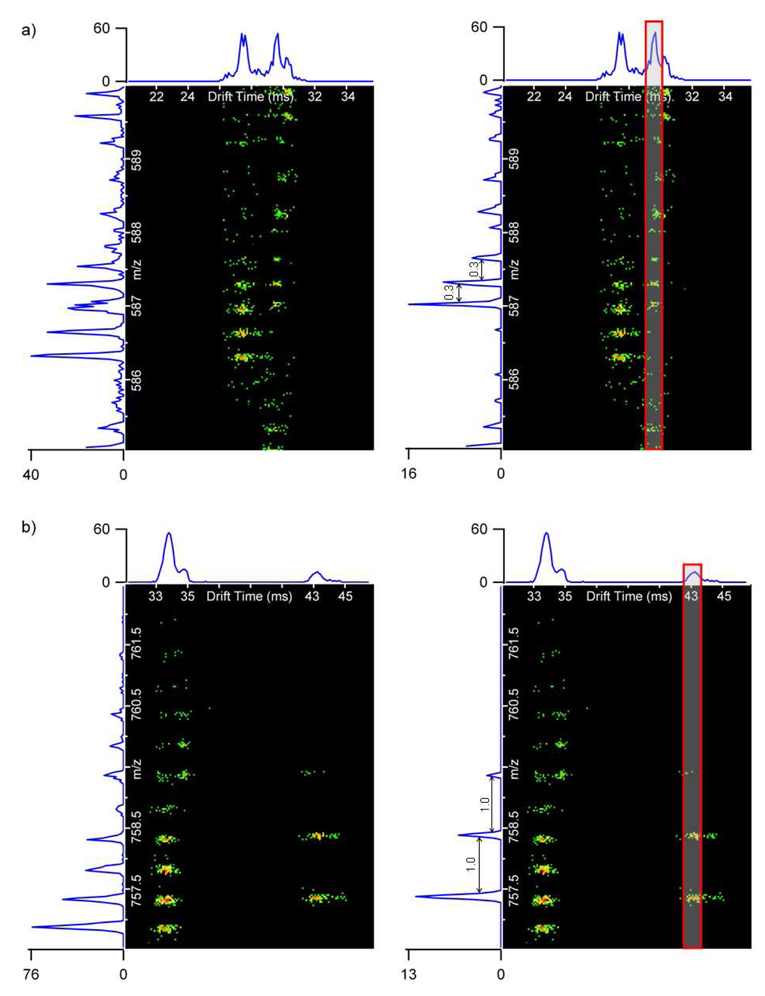
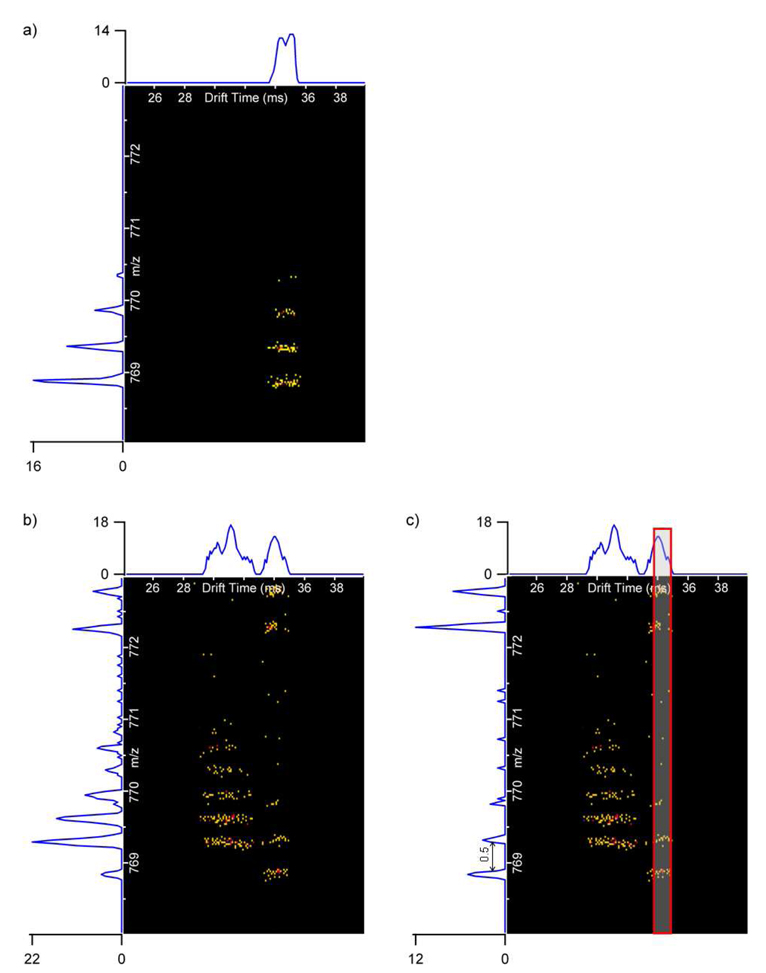
The nested spectra (plots of drift time, m/z, and intensity) for (renin)3+ and (bradykinin fragment 1–7)+ in Figure 5 further illustrate the utility of the IMS separation for detecting similar m/z values with different drift times. On the left side of Figure 5, the m/z information from all the drift times is summed together. Since high intensity mouse plasma peptides are present in the summed mass spectra for both (renin)3+ and (bradykinin fragment 1–7)+, neither of these peptides could be deisotoped. However, the mass spectra for a 1-ms drift time selection window on the right side of Figure 5 eliminated the interference of the mouse plasma peptides occurring at the same m/z range and allowed both (renin)3+ and (bradykinin fragment 1–7)+ to be easily deisotoped. Figure 6a shows the isotope distribution and drift time for (fibrinopeptide A)2+, one of the lowest concentration peptides (1 ng/mL) in the sample. Similar to (renin)3+ and (bradykinin fragment 1–7)+, if the m/z information from all drift times was summed (Figure 6b), then (fibrinopeptide A)2+ could not be deisotoped. However, if a small drift time window was selected (Figure 6c), then (fibrinopeptide A)2+ was readily distinguished from the interfering mouse plasma peptide, and its mass spectrum was similar to the standard mass spectrum in Figure 6a. These examples illustrate the importance of the IMS separation for identification of low abundance species whose m/z’s are similar to those of higher abundance matrix components. Importantly, identification of all the spiked peptides was performed with the use of their accurate mass and retention time, and ion mobility separation has been effectively applied to remove interferences with matrix components.
Figure 5.
The nested spectra for the 10 ng/mL peptides a) (renin)3+ and b) (bradykinin fragment 1–7)+ in the mouse plasma sample acquired with the 15.5 minute LC gradient. The total ion chromatograms (TICs) are displayed above the nested spectra and mass spectra are on the left side. The mass spectra on the left sum all drift times, while the mass spectra on the right only sum a 1 ms drift time window (shown by the red box). By only summing a small window, both (renin)3+ and (bradykinin fragment 1–7)+ can be deisotoped (deisotoping to the tenths place is shown for clarity).
Figure 6.
The nested spectra for 1 ng/mL (fibrinopeptide A)2+ acquired with the 15.5 minute LC gradient in mobile phase A for a) and mouse plasma for b) and c). The mass spectrum in b) sums all drift times, while the mass spectrum in c) only sums a 1 ms drift time window (shown in red). Detection and deisotoping of the (fibrinopeptide A)2+ is only possible with the drift time window selection.
Another important question addressed in this study was whether the IMS dimension would reduce the experimental error in measured intensity since it separates ions that may have overlapping peaks in MS-only analyses. To quantify the results of LC-FT MS and LC-IMS-TOF MS analyses, ten technical replicates of the spiked mouse plasma sample were run on each instrument. The variable of interest for our study was peak area, so first we calculated the area under the mass spectral peak of the most abundant charge state for each of the spiked peptides observed in the LC-MS and LC-IMS-MS analyses. The mean area ( x̄ ) and standard deviation (σ) were then acquired for each peptide to calculate the coefficient of variation (CV) values (Equation 2) which measure the degree of variation or experimental error in a study. The resulting peak area CV values for each platform are listed in Table 2.
| (2) |
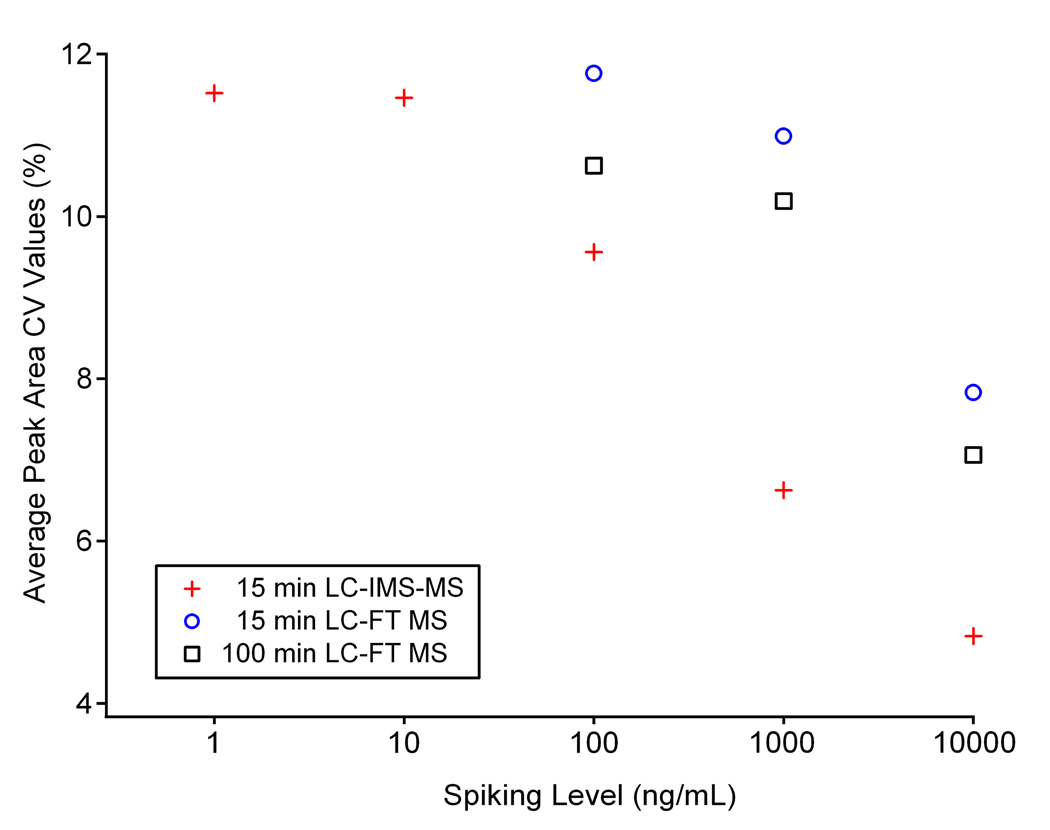
In the LC-IMS-MS measurements, all peak area CV values were under 13%.39 To further evaluate the data and establish a relationship between spiking level and CV, the average peak area CV value at each spiking level is depicted in Figure 7. Note the linear decrease in CV values for the LC-IMS-TOF MS data as peptide concentrations increase from 10 ng/mL to 10 µg/mL. This linearity is most likely due to the fact that peak areas for high concentration peptides were less prone to ion statistical variations over the course of analysis than the peak areas of low concentration peptides.
Figure 7.
Average peak area CV values for each spiking level in the mouse plasma sample. The average CV values from all the analyses increase with decreasing concentration. The average LC-IMS-MS peak area CV values were lower than the LC-MS values at all three spiking levels where peptides were detected for all three platforms.
Since only the peptides spiked into mouse plasma at concentrations ≥100 ng/mL (using both the 15.5- and 100-min gradients) could be detected in the LC-FT MS experiments, the respective CV values could be directly compared with those obtained with LC-IMS-TOF MS. The CV values for the 13 peptides detected in the 15.5-min LC-FT MS analysis and the 14 peptides detected in the 100-min LC-FT MS study mostly fell below 14% (Table 2). Several CV outliers existed in the LC-MS studies, implying that more experimental variation existed in the LC-MS peak areas than in the LC-IMS-MS analysis. To further compare the methods, the average CV values at each spiking level were examined for all three studies. Overall, the LC-IMS-TOF MS study with the 15.5-min gradient measurements had the least experimental error and lowest average peak area CV values at every spiking level. The results from this CV value study demonstrate that IMS drift time separation and spectra summation in the IMS domain improve peak statistics and allow more precise measurement of peak areas than LC-MS alone.
Conclusion
In summary, we have conducted a preliminary evaluation of a high-throughput method and platform employing a ~15 minute LC gradient in combination with IMS-MS to quickly analyze samples, while detecting ions at low concentration levels in complex mixtures. This evaluation showed:
The 15-min LC gradient developed on the 4-column, 2-mixer LC system had a duty cycle of ~95%, allowing analysis ~90 samples per day.
The 15-min LC-IMS-TOF MS analysis provided lower peak area CV values than either the 15- or 100-min LC-FT MS analyses, indicating the benefits of the additional IMS separation stage for quantitative studies.
The LC-IMS-TOF MS measurements provided a greater dynamic range in analysis of the spiked mouse plasma sample than those using the LC-FT MS. This improvement was attributed to the additional separation peak capacity offered by IMS drift time, which eliminated interference from higher concentration mouse plasma peptides with similar m/z values and allowed detection of spiked peptides at 1 ng/mL and 10 ng/mL concentrations.
Acknowledgements
The authors would like to thank Dr. Brian H. Clowers for assistance in making Figure 3 and Figure 4. Portions of this work were supported by the NIH National Center for Research Resources (RR 18522), the NIH National Cancer Institute (R21 CA12619-01), the Washington State Life Sciences Discovery Fund, and the Laboratory Directed Research and Development Program at Pacific Northwest National Laboratory (PNNL). The research was performed using EMSL, a national scientific user facility sponsored by the Department of Energy's Office of Biological and Environmental Research and located at Pacific Northwest National Laboratory.
References
- 1.Aebersold R, Mann M. Mass spectrometry-based proteomics. Nature. 2003;422:198–207. doi: 10.1038/nature01511. [DOI] [PubMed] [Google Scholar]
- 2.Drabik A, Bierczynska-Krzysik A, Bodzon-Kulakowska A, Suder P, Kotlinska J, Silberring J. Proteomics in neurosciences. Mass Spectrom. Rev. 2007;26:432–450. doi: 10.1002/mas.20131. [DOI] [PubMed] [Google Scholar]
- 3.Andersen JS, Wilkinson CJ, Mayor T, Mortensen P, Nigg EA, Mann M. Proteomic characterization of the human centrosome by protein correlation profiling. Nature. 2003;426:570–577. doi: 10.1038/nature02166. [DOI] [PubMed] [Google Scholar]
- 4.Jacobs JM, Mottaz HM, Yu LR, Anderson DJ, Moore RJ, Chen WNU, Auberry KJ, Strittmatter EF, Monroe ME, Thrall BD, Camp DG, Smith RD. Multidimensional proteome analysis of human mammary epithelial cells. J. Proteome Res. 2004;3:68–75. doi: 10.1021/pr034062a. [DOI] [PubMed] [Google Scholar]
- 5.Conrods TP, Zhou M, Petricoin EF, Liotta L, Veenstra TD. Cancer diagnosis using proteomic patterns. Expert Rev. Mol. Diagn. 2003;3:411–420. doi: 10.1586/14737159.3.4.411. [DOI] [PubMed] [Google Scholar]
- 6.Matharoo-Ball B, Ball G, Rees R. Clinical proteomics: Discovery of cancer biomarkers using mass spectrometry and bioinformatics approaches - A prostate cancer perspective. Vaccine. 2007;25:B110–B121. doi: 10.1016/j.vaccine.2007.06.040. [DOI] [PubMed] [Google Scholar]
- 7.Anderson NL, Anderson NG. The human plasma proteome – History, character, and diagnostic prospects. Mol. Cell. Proteomics. 2002;1:845–867. doi: 10.1074/mcp.r200007-mcp200. [DOI] [PubMed] [Google Scholar]
- 8.Omenn GS. Strategies for plasma proteomic profiling of cancers. Proteomics. 2006;6:5662–5673. doi: 10.1002/pmic.200600331. [DOI] [PubMed] [Google Scholar]
- 9.Aebersold R, Anderson L, Caprioli R, Druker B, Harwell L, Smith R. Perspective: A Program to Improve Protein Biomarker Discovery for Cancer. J. Proteome Res. 2005;4:1104–1109. doi: 10.1021/pr050027n. [DOI] [PubMed] [Google Scholar]
- 10.Jacobs JM, Adkins JN, Qian W-J, Liu T, Shen Y, Camp DG, Smith RD. Utilizing Human Blood Plasma for Proteomic Biomarker Discovery. J. Proteome Res. 2005;4:1073–1085. doi: 10.1021/pr0500657. [DOI] [PubMed] [Google Scholar]
- 11.Washburn MP, Wolters D, Yates JR. Large-scale analysis of the yeast proteome by multidimensional protein identification technology. Nat. Biotechnol. 2001;19:242–247. doi: 10.1038/85686. [DOI] [PubMed] [Google Scholar]
- 12.Shen Y, Tolic N, Zhao R, Pasa-Tolic L, Li L, Berger SJ, Harkewicz R, Anderson GA, Belov ME, Smith RD. High-Throughput Proteomics Using High-Efficiency Multiple-Capillary Liquid Chromatography with On-Line High-Performance ESI FTICR Mass Spectrometry. Anal. Chem. 2001;73:3011–3021. doi: 10.1021/ac001393n. [DOI] [PubMed] [Google Scholar]
- 13.Belov ME, Anderson GA, Wingerd MA, Udseth HR, Tang K, Prior DC, Swanson KR, Buschbach MA, Strittmatter EF, Moore RJ, Smith RD. An automated high performance capillary liquid chromatography-Fourier transform ion cyclotron resonance mass spectrometer for high-throughput proteomics. J. Am. Soc. Mass Spectrom. 2004;15:212–232. doi: 10.1016/j.jasms.2003.09.008. [DOI] [PubMed] [Google Scholar]
- 14.Livesay EA, Tang K, Taylor BK, Buschbach MA, Hopkins DF, LaMarche BL, Zhao R, Shen YF, Orton DJ, Moore RJ, Kelly RT, Udseth HR, Smith RD. Fully automated four-column capillary LC-MS system for maximizing throughput in proteomic analyses. Anal. Chem. 2008;80:294–302. doi: 10.1021/ac701727r. [DOI] [PMC free article] [PubMed] [Google Scholar]
- 15.Shen YF, Smith RD, Unger KK, Kumar D, Lubda D. Ultrahigh-Throughput Proteomics Using Fast RPLC Separations with ESI-MS/MS. Anal. Chem. 2005;77:6692–6701. doi: 10.1021/ac050876u. [DOI] [PubMed] [Google Scholar]
- 16.Shen Y, Strittmatter EF, Zhang R, Metz TO, Moore RJ, Li F, Udseth HR, Smith RD, Unger KK, Kumar D, Lubda D. Making Broad Proteome Protein Measurements in 1–5 min Using High-Speed RPLC Separations and High-Accuracy Mass Measurements. Anal. Chem. 2005;77:7763–7773. doi: 10.1021/ac051257o. [DOI] [PubMed] [Google Scholar]
- 17.Mason EA, McDaniel EW. Transport Properties of Ions in Gases. New York, NY: Wiley; 1988. [Google Scholar]
- 18.Valentine SJ, Counterman AE, Hoaglund CS, Reilly JP, Clemmer DE. Gas-phase separations of protease digests. J. Am. Soc. Mass Spectrom. 1998;9:1213–1216. doi: 10.1016/S1044-0305(98)00101-9. [DOI] [PubMed] [Google Scholar]
- 19.Henderson SC, Valentine SJ, Counterman AE, Clemmer DE. ESI/Ion Trap/Ion Mobility/Time-of-Flight Mass Spectrometry for Rapid and Sensitive Analysis of Biomolecular Mixtures. Anal. Chem. 1999;71:291–301. doi: 10.1021/ac9809175. [DOI] [PubMed] [Google Scholar]
- 20.Valentine SJ, Kulchania M, Srebalus Barnes CA, Clemmer DE. Multidimensional separations of complex peptide mixtures: a combined high-performance liquid chromatography/ion mobility/time-of-flight mass spectrometry approach. Int. J. Mass Spectrom. 2001;212:97–109. [Google Scholar]
- 21.Valentine SJ, Plasencia MD, Liu X, Krishnan M, Naylor S, Udseth HR, Smith RD, Clemmer DE. Toward plasma proteome profiling with ion mobility-mass spectrometry. J. Proteome Res. 2006;5:2977–2984. doi: 10.1021/pr060232i. [DOI] [PubMed] [Google Scholar]
- 22.Moon MH, Myung S, Plasencia M, Hilderbrand AE, Clemmer DE. Nanoflow LC/ion mobility/CID/TOF for proteomics: analysis of a human urinary Proteome. J. Proteome Res. 2003;2:589–597. doi: 10.1021/pr034018v. [DOI] [PubMed] [Google Scholar]
- 23.Liu X, Valentine SJ, Plasencia MD, Trimpin S, Naylor S, Clemmer DE. Mapping the human plasma proteome by SCX-LC-IMS-MS. J. Am. Soc. Mass Spectrom. 2007;18:1249–1264. doi: 10.1016/j.jasms.2007.04.012. [DOI] [PMC free article] [PubMed] [Google Scholar]
- 24.Liu X, Plasencia M, Ragg S, Valentine SJ, Clemmer DE. Development of High-Throughput Dispersive LC-Ion Mobility-TOF MS Techniques for Analyzing the Human Plasma Proteome. Brief Funct. Genomic Proteomic. 2004;3:177–186. doi: 10.1093/bfgp/3.2.177. [DOI] [PubMed] [Google Scholar]
- 25.Shen Y, Zhao R, Belov ME, Conrads TP, Anderson GA, Tang K, Pasa-Tolic L, Veenstra TD, Lipton MS, Udseth HR, Smith RD. Packed Capillary Reversed-Phase Liquid Chromatography with High-Performance Electrospray Ionization Fourier Transform Ion Cyclotron Resonance Mass Spectrometry for Proteomics. Anal. Chem. 2001;73:1766–1775. doi: 10.1021/ac0011336. [DOI] [PubMed] [Google Scholar]
- 26.Kelly RT, Page JS, Luo Q, Moore RJ, Orton DJ, Tang K, Smith RD. Chemically Etched Open Tubular and Monolithic Emitters for Nanoelectrospray Ionization Mass Spectrometry. Anal. Chem. 2006;78:7796–7801. doi: 10.1021/ac061133r. [DOI] [PMC free article] [PubMed] [Google Scholar]
- 27.Baker ES, Clowers BH, Li F, Tang K, Tolmachev AV, Prior DC, Belov ME, Smith RD. “Ion Mobility Spectrometry – Mass Spectrometry Performance Using Electrodynamic Ion Funnels and Elevated Drift Gas Pressures”. J. Am. Soc. Mass Spectrom. 2007;18:1176–1187. doi: 10.1016/j.jasms.2007.03.031. [DOI] [PMC free article] [PubMed] [Google Scholar]
- 28.Kim T, Tolmachev AV, Harkewicz R, Prior DC, Anderson GA, Udseth HR, Smith RD, Bailey TH, Rakov S, Futrell JH. Design and Implementation of a New Electrodynamic Ion Funnel. Anal. Chem. 2000;72:2247–2255. doi: 10.1021/ac991412x. [DOI] [PubMed] [Google Scholar]
- 29.Tang K, Shvartsburg AA, Lee HN, Prior DC, Buschbach MA, Li FM, Tolmachev AV, Anderson GA, Smith RD. High-Sensitivity Ion Mobility Spectrometry/Mass Spectrometry Using Electrodynamic Ion Funnel Interfaces. Anal. Chem. 2005;77:3330–3339. doi: 10.1021/ac048315a. [DOI] [PMC free article] [PubMed] [Google Scholar]
- 30.Matuszewski BK, Constanzer ML, Chavez-Eng CM. Matrix Effect in Quantitative LC/MS/MS Analyses of Biological Fluids: A Method for Determination of Finasteride in Human Plasma at Picogram Per Milliliter Concentrations. Anal. Chem. 1998;70:882–889. doi: 10.1021/ac971078+. [DOI] [PubMed] [Google Scholar]
- 31.Matuszewski BK, Constanzer ML, Chavez-Eng CM. Strategies for the Assessment of Matrix Effect in Quantitative Bioanalytical Methods Based on HPLC-MS/MS. Anal Chem. 2003;75:3019–3030. doi: 10.1021/ac020361s. [DOI] [PubMed] [Google Scholar]
- 32.Schwartz JC, Zhou X-G, Bier ME. Method and apparatus of increasing dynamic range and sensitivity of a mass spectrometer. US Patent. 5,572,022. 1996
- 33.Belov ME, Zhang R, Strittmatter EF, Prior DC, Tang K, Smith RD. Automated Gain Control and Internal Calibration with External Ion Accumulation Capillary Liquid Chromatography-Electrospray Ionization-Fourier Transform Ion Cyclotron Resonance. Anal Chem. 2003;75:4195–4205. doi: 10.1021/ac0206770. [DOI] [PubMed] [Google Scholar]
- 34.Ibrahim YM, Belov ME, Tolmachev AV, Prior DC, Smith RD. Ion Funnel Trap Interface for Orthogonal Time-of-Flight Mass Spectrometry. Anal. Chem. 2007;79:7845–7852. doi: 10.1021/ac071091m. [DOI] [PMC free article] [PubMed] [Google Scholar]
- 35.Clowers BH, Ibrahim YM, Prior DC, Danielson WF, Belov ME, Smith RD. Enhanced Ion Utilization Efficiency Using an Electrodynamic Ion Funnel Trap as an Injection Mechanism for Ion Mobility Spectrometry. Anal. Chem. 2008;80:612–623. doi: 10.1021/ac701648p. [DOI] [PMC free article] [PubMed] [Google Scholar]
- 36.Metz T, Page JS, Baker ES, Tang K, Ding J, Shen Y, Smith RD. High Resolution Separations and Improved Ion Production and Transmission in Metabolomics. Trends Anal Chem. 2008;27:205–214. doi: 10.1016/j.trac.2007.11.003. [DOI] [PMC free article] [PubMed] [Google Scholar]
- 37.McLean JA, Ridenour WB, Caprioli RM. Profiling and imaging of tissues by imaging ion mobility-mass spectrometry. J. Mass Spectrom. 2007;42:1099–1105. doi: 10.1002/jms.1254. [DOI] [PubMed] [Google Scholar]
- 38.Zimmer JD, Monroe ME, Qian WJ, Smith RD. Advances in Proteomics Data Analysis and Display Using an Accurate Mass and Time Tag Approach. Mass Spectrometry Reviews. 2006;25:450–482. doi: 10.1002/mas.20071. [DOI] [PMC free article] [PubMed] [Google Scholar]
- 39.Jaitly N, Monroe ME, Tolic N, Littlefield K, Daly DS, Adkins JN, Anderson GA, Smith RD. Open source tools for the accurate mass and time (AMT) tag proteomics pipeline. Presented at 54th ASMS Conference on Mass Spectrometry; Seattle, WA; Available at: http://ncrr.pnl.gov/posters/ASMS2006.stm. [Google Scholar]


