Abstract
In several recent studies, antenna-based optical microscopy (e.g. TENOM) has demonstrated its potential to resolve features as small as 10nm. Most studies are concerned with well-separated features on flat surfaces and there are only few studies that deal with samples of high feature density or even three-dimesional objects. The reason is that the external laser irradiation of the optical antenna (e.g. tip or particle) also directly irradiates the sample and therefore gives rise to a background. Here we introduce an efficient background suppression scheme that makes use of feedback modulation. The method is widely applicable and not restricted to cantilever-based scanning schemes. We apply this technique to both dense samples of dye molecules and ion channel proteins in plasma membranes and demonstrate effective background suppression and strongly improved sensitivity. The feedback modulation scheme is expected to find application for biological studies in liquid environments and for investigations of subsurface features in material science.
Optical antennas enhance the local light-matter interaction and boost the sensitivity of optical detection and sensing.1–6 For example, antenna-based optical microscopy, such as tip-enhanced near-field optical microscopy (TENOM), have been employed to improve the sensitivity and spatial resolution of single molecule fluorescence measurements.4,7–11 These techniques were recently applied for high-resolution imaging of DNA,7,12 localized excitons in carbon nanotubes,13 and single channel proteins in biological membranes.14
A major challenge in antenna-based microscopy is that the external laser field used to excite the antenna also irradiates the sample directly. This direct irradiation of the sample leads to a background signal and limits the signal-to-noise ratio (SNR) of the measurement. For samples of high abundance and samples with strong intensity variations, such as in biological systems, the weak near-field signal completely disappears in the background and can no longer be measured. Different approaches to limit this problem have been laid out, such as excitation through confined apertures4,7 or cantilever-based tip-sample distance modulation.15 Here, we demonstrate a novel background suppression method that makes use of feedback modulation. Because all scanning probe microscopes employ a feedback loop to regulate the tip-sample distance, our method is widely applicable and not limited to cantilever-based systems. We demonstrate that the method makes it possible to resolve single proteins in biological membranes and to drastically improve the signal-to-noise ratio and image quality.
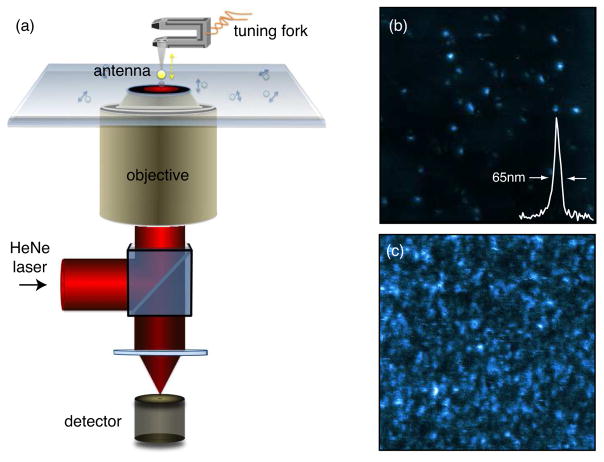
In our experiments we employ optical antennas formed by a single spherical gold nanoparticle attached to a sharply pointed glass tip (c.f. Fig. 1a) illuminated by an on-axis radially polarized He-Ne laser beam. The optical properties of such a particle antenna have been extensively studied on the single molecule level.9–11,16 The maximum fluorescence enhancement obtained with an ~80 nm spherical gold particle for a single dye molecule is on the order of 8, and is achieved for a particle-molecule separation of 5–10 nm. The latter is controlled with Angstrom accuracy by a feedback loop employing a quartz tuning fork17 operated in tapping-mode (c.f. Fig. 1a). The feedback loop tracks the resonance frequency of the tuning-fork due to tip-sample distance variations relative to a preset value.18 As shown in Fig. 1b, the optical resolution of ≈65 nm is defined by the particle size and can be improved by more favorable antenna geometries, such as bow-tie antennas,19 half-wave antennas,6 or quarter-wave antennas.4
Figure 1.
(a) Schematic of the near-field instrument employing a 80nm gold nanoparticle antenna to enhance the fluorescence of single molecules. (b) Near-field image of a low-concentration sample showing clearly resolved single molecules and low background fluorescence. (c) Near-field fluorescence image of a dense sample of single molecules exhibiting a high background fluorescence level.
Evidently, the density of molecules in Fig. 1b is very low and background fluorescence due to direct laser excitation of the molecules is not an issue. However, when the density of molecules increases, the signal-to-noise decreases and it becomes difficult to discern individual molecules from the background. In the following we will describe an experimental approach to suppress the fluorescence background and to drastically improve the sensitivity when measuring samples with dense concentration of molecules. It has to be emphasized, that the approach presented here is not limited to fluorescence but can be readily adapted to other light-matter interactions, such as Raman scattering, Rayleigh scattering, or nonlinear spectroscopies.
The objective of tip-sample modulation techniques is to reject photons that do not originate from the near-field interaction between tip and sample. At the largest tip-sample distance, the signal comprises the separate contributions of sample and tip because the mutual interaction is negligible. On the other hand, at shortest tip-sample distance, the signal is dominated by the tip-sample interaction. For scattering-type near-field microscopy it was shown that a high degree of background rejection is achieved by demodulating the optical signal at higher harmonics of the tip-sample modulation frequency.20,21 However, this method relies on strong signal levels and is not applicable to single molecule studies based on single-photon detection. Recently, background rejection schemes have been introduced that are applicable to single molecule fluorescence.8,22,23 Similar to light-scattering based methods the tip-sample distance is modulated by use of a soft AFM cantilever. In one approach, the detected fluorescence photons are time-stamped relative to the oscillating tip-sample distance and photons outside a predefined time-window are rejected.8 In a similar approach, a dual time-gated photon counting scheme was applied to eliminate the confocal background, by triggering the two gates with the tip oscillation.22 In essence, both techniques rely on a selective detection of photons falling into predefined time windows that are associated with different tip-sample distances. In a third approach, the near-field contribution has been extracted from the modulated optical signal by demodulation with a lock-in amplifier using the tip oscillation as a reference signal.23
So far, all background rejection schemes were based on regular AFM cantilever probes operated in an intermittent-mode (tapping mode). The reason is that efficient background rejection requires large tip-sample oscillation amplitudes (> 10 nm), which in turn require low spring constants in order not to exceed damage limits. The background rejection schemes developed so far cannot be transferred to systems that do not use AFM cantilevers, for example systems based on tuning-forks or measurements of tunneling currents. The considerably higher stiffness of a tuning fork hinders the direct excitation of tip-sample oscillations with amplitudes of 10 nm or larger. Here, we overcome this limitation by introducing a background rejection scheme that relies on modulation of the feedback loop. We discuss this technique in terms of its ability to efficiently suppress the confocal background signal in dense samples of randomly distributed single molecules, its impact on the ascertainable signal enhancement and optical resolution, and demonstrate its applicability for membrane-protein imaging in membrane layers.
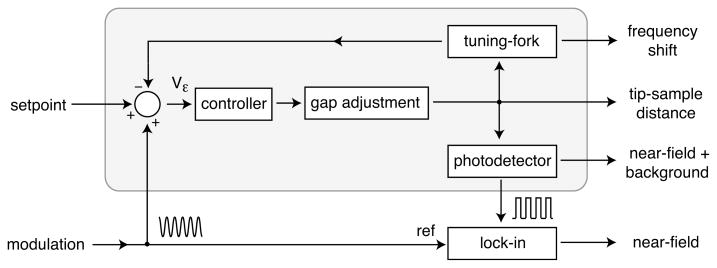
The principle of our background rejection scheme is illustrated in Fig. 2. The tip-sample interaction force is sensed by a quartz tuning-fork,17 which is mechanically driven at its natural frequency ω using a combination of a voltage-controlled oscillator (VCO) and a phase-locked loop (PLL). The natural frequency is a function of tip-sample distance d, which is adjusted by a piezoelectric tube supporting the tuning-fork. For large distances, ω (d → ∞) =~2π 32.7 kHz. The tip-sample interaction shifts ω monotonically to higher frequencies. The frequency shift can be calibrated against the distance d and is used to maintain a preset distance dset by means of a feedback loop.
Figure 2.
Diagram of the feedback modulation principle. A sinusoidal modulation (10–100 Hz) is added to the feedback loop resulting in a modulation of the tip-sample distance. The periodically varying tip-sample distance modulates the photon count rate, which contains both near-field photons and background photons. To reject the background the photons are demodulated by a lock-in amplifier. The shaded area corresponds to a standard feedback feedback system. The setpoint defines the operating frequency ωo of the tuning-fork. The actual resonance frequency ω depends on the tip-sample distance d and is sensed with a tuning-fork.
For the purpose of background rejection we introduce an external modulation of the tuning-fork’s frequency ω. As illustrated in Fig. 2, the external modulation leads to an indirect modulation (via the feedback loop) of the tip-sample distance. In essence, the feedback loop modulation feigns a periodically varying tip-sample interaction force and the system reacts with a modulation of the tip-sample separation, which in turn leads to a modulation of the optical signal, such as the fluorescence photon count rate.
To reject background fluorescence we demodulate the optical signal with a lock-in amplifier using the original feedback modulation as a reference. The demodulated signal is primarily composed of the real near-field signal, but it also contains a weak photoluminescence background originating from the gold nanoparticle antenna. Notice that in our implementation the lock-in amplifier does not receive an analog signal but discrete voltage pulses from a single-photon counting photodetector.23
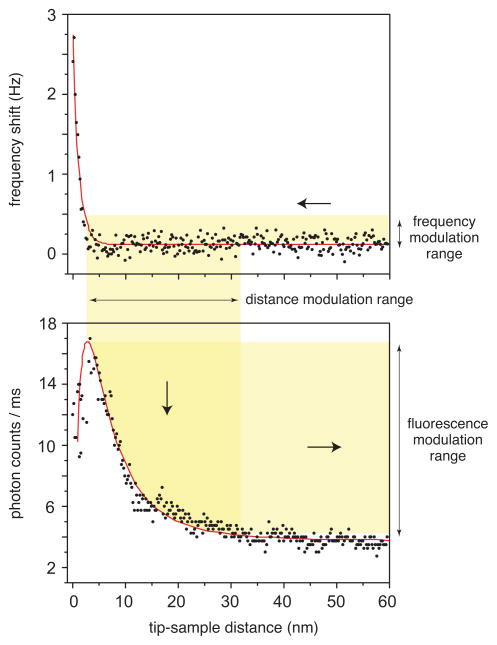
To determine the modulation range for efficient background suppression we center a gold nanoparticle antenna over a vertically aligned dye molecule and record the fluorescence rate as a function of antenna-molecule distance. The recorded approach curve is shown together with the measured resonance frequency shift in Fig. 3, and reflects the strong distance dependence of the fluorescence signal. It becomes apparent, that the optical antenna affects the fluorescence emission rate of the molecule over a distance of ~50 nm, even though the strongest increase in the fluorescence enhancement is observed only within the last 15 nm. As show in Fig. 3, a static working distance of dmin ≈ 5 nm ensures that fluorescence quenching is not significant.10 The feedback modulation scheme periodically changes the set point of the tuning-fork’s resonance frequency and gives rise to a modulation of the tip-sample distance d of Δd ≈ 30 .. 50 nm (c.f. Fig. 3). The distance modulation leads to a modulation of the photon count rate, which is then demodulated using a lock-in amplifier or photon time-stamping.
Figure 3.
Feedback modulation affecting the count-rate of single molecule fluorescence. Both figures are distance dependent approach curves on top of a single molecule. The top curve shows the frequency shift of the tuning-fork resonance and the bottom curve shows the fluorescence rate of the molecule. The minimum tip-sample distance is adjusted to ~ 5 nm, - an offset that limits fluorescence quenching. The shaded areas indicate the modulation ranges: feedback modulation directly modulates the tuning-fork frequency and causes a periodic modulation of the tip-sample separation, which in turn gives rise to a modulation of the fluorescence count rate.
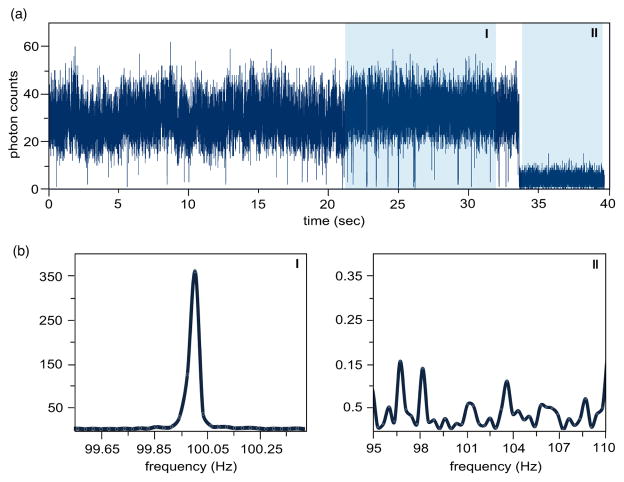
To demonstrate the effect of feedback-modulation on the recorded photon counts we activated feedback modulation, positioned the gold nanoparticle antenna over a single dye molecule, and recorded the arrival times of the detected fluorescence photons. Because the feedback is modulated at a low frequency (100 Hz), time-stamping can be implemented with a single photon detector and a cw-laser. Fig. 4a depicts a typical fluorescence trajectory, which clearly shows a one-step bleaching of the fluorescence signal. Although the time-stamped data have been binned to 1 ms, the trajectory does not reveal clear evidence of a modulated fluorescence signal. Therefore, we evaluate the power spectra of the fluorescence traces before and after photobleaching of the molecule (see shaded areas in Fig. 4a). Before photobleaching the time trace corresponds to the modulated near-field signal superimposed to background fluorescence, whereas after photobleaching the time trace accounts only for the background. Since the latter is not altered by the modulation of the tip-sample separation, the power spectrum does not show any correlation with the modulation frequency (see Fig. 4b). In contrast the power spectrum before photobleaching shows clearly a peak at the modulation frequency of 100 Hz, and thus, provides clear evidence for periodic alteration in the optical response due to feedback modulation.
Figure 4.
(a) Fluorescence trajectory of a vertically oriented molecule recorded in the feedback-modulation mode. The antenna-sample separation was modulated over a range of ~50nm at a frequency of 100 Hz. The time trace shows one-step photobleaching in accordance with a single molecule underneath the optical antenna. (b) Power spectra of regions I (before photobleaching) and II (after photobleaching) highlighted in the time trace (a). The fluorescence modulation peak at 100Hz is only visible in the photoactive state of the molecule.
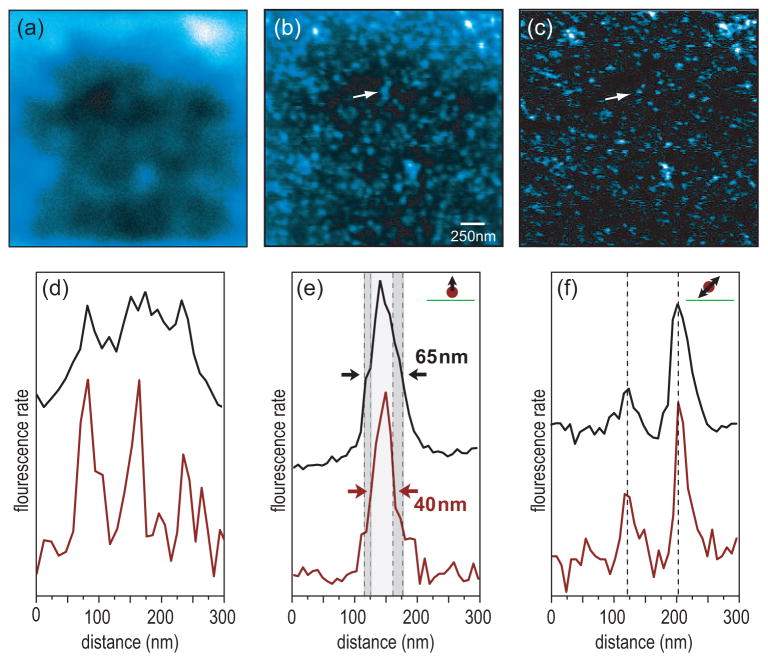
To demonstrate the signal-to-noise advantage of the feedback-modulation technique we imaged layers of Alexa 633 molecules of variable density. The results shown in Fig. 5 were acquired for a density of η ~60 molecules/μm2. As shown in Fig. 5a, at this density the molecules cannot be resolved by confocal microscopy (absence of antenna). Using the antenna effect of an 80 nm gold nanoparticle we are able to resolve the molecules (c.f. Fig. 5b) but the signal-to-noise ratio is low due to the fluorescent background. Fig. 5c shows the same near-field image but now with feedback modulation activated. The modulation technique entirely removes the confocal fluorescence background and drastically improves the signal-to-noise ratio. Individual molecules become clearly resolved and the average nearest-neighbor distance can be determined to be 60–70 nm. Figure 5d displays cross sections through the three spots indicated by arrows in (b,c). The three patterns can clearly be separated only in the image acquired with feedback modulation, which demonstrates that background suppression not only increases the signal-to-noise but also improves the resolution. The improvement of image quality is also evidenced by a narrower full-width-at-the-half maximum (FWHM) of the optical signals as shown in Figs. 5e,f. These cross-sections are taken from the fluorescence patterns of single molecules with different transition dipole orientations (c.f. Fig. 1b). Due to the illumination with a radially polarized laser beam, out off-plane (vertical) molecules appear as a single spot, while in-plane molecules exhibit a double-lobe pattern.24 For the molecule shown in Fig. 5e feedback modulation yields a narrowing of the peak width. The same accounts for the molecule shown in Fig. 5f. Nonetheless, the distance between the two peaks remains the same and reflects the size of the optical antenna.
Figure 5.
Comparative study of single molecule fluorescence from a sample of Alexa 633 with a density of η ~60 molecules/μm2. (a) Confocal image, (b) Near-field image acquired with a 80 nm gold nanoparticle antenna and no feedback modulation, (c) Near-field image with feedback modulation (amplitude ~ 50 nm and frequency = 100 Hz). Feedback modulation rejects background fluorescence and improves the signal-to-noise ratio. (d) Cross-sections through the three spots indicated by arrows in (b,c). Adjacent fluorescence spots become well resolved in the feedback-modulated image. (e,f) Cross-sections through the fluorescence patterns of a vertically oriented molecule and an in-plane molecule, respectively, demonstrating the linewidth narrowing obtained by feedback modulation.
In the following we analyze more quantitatively the signal-to-noise improvement obtained by feedback modulation. In our measurements we observe a constant background even in the absence of background fluorescence from the sample. This background signal (Ilum) originates from the luminescence of the gold nanoparticle antenna25 and defines a limit for the achievable signal-to-noise ratio (SNR). Taking also into account the detector noise Idet we can represent the SNR as
| (1) |
where Inf is the near-field signal and Iff the far-field fluorescence background due to direct sample illumination. Feedback modulation removes Iff and the relative SNR enhancement becomes
| (2) |
where we dropped Idet because it is typically much smaller than the luminescence background Ilum. Ilum is roughly independent of the sample properties whereas Iff depends on the density η and the detection area Adet. In case of a three-dimensional sample, η needs to be replaced by the volume density and Adet by the detection volume. Obviously, the larger the initial density and detection area (volume) the larger the SNR enhancement will be. Notice that Iff and Ilum both scale linearly with the illumination power.
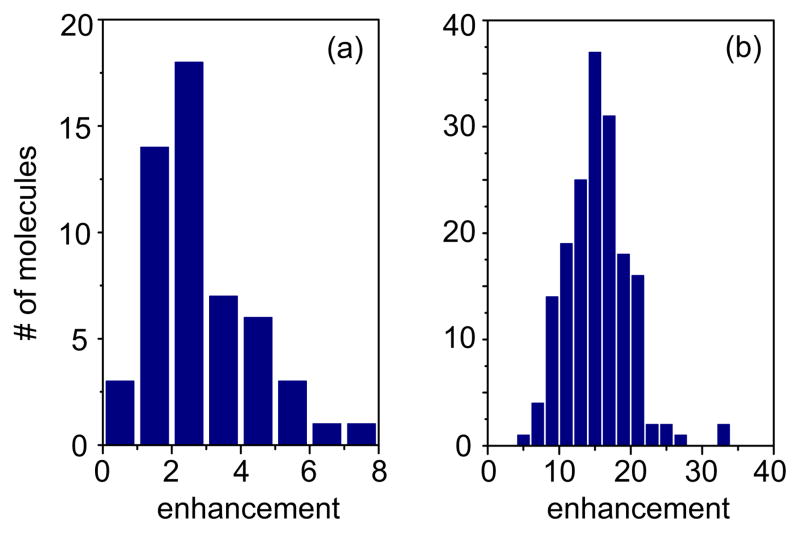
The SNR enhancement fSNR implies that feedback modulation improves the near-field fluorescence enhancement. In other words, the ratio between the fluorescence levels recorded with and without an optical antenna can be increased with feedback modulation. To demonstrate this effect we performed measurements on samples with different dye densities. The results for the densest sample (η ~ 60 dyes/μm2) are summarized in Fig. 6, which shows the distribution of fluorescence enhancements obtained for many different single molecules. Without feedback modulation the average fluorescence enhancement is only 2–3 (Fig. 6a). Repeating the measurements on the same sample but with feedback modulation activated yields an average fluorescence enhancement factor of 15, which is a clear improvement over the unmodulated near-field fluorescence enhancement.
Figure 6.
Analysis of single molecule fluorescence enhancement factors on a sample with density of η ~60 molecules/μm2. (a) Distribution of enhancement factors obtained when no feedback modulation is used, and (b) distribution obtained with feedback modulation. Feedback modulation improves the average fluorescence enhancement by a factor of ~ 6.
The histograms shown in Fig. 6 reflect a broad distribution of enhancement factors, which is caused by the diversity of molecular dipole orientations. Previous studies on low-density samples revealed higher enhancement factors for molecules with out-of-plane (vertical) dipole orientations and weaker enhancement factors for in-plane (horizontal) molecules.11 The histogram shown in Fig. 6b turns out to be invariant to variations in the molecule density, which demonstrates the efficiency of the feedback modulation technique and its capability to completely suppress the farfield fluorescence background in near-field optical imaging.
To demonstrate that our feedback modulation technique also works with more complex samples we applied the technique to map out membrane proteins in erythrocyte cell membranes. The nanoscale imaging of biological samples, such as intact cells, is one of the most promising applications of near-field microscopy,26 and recently, antenna-based microscopy was used to image fluorescently labeled membrane proteins in their native environment.14 These studies are challenged not only by the abundance of membrane proteins, but also by autofluorescence arising from lipids and other biomolecules, and from a lower signal enhancement due to the liquid environment. Background fluorescence suppression is therefore of critical importance.
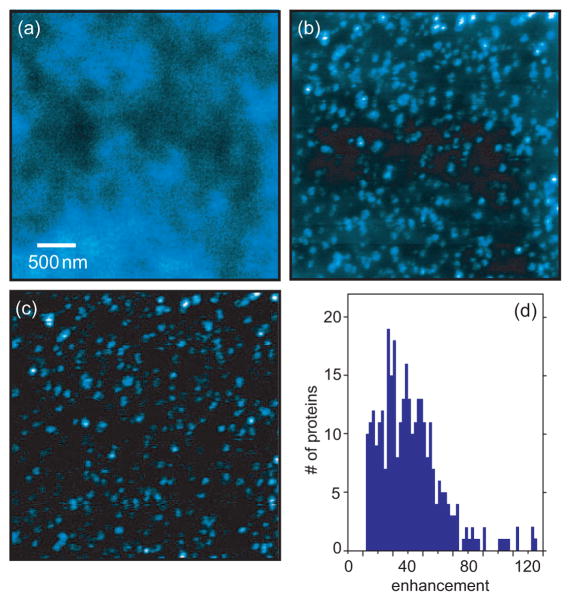
Here we use a gold nanoparticle antenna in combination with feedback modulation to map out the distribution of individual Ca2+ proteins in isolated plasma membrane layers. Ca2+ ATPases (PMCA1) of erythrocytes were labeled specifically against a cytoplasmic epitope binding site using monoclonal antibodies.27 The confocal fluorescence image shown in in Fig. 7a indicates that the high protein density prevents individual proteins to be resolved with diffraction-limited resolution. On the other hand, when imaging the same sample area with an optical antenna we are able to recognize individual Ca2+ ATPases as isolated fluorescence spots (c.f. Figs. 7b,c). However, without feedback modulation the near-field image is characterized by a strong confocal background. The density of fluorescence spots is on the order of 60 proteins/μm2, and thus comparable to the density of the single molecule samples analyzed in Fig. 6b. Because of the strong fluorescence background it is not possible to clearly resolve closely-spaced proteins. On the other hand, once feedback modulation is employed, the SNR improves drastically and individual molecules can be clearly identified (c.f. Fig. 7c).
Figure 7.
Images of calcium channel proteins in isolated plasma membranes of red blood cells. Single Ca2+ ATPase proteins are specifically labeled against fluorescent antibodies. (a) Confocal fluorescence image. The limited resolution prevents the identification of individual proteins. (b) Same membrane region imaged with a gold nanoparticle antenna but without feedback modulation. Membrane proteins can be resolved but the fluorescence background leads to poor signal-to-noise and hinders the clear identification of weakly labeled proteins. (c) Near-field fluorescence image using feedback modulation. The efficient background suppression leads to much higher signal enhancement and image contrast. (d) Histogram of near-field fluorescence enhancement factors in (c). The broad distribution originates from different numbers of molecules per proteins and variations in dipole orientations.
The most evident feature of feedback modulation is the high dynamic range in the recorded images. For each fluorescence spot in the recorded image shown in Fig. 7c we determined the fluorescence enhancement (ratio between count rates obtained with and without optical antenna) and plotted the values in a histogram (c.f. Fig 7d). We find a rather broad distribution of enhancement factors ranging form 10 to 125. While the general shape of the distribution is similar to the one obtained for isolated dye molecules (Fig. 6) the magnitude of the enhancement factors is considerably higher for single proteins. The origin for the higher enhancement is mutliple labeling, i.e. most proteins are labeled by more than one fluorescent molecule. The large fluorescence enhancements and high image contrasts that we observe on isolated plasma membrane layers indicate that feedback modulation is an effective means for optical bioimaging on the nanoscale.
The detection of weak signal by means of antenna-based near-field microscopy has been challenged by the background generated by external illumination. Thus, the ascertainable signal enhancement depends strongly on the object density and the signal strength. Here we demonstrated that the background can be effectively suppressed by periodically altering the feedback signal, and demodulating the detected photons with a lock-in amplifier. Feedback modulation suppresses the background and leads to improved signal-to-noise and image contrast. Application of this feedback-modulation scheme to a single membrane layer, enabled us to entirely remove the fluorescence background and to clearly identify individual Ca2+ membrane proteins. The background rejection scheme introduced here is most promising for investigations of intact cells and samples of high abundance. In terms of cell imaging this technique is able to eliminate not only the background due to fluorescent antibodies, but also the background originating from cellular autofluorescence. It can be expected that this technique will find wide applicability for studies in liquid environments and investigations of structures buried underneath the sample surface. Although we focused here exclusively on fluorescence studies, this technique can be also used in connection with other spectroscopic interactions, e.g. Raman scattering or infrared absorption. Thus, this technique might also find wide applications in the field of material science.
Acknowledgments
The authors like to acknowledge valuable input form Bradley Deutsch, Palash Bharadwaj and John Lesoine. This work was supported by the NIH (grant EB004588) and AFOSR (grant F-49620-03-1-0379, MURI).
References
- 1.Crozier KB, Sundaramurthy A, Kino GS, Quate CF. J Appl Phys. 2003;94:4632–4642. [Google Scholar]
- 2.Mühlschlegel P, Eisler HJ, Martin OJF, Hecht B, Pohl DW. Science. 2005;308:1607. doi: 10.1126/science.1111886. [DOI] [PubMed] [Google Scholar]
- 3.Schuck P, Fromm DP, Sundaramurthy A, Kino GS, Moerner WE. Phys Rev Lett. 2005;94:017402. doi: 10.1103/PhysRevLett.94.017402. [DOI] [PubMed] [Google Scholar]
- 4.Taminiau TH, et al. Nano Lett. 2007;7:28. doi: 10.1021/nl061726h. [DOI] [PubMed] [Google Scholar]
- 5.Ghenuche P, Cherukulappurath S, Taminiau TH, van Hulst NF, Quidant R. Phys Rev Lett. 2008;101:116805. doi: 10.1103/PhysRevLett.101.116805. [DOI] [PubMed] [Google Scholar]
- 6.Novotny L. Nature. 2008;455:879. [Google Scholar]
- 7.Frey HG, Witt S, Felderer K, Guckenberger R. Phys Rev Lett. 2004;93:200801. doi: 10.1103/PhysRevLett.93.200801. [DOI] [PubMed] [Google Scholar]
- 8.Gerton JM, Wade LA, Lessard GA, Ma Z, Quake SR. Phys Rev Lett. 2004;93:180801. doi: 10.1103/PhysRevLett.93.180801. [DOI] [PubMed] [Google Scholar]
- 9.Kühn S, Hakanson U, Rogobete L, Sandoghdar V. Phys Rev Lett. 2006;97:017402. doi: 10.1103/PhysRevLett.97.017402. [DOI] [PubMed] [Google Scholar]
- 10.Anger P, Bharadwaj P, Novotny L. Phys Rev Lett. 2006;96:113002. doi: 10.1103/PhysRevLett.96.113002. [DOI] [PubMed] [Google Scholar]
- 11.Bharadwaj P, Novotny L. Opt Expr. 2007;15:14266–14274. doi: 10.1364/oe.15.014266. [DOI] [PubMed] [Google Scholar]
- 12.Ma Z, Gerton JM, Wade LA, Quake SR. Phys Rev Lett. 2006;97:260801. doi: 10.1103/PhysRevLett.97.260801. [DOI] [PubMed] [Google Scholar]
- 13.Anderson N, Bouhelier A, Hartschuh A, Novotny L. J Opt A: Pure Appl Opt. 2006;8:S227–S233. [Google Scholar]
- 14.Hoeppener C, Novotny L. Nano Lett. 2008;8:642–646. doi: 10.1021/nl073057t. [DOI] [PubMed] [Google Scholar]
- 15.Mangum BD, Mu C, Gerton JM. Opt Expr. 2008;16:6183–6193. doi: 10.1364/oe.16.006183. [DOI] [PubMed] [Google Scholar]
- 16.Bharadwaj P, Anger P, Novotny L. Nanotechnology. 2007;18:044017. [Google Scholar]
- 17.Karrai K, Grober RD. Appl Phys Lett. 1995;66:1842–1844. [Google Scholar]
- 18.Albrecht TR, Grütter P, Horne D, Rugar D. J Appl Phys. 1991;69:668. [Google Scholar]
- 19.Farahani JN, Pohl DW, Eisler HJ, Hecht B. Phys Rev Lett. 2005;95:017402. doi: 10.1103/PhysRevLett.95.017402. [DOI] [PubMed] [Google Scholar]
- 20.Hillenbrand R, Stark M, Guckenberger R. Appl Phys Lett. 2000;76:3478–3480. [Google Scholar]
- 21.Novotny L, Stranick SJ. Ann Rev Phys Chem. 2006;57:303–331. doi: 10.1146/annurev.physchem.56.092503.141236. [DOI] [PubMed] [Google Scholar]
- 22.Yano T, Ichimura T, Taguchi A, Hayazawa N, Verma P, Inouye Y, Kawata S. Appl Phys Lett. 2007;91:1211011. [Google Scholar]
- 23.Xie C, Mu C, Cox JR, Gerton JM. Appl Phys Lett. 2006;89:143117. [Google Scholar]
- 24.Novotny L, Beversluis MR, Youngworth KS, Brown TG. Phys Rev Lett. 2001;86:5251. doi: 10.1103/PhysRevLett.86.5251. [DOI] [PubMed] [Google Scholar]
- 25.Beversluis MR, Bouhelier A, Novotny L. Phys Rev B. 2003;68:115433. doi: 10.1103/PhysRevLett.90.013903. [DOI] [PubMed] [Google Scholar]
- 26.Garcia-Parajo MF. Nat Phot. 2008;2:201–203. [Google Scholar]
- 27.Hoeppener C, Novotny L. Nanotechnology. 2008;19:384012. doi: 10.1088/0957-4484/19/38/384012. [DOI] [PubMed] [Google Scholar]


