Abstract
We investigate the molecular mechanism of how an E. coli cell with the lac operon switches from one phenotype to another by monitoring fluorescently labeled lactose permease with single-molecule sensitivity. At intermediate inducer concentrations, a population of genetically identical cells exhibits two phenotypes: induced cells with highly fluorescent membranes and uninduced cells with a small number of membrane-bound permeases. We find that this basal level expression results from partial dissociation of the tetrameric lactose repressor from one of its operators on looped DNA. In contrast, infrequent events of complete dissociation of the repressor from DNA result in large bursts of permease expression that trigger induction of the lac operon. Hence, a stochastic, single molecular event determines a cell’s phenotype.
Genetically identical cells in the same environment can exhibit different phenotypes, and a single cell can switch between distinct phenotypes in a stochastic manner (1–4). In the classic example of lactose metabolism in E. coli, the lac genes are fully expressed for every cell in a population under high extracellular concentrations of inducers, such as the lactose analog methyl-β-D-thiogalactoside (TMG). However, at moderate inducer concentrations, the lac genes are highly expressed in only a fraction of a population, which may confer a fitness advantage for the entire population (5). Here we study the molecular mechanism that controls the stochastic phenotype switching of a single cell.
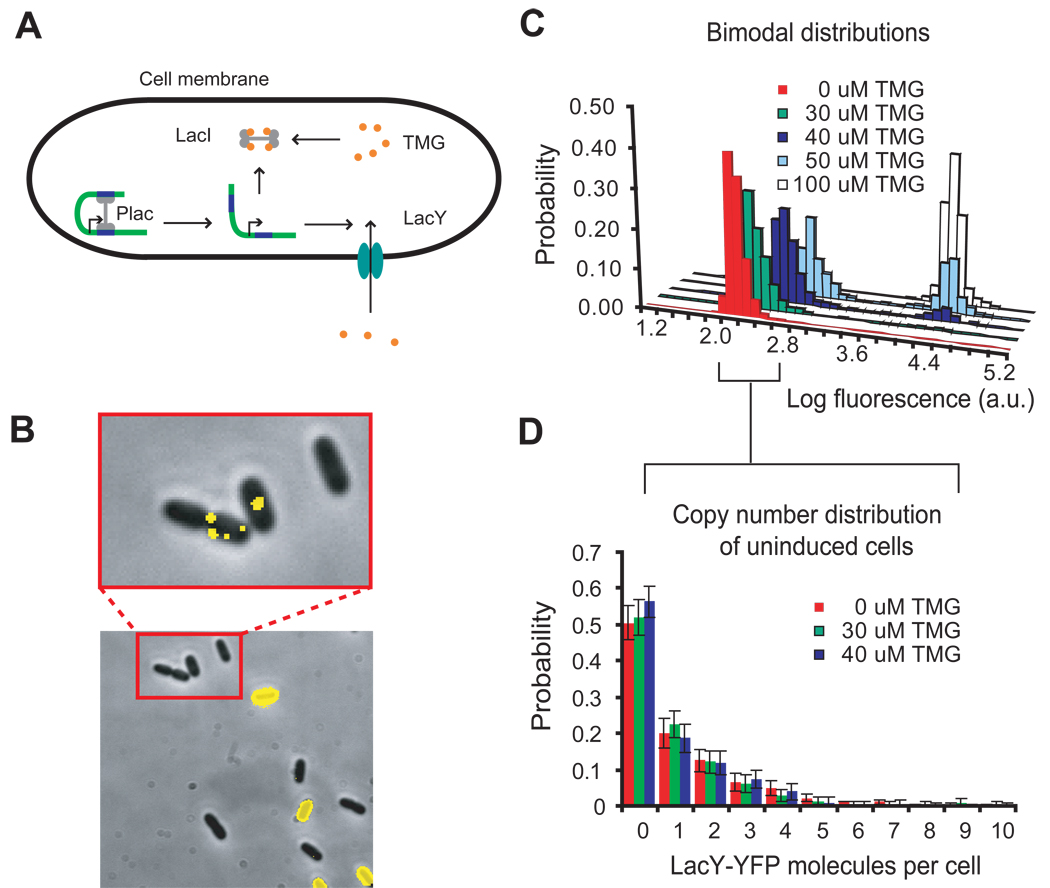
Lactose metabolism is controlled by the lac operon (6, 7), which consists of the lacZ, lacY, and lacA genes encoding beta-galactosidase, lactose permease, and transacetylase, respectively. Expression of the operon is regulated by a transcription factor, the lac repressor (8), which dissociates from its specific binding sequences of DNA, the lac operators, in the presence of inducer to allow transcription (Fig. 1A). The production of the permease increases inducer influx (9), resulting in positive feedback on permease expression level. Above a certain threshold of permease numbers, a cell will be in a phenotype capable of lactose metabolism, and below this threshold, a cell will be in a phenotype incapable of lactose metabolism (10, 11). The former has high fluorescence from the cell membrane, whereas the latter has low fluorescence, when the permease is labeled with a yellow fluorescent protein (YFP). The image in Figure 1B shows the coexistence of both phenotypes in a cell population at intermediate inducer concentrations, characterized by the bimodal distributions of fluorescence intensity in Figure 1C.
Figure 1.
The expression of lactose permease in E. coli. (A) The repressor LacI and permease LacY form a positive feedback loop. Expression of permease increases the intracellular concentration of the inducer, TMG, which causes dissociation of LacI from the promoter, leading to even more expression of permeases. Cells with a sufficient number of permeases will quickly reach a state of full induction, while cells with too few permeases will stay uninduced. (B) After 24 hours in M9 media containing 30 µM TMG, strain SX700 expressing a LacY-YFP fusion exhibits all-or-none fluorescence in a fluorescence-phase contrast overlay. Fluorescence imaging with high sensitivity reveals single molecules of permease in the uninduced cells zoomed in on the red box from B. (C) After one day of continuous growth in media containing 0 to 50 µM TMG, the resulting bimodal fluorescence distributions show that a fraction of the population exists either in an uninduced or induced state, with the relative fractions depending on the TMG concentration. (D) The distributions of LacY-YFP molecules in the uninduced fraction of the bimodal population at different TMG concentrations, measured with single-molecule sensitivity, indicate that one permease molecule is not enough to induce the lac operon, as previously hypothesized (12). Over 100 cells were analyzed at each concentration. Error bars are standard errors determined by bootstrapping.
While it is known that the bistability in the lac operon arises from positive feedback (12, 13), the molecular mechanism underlying the initiation of switching between two phenotypes remains unclear. Novick and Weiner deduced that switching from the uninduced state to the induced state occurs through a single rate-limiting molecular process (12) rather than a multi-step process. They further hypothesized that the random expression of one molecule of permease was enough to trigger induction. However, this has never been observed experimentally because of insufficient sensitivity.
Our group has shown previously that a single fluorescent protein molecule can be visualized in a living bacterial cell using the method of detection by localization (14–16). Because a permease molecule is a membrane protein with slow diffusion, its fluorescence label is highly localized compared to a fluorescent protein in the cytoplasm, allowing detection above the background of cellular autofluorescence. Thus, we generated strain SX700, which possesses intact lac promoter elements and expresses a functional LacY-YFP fusion protein (Fig. S1) from lacY’s native chromosomal position (Fig. S2). Figure 1B shows a fluorescence image of SX700 cells that allows us to directly count the number of single LacY-YFP molecules present in a cell.
Figure 1D shows the histogram of permease copy numbers in the uninduced fraction of cells, free from the complication of autofluorescence background in the lower peak of Figure 1C. Evidently, the uninduced cells have zero to ten LacY molecules with significant probability, independent of the inducer concentration. Had one permease been enough to trigger induction, we would have seen that all cells in the uninduced subpopulation would possess zero LacY molecules. Thus, we conclude that a single copy of LacY is not sufficient to induce switching of the phenotype, and the threshold for induction must be much higher than several molecules per cell.
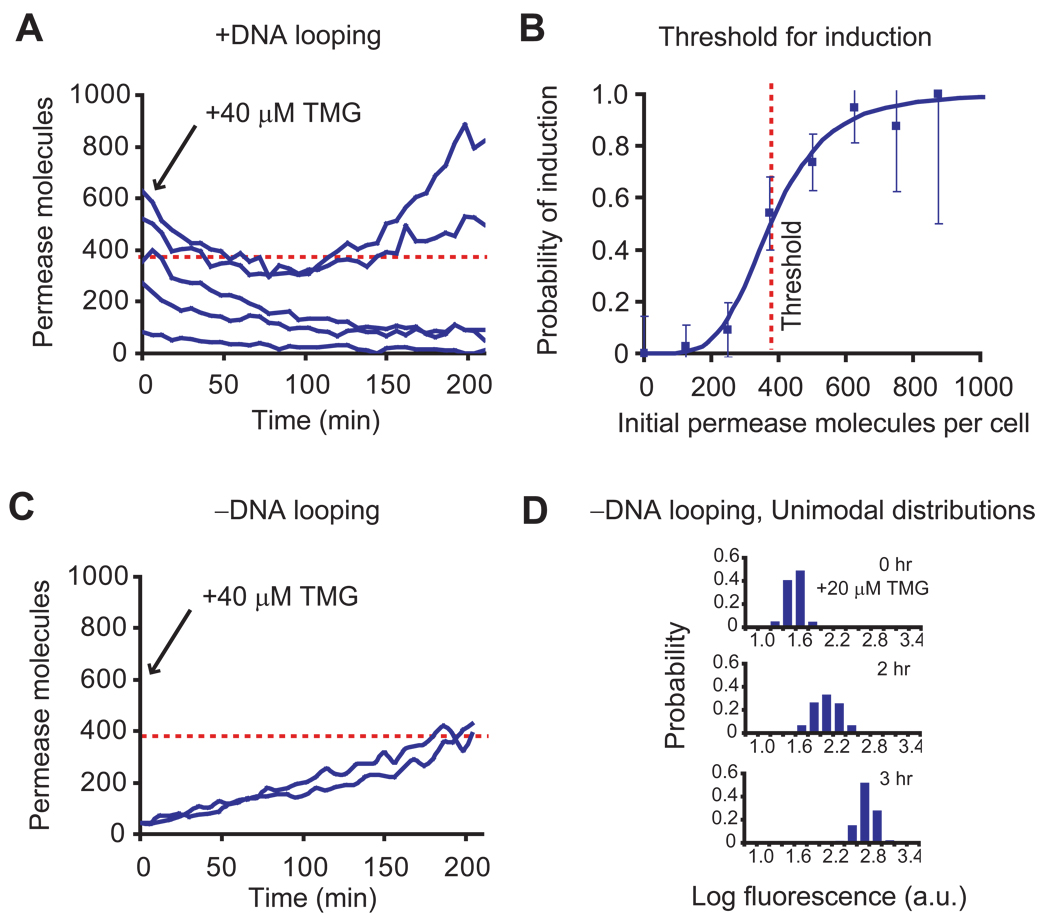
We then set out to determine the threshold of permease molecules for induction. It is experimentally difficult to capture the rare events of phenotype switching in real time. To overcome this difficulty, we prepared cells covering a broad range of permease copy numbers by first fully inducing the cells and subsequently washing out the inducer. We then allow the cells to divide for one to six generations, during which the initial permeases are partitioned into daughter cells (17). Figure 2A shows fluorescence time traces of the cells, normalized by cell size, upon the reintroduction of 40 µM TMG. Interestingly, while the fluorescence in cells with low permease numbers continues to decay because of cell division and photobleaching, cells with over 300 initial permease molecules induce again within three hours and show increased fluorescence. Figure 2B shows that the probability of induction as a function of initial permease number, which is well fit by a Hill equation with a Hill coefficient of 4.5 and a threshold of ~375 molecules. The large value of the threshold indicates that hundreds of permease molecules are necessary to switch the phenotype.
Figure 2.
Measurement of the threshold of permease molecules for induction. (A) Single cell time traces of fluorescence intensity, normalized by cell size, starting from different initial permease numbers. The initial LacY-YFP numbers are prepared through dilution by cell division of fully induced cells after removal of inducer. Upon adding 40 µM TMG at time zero, those cells with low initial permease numbers lose fluorescence with time as a result of dilution by cell division and photobleaching, while those cells with high initial permease numbers exhibit an increase in fluorescence as a result of reinduction. Permease molecule numbers are estimated from cell fluorescence (28). (B) The probability of induction of a cell within three hours as a function of initial permease number was determined using traces from 90 cells. The probability of induction, p, is fit with a Hill equation p = y4.5 / (y4.5 + 3754.5) for initial permease number, y. The threshold of permease numbers for induction is thus determined to be 375 molecules. Error bars are the inverse square root of sample size at each point. (C) To prove that complete dissociation of tetrameric repressor from two operators triggers induction, we constructed strain SX702 with auxiliary operators removed (no DNA looping). The figure shows single-cell traces of permease numbers in single cells grown in 40 µM TMG as a function of time. Unlike the looping strain SX700, the rapid induction of SX702 is no longer dependent on the initial number of permease molecules. This proves that phenotype switching is the result of a complete dissociation of the tetrameric repressor as shown in B. (D) In the absence of DNA looping, the entire population of strain SX702 rapidly induces in a coordinated manner from far below the threshold for a concentration as low as 20 µM TMG. DNA looping is necessary for bistability of the lac operon under these conditions.
If the induction is due to a single rate-limiting event as Novick and Weiner argued, there must be a single large burst of permease expression to reach this high threshold. However, only small bursts have been observed in previous studies of the repressed lac promoter (14, 18). Large bursts, if any, would be infrequent and insufficiently sampled in the previous works. To explain why both small and large bursts may occur from the lac promoter, we consider the tetrameric repressor that is doubly bound to two operators, forming a DNA loop (19, 20). We hypothesize that more frequent partial dissociations of the tetrameric repressor from one operator lead to single transcripts and small bursts of protein expression, while rare complete dissociations from all operators lead to multiple transcripts and large bursts of expression. In this model, the complete dissociation of the tetrameric repressor would be the molecular event causing a change in phenotype.
To test this model experimentally, we first removed the auxiliary operators from SX700 to generate SX702 (Fig. S2), which cannot form DNA loops. As a result, every dissociation event of LacI from the remaining O1 operator results in a complete dissociation event that would generate a large burst of expression. In this case, we predict frequent and large bursts of expression with a faster rate of phenotype switching. Indeed, Figure 2C shows that without DNA looping, SX702 induces rapidly upon addition of inducer, even though the initial permease numbers are much smaller than the threshold in Figures 2A and 2B (see Supporting Text). Interestingly, the removal of DNA looping eliminates bistability. This is manifested by the unimodal distributions of an inducing population in Figure 2D at 20 µM TMG concentrations.
To observe large bursts directly, we replaced the lacY gene of the E. coli chromosome with a membrane localized protein Tsr fused to YFP, generating strain SX701 (Fig. S2). Eliminating LacY’s positive feedback serves two purposes: allowing the resolution of distinct large bursts and proving that large bursts do not require permease activity. The Tsr-YFP fusion functions as a surrogate reporter for protein production with single-molecule sensitivity.
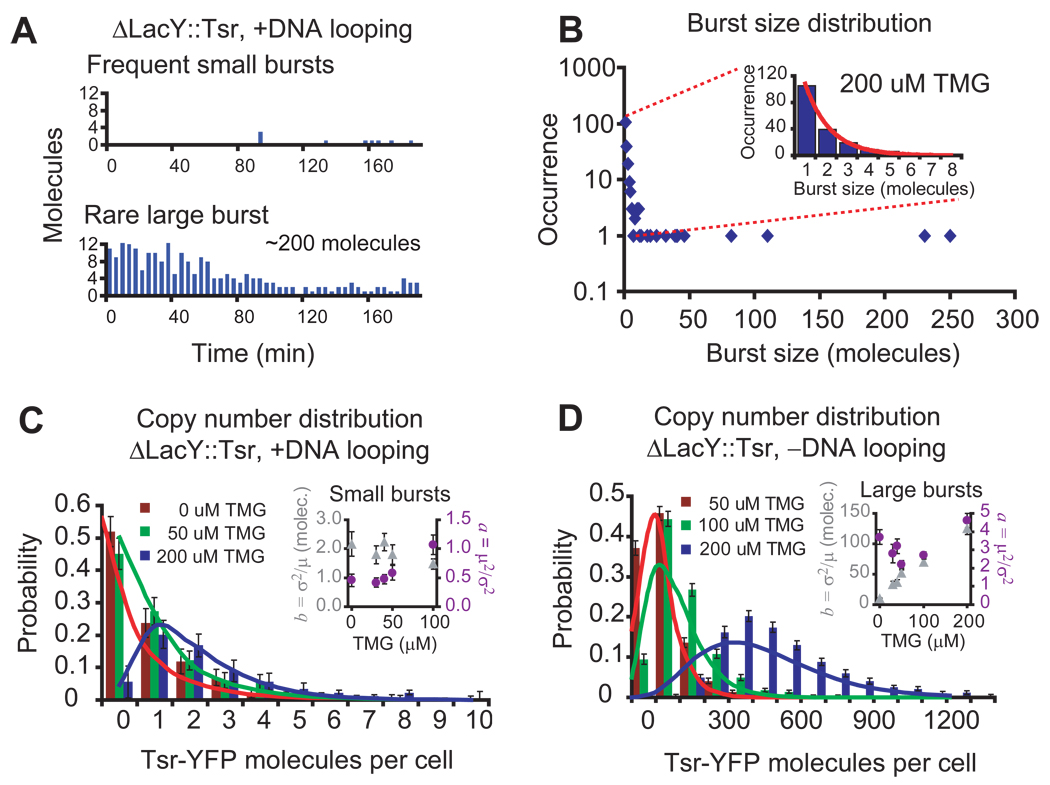
When we acquire time-lapse fluorescence microscopy movies of SX701 cells with 200uM TMG, we observed that Tsr-YFP is produced mostly in small bursts, but occasionally in a large burst (Figures 3A). The distribution of burst sizes (Figure 3B) taken from these real-time traces, shows both the frequent, exponentially distributed small bursts and the rare, unusually large bursts.
Figure 3.
Small and large bursts in the absence of positive feedback. In order to eliminate positive feedback from permease transport, we constructed strain SX701, replacing the lactose permease with the membrane protein fusion, Tsr-YFP. (A) Real-time traces of protein production in SX701 in 200 µM TMG. The FPs are photobleached immediately after detection to ensure that only newly produced proteins are measured after each 4 minute interval. Representative traces of single cells show frequent small bursts, associated with partial dissociation events, and a rare large burst, associated with a complete dissociation event, of protein production. (B) Distribution of burst sizes determined for 208 bursts from the real-time experiment depicted in B. Although the majority of bursts are small, a number of unusually large bursts are observed. The former are attributed to partial dissociations, and the latter to complete dissociations of the tetrameric repressor. Inset: The occurrence of burst sizes smaller than 10 molecules is well-fit by an exponential distribution (red line). (C) Analysis of small bursts from partial dissociations of the tetrameric repressor shows that the distribution of YFP molecules in the range of zero to ten molecules does not change in the range of 0 to 200 µM TMG. A small percentage of cells have much more than ten molecules and do not appear on the axis of this plot (see Fig. S7C). Over 100 cells were analyzed for each concentration. Inset: The frequency of bursts per cell cycle, (purple circles) increases slightly while the average number of proteins per burst, (gray triangles), remains approximately constant. These kinetic parameters are determined from the steady-state distribution of YFP in those cells with less than ten molecules (see text). Error bars are standard errors determined by bootstrapping. Gamma distributions using the determined parameters are overlayed as dashed lines. The gamma distribution for 200 µM is normalized for the subpopulation of cells with less than 10 molecules. (D) In addition to having the permease replaced with Tsr-YFP, strain SX703 has the auxiliary operators removed, eliminating DNA looping so that every dissociation event is a complete dissociation. The protein number distributions should reflect the bursts of protein expression from complete dissociations alone. Inset: the noise parameters µ2/σ2 (purple circles ) and σ2/µ (gray triangles) suggest that the frequency of large bursts is independent of the TMG concentration but that the burst size is not.
We now analyze the inducer concentration dependence of burst frequency and size using population distributions. Figure 3C shows that SX701 has a protein copy number distribution in a cell population very similar to the distributions of uninduced cells in Figure 1D within the range of zero to ten molecules. We have shown that these copy-number distributions manifest the stochasticity in gene expression characterized by two parameters, transcription rate, a, and the burst size of proteins per mRNA, b, and can be well-fit with a gamma distribution, p(n) = b−ana−1e−n/b/Γ(a) (18, 21). The inset in Figure 3C shows a and b determined in this fashion for cells with less than ten molecules for different TMG concentrations. The small burst size is independent of inducer concentration, whereas the small burst frequency has only a weak concentration dependence. In fact, within the range of 0 to 50 µM TMG, the small burst frequency does not change appreciably, suggesting that the partial repressor dissociation is predominantly spontaneous at low inducer concentrations.
Because characterization of the rare, large bursts is difficult for the wildtype operators, we generated strain SX703, in which the permease gene is replaced with Tsr-YFP and the O2 and O3 operators are removed to eliminate DNA looping. Every dissociation event in the SX703 should be a complete dissociation, and hence, lead to a large burst. As there is a 20–100 fold difference in the inducer binding affinity to the repressor in DNA bound form (~1mM) compared to the free form (~10uM) (22, 23), we expect to observe the stochastic dissociation of the repressor from the sole operator site and sequestration of the free repressor by the inducers at the concentrations we use (0–50uM), rather than inducer driven dissociation events.
Consequently, we expect the frequency of dissociation to remain constant as inducer concentration increases while the length of the dissociation time to increase. When we analyze the steady-state protein distributions at different inducer concentrations (Fig. 4C), by applying a generalized interpretation of the a–b model which estimates the number of proteins per expression bursts(see Supporting Text), we find that inducer concentration affects the size of large bursts, but not the frequency. This observation supports our model that the inducer sequesters the repressor after it stochastically dissociate from the operator and prolong its lifetime in the non-DNA bound state, leading to larger burst sizes (see Supporting Text).
Figure 4.
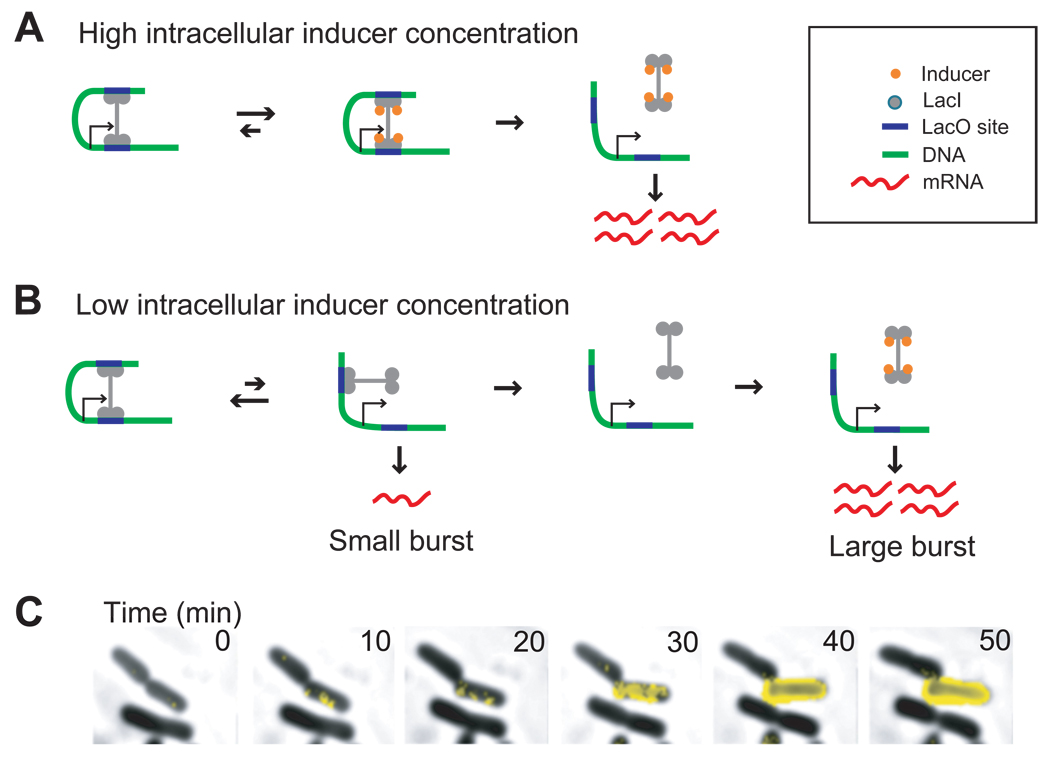
Complete dissociation of the tetrameric repressor triggers induction. (A) A high concentration of intracellular inducer can force dissociation of the repressor from its operators, as described by Jacob and Monod (6). (B) At low or intermediate concentrations of intracellular inducer, partial dissociation from one operator by the tetrameric LacI repressor is followed by a fast rebinding. Consequently, no more than one transcript is generated during such a brief dissociation event. However, the tetrameric repressor can dissociate from both operators spontaneously and stochastically, then sequestered by inducer such that it cannot rebind, leading to a large burst of expression. (C) A time-lapse sequence captures a phenotype switching event. In the presence of 50 µM TMG, one daughter cell of a dividing cell switches phenotype to express many LacY-YFP molecules (yellow fluorescence overlay) while the other daughter cell does not (see Movie S1).
Figure 4 summarized the model of induction in the lac operon. In the case of high inducer concentration (Fig. 4A), the repressor is actively pulled off both operator sites by the inducer, as described in Jacob and Monod’s model (6). Under low or intermediate TMG concentrations, however, the repressor can stochastically dissociate from one operator, independent of the inducer, as shown in Figure 4B. When the repressor partially dissociates from one operator, a small protein burst from a single copy of mRNA is generated (14), before the repressor rapidly rebinds to the vacant operator. When the repressor completely dissociates from both operators, multiple mRNAs are transcribed, leading to a large protein burst that surpasses the LacY threshold, initiate positive feedback, and maintain a switch in phenotype.
Why do complete dissociation events give rise to large bursts? Our group has recently shown that if a repressor dissociates from DNA, it takes a timescale of minutes for the operator to be rebound by a repressor again, because a repressor spends most of its time bound to and searching along nonspecific sequences on chromosomal DNA (15). In addition, there are only a few copies of the tetrameric repressors (8). Such a slow repressor rebinding time, compared to transcript initiation frequencies (24), would allow multiple copies of lacY mRNA to be made following a complete repressor dissociation event. Furthermore, in the presence of inducer, the nonspecific binding constant remains unchanged (25), but, the affinity of the inducer-bound repressor to the operator is significantly reduced, rendering specific rebinding unlikely. The large burst that results from slow repressor rebinding is an example of how a single-molecule fluctuation under out-of-equilibrium conditions can have significant biological consequences, which has been discussed theoretically in the context of cell signaling (26) and gene expression (27) but has not been experimentally observed previously.
Because inducers have a 20–100 fold weaker binding affinity for operator-bound repressor than free repressors (22, 23), the inducer’s role under low concentrations is not to force a dissociation event, but to simply sequester repressors already dissociated from their operators to aid in creating a large burst (see Supporting text and Fig. 3d). As the inducer concentration increases, the size of the large bursts increases as the duration of complete dissociation events increases, improving the probability that a large burst can cross the positive feedback threshold. Consequently, it is this higher probability of successful switch-on events that shifts the bimodal population towards the fully induced state as inducer concentration increases.
The biological significance of DNA looping has been discussed in the literature in terms of facilitating interactions between distance sequences and enhancing the local concentration (19, 20). Here we show that DNA looping allows the control of gene regulation on multiple timescales through different kinds of dissociation events. The presence of DNA looping allows the use of rare complete dissociation events to control a bistable genetic switch.
We have demonstrated that a stochastic single-molecule event can cause a change in phenotype. It is not difficult to imagine that similar molecular events might determine more complicated phenotypes of other cells or organisms. The ability to observe and probe the properties of genetic switches at the molecular level is crucial for understanding how cells make decisions.
Supplementary Material
Footnotes
REFERENCES
- 1.Arkin A, Ross J, McAdams HH. Genetics. 1998;149:1633–1648. doi: 10.1093/genetics/149.4.1633. [DOI] [PMC free article] [PubMed] [Google Scholar]
- 2.Ptashne M. A Genetic Switch: Phage Lambda Revisited. New York: Cold Spring Harbor Laboratory Press; 2004. [Google Scholar]
- 3.Kaern M, Elston TC, Blake WJ, Collins JJ. Nat. Rev. Genetics. 2005;6:451–464. doi: 10.1038/nrg1615. [DOI] [PubMed] [Google Scholar]
- 4.Dubnau D, Losick R. Mol. Microbiol. 2006;61:564–572. doi: 10.1111/j.1365-2958.2006.05249.x. [DOI] [PubMed] [Google Scholar]
- 5.Dekel E, Alon U. Nature. 2005;436:588–592. doi: 10.1038/nature03842. [DOI] [PubMed] [Google Scholar]
- 6.Monod J, Jacob F. J. Mol. Biol. 1961;3:318–356. doi: 10.1016/s0022-2836(61)80072-7. [DOI] [PubMed] [Google Scholar]
- 7.Müller-Hill B. The Lac Operon: A Short History of a Genetic Paradigm. New York: Walter de Gruyter; 1996. [Google Scholar]
- 8.Gilbert W, Müller-Hill B. Proc. Natl. Acad. Sci. U.S.A. 1966;56:1891–1898. doi: 10.1073/pnas.56.6.1891. [DOI] [PMC free article] [PubMed] [Google Scholar]
- 9.Cohen GN, Monod J. Bacteriol. Rev. 1957;21:169–194. doi: 10.1128/br.21.3.169-194.1957. [DOI] [PMC free article] [PubMed] [Google Scholar]
- 10.Vilar JMG, Guet CC, Leibler S. J. Cell Biol. 2003;161:471–476. doi: 10.1083/jcb.200301125. [DOI] [PMC free article] [PubMed] [Google Scholar]
- 11.Mettetal T, Muzzey D, Pedraza JM, Ozbudak EM, van Oudenaarden A. Proc. Natl. Acad. U.S.A. 2006;103:7304–7309. doi: 10.1073/pnas.0509874103. [DOI] [PMC free article] [PubMed] [Google Scholar]
- 12.Novick A, Weiner M. Proc. Natl. Acad. Sci. U.S.A. 1957;43:553–566. doi: 10.1073/pnas.43.7.553. [DOI] [PMC free article] [PubMed] [Google Scholar]
- 13.Ozbudak EM, Thattai M, Lim HN, Shraiman BI, van Oudenaarden A. Nature. 2004;427:737–740. doi: 10.1038/nature02298. [DOI] [PubMed] [Google Scholar]
- 14.Yu J, Xiao J, Ren X, Lao K, Xie XS. Science. 2006;311:1600–1603. doi: 10.1126/science.1119623. [DOI] [PubMed] [Google Scholar]
- 15.Elf J, Li GW, Xie XS. Science. 2007;316:1191–1194. doi: 10.1126/science.1141967. [DOI] [PMC free article] [PubMed] [Google Scholar]
- 16.Xie XS, Choi PJ, Li GW, Lee NK, Lia G. Ann. Rev. Bioph. 2008;37:417–444. doi: 10.1146/annurev.biophys.37.092607.174640. [DOI] [PubMed] [Google Scholar]
- 17.Rosenfeld N, Young JW, Alon U, Swain PS, Elowitz MB. Science. 2005;307:1962–1965. doi: 10.1126/science.1106914. [DOI] [PubMed] [Google Scholar]
- 18.Cai L, Friedman N, Xie XS. Nature. 2006;440:358–362. doi: 10.1038/nature04599. [DOI] [PubMed] [Google Scholar]
- 19.Krämer H, et al. EMBO J. 1987;6:1481–1491. doi: 10.1002/j.1460-2075.1987.tb02390.x. [DOI] [PMC free article] [PubMed] [Google Scholar]
- 20.Oehler S, Eismann ER, Krämer H, Müller-Hill B. EMBO J. 1990;9:973–979. doi: 10.1002/j.1460-2075.1990.tb08199.x. [DOI] [PMC free article] [PubMed] [Google Scholar]
- 21.Friedman N, Cai L, Xie XS. Phys. Rev. Lett. 2006;97:168302. doi: 10.1103/PhysRevLett.97.168302. [DOI] [PubMed] [Google Scholar]
- 22.Barkley MD, Riggs AD, Jobe A, Bourgeois S. Biochem. 1975;14:1700–1712. doi: 10.1021/bi00679a024. [DOI] [PubMed] [Google Scholar]
- 23.Dunaway M, et al. J. Biol. Chem. 1980;255:10115–10119. [PubMed] [Google Scholar]
- 24.Kennell D, Riezman H. J. Mol. Biol. 1977;114:1–21. doi: 10.1016/0022-2836(77)90279-0. [DOI] [PubMed] [Google Scholar]
- 25.Rezvin A, von Hippel PH. Biochem. 1977;16:4769–4776. doi: 10.1021/bi00641a002. [DOI] [PubMed] [Google Scholar]
- 26.Artyomov MN, Das J, Kardar M, Chakraborty AK, K A. Proc. Natl. Acad. U.S.A. 2007;104:18958–18963. doi: 10.1073/pnas.0706110104. [DOI] [PMC free article] [PubMed] [Google Scholar]
- 27.Hornos JEM, et al. Phys. Rev. E. 2005;72:051907. [Google Scholar]
- 28.Materials and methods are available as supporting material on Science Online.
- 29.We would like to thank G. Church, A. Miyawaki, and B. Wanner for bacterial strains and plasmids, J. Hearn for technical assistance, and J. Elf, N. Friedman, and G. W. Li for helpful discussions. This work was supported by the NIH Director's Pioneer Award. P. J. C. acknowledges the John and Fannie Hertz Foundation.
Associated Data
This section collects any data citations, data availability statements, or supplementary materials included in this article.


