

Light-regulatable compounds are finding increasing utility as spatial and temporal probes of biological behavior.1 Although these compounds are presumed to undergo photolysis (or photoisomerization) in response to illumination, the observed biological response is typically taken as the only evidence that a photoinitiated event has transpired. An independent measure of successful light-induced structural change is possible if alteration (e.g. activation, deactivation, etc) of the bioprobe can be directly linked to a fluorescent readout. Furthermore, such a design element would not only allow one to quantify the amount of photoalterated bioprobe that had been generated, but it could also be used to visualize the intracellular localization of the bioprobe after illumination. To the best of our knowledge, Muir and his colleagues were the first to put this concept into practice.2 These investigators prepared a protein construct (Smad2) via expressed protein ligation that generates a 26-fold fluorescent enhancement upon photolysis. Subsequently, Kutateladze and coworkers described a thioxanthone-based system that furnishes an up to 17-fold enhancement in response to photocleavage.3
Unlike enzyme-catalyzed reactions, in which readouts (e.g. fluorescence) are continuously amplified as a function of time, photolysis produces a fixed amount of product. A large fluorescent change in response to illumination reduces the amount of bioprobe required for visualization, which in turn reduces the likelihood of undesired “observer effect”-induced alterations in cellular biochemistry.4 A case in point is the mitochondrion, the so-called energy factory of the cell, which contains several suborganelle compartments that can be targeted using specific amino acid sequences. However, given the small size of these organelles, targeting sequence over-saturation of these compartments is possible if large quantities are required for visualization. With this concern in mind, we initiated a program to evaluate an array of structural motifs in order to identify quenched fluorescent cassettes that furnish a large fluorescent response upon photolysis.
A library of thirty-two modularly designed tripeptides, of the general structure 1 and 2, was prepared (Chart 1). Fluorescein (3) and tetramethylrhodamine (4; TAMRA) analogs were evaluated as the fluorophore component since they are commonly employed in cell-based studies. The other variables that constitute the library include two photolinkers (5 and 6), four different quenchers (7 – 9), and two sequences [fluorophore at the C-terminus (1) or at the N-terminus (2)]. The library was prepared via solid phase synthesis followed by stepwise modification of the Lys and Cys side chains with the fluorophore and quencher, respectively. All library members were HPLC purified (Fig. S-1) and subsequently characterized. Fluorescent readings were obtained prior to and following photolysis (Figs. S-2 – S-6). The fluorescein- and TAMRA-derivatized library members are furnished in Table 1. Our leads (Ac-Lys(Fl)-photolinker-Cys(Q)-amide, where Lys(Fl) = 4, photolinker = 5, Cys(Q) = 7, 8; “4-5-7”, “4-5-8”) display a greater than 300-fold fluorescent enhancement upon photolysis.
Chart 1.
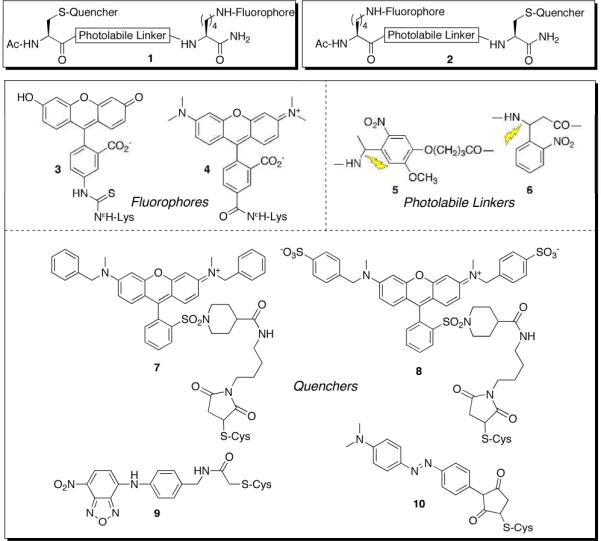
Quenched fluorescent cassette library (1 and 2) derived from fluorophores 3 and 4, photolabile linkers 5 and 6, and quenchers 7 – 10.
Table 1. Light-Induced fluorescence changes (italics) of the quenched fluorescent cassette library (see Chart 1 for structures).
The fluorescein (upper half of table) and TAMRA (lower half of table) cassettes are segregated. See Fig. S-4 – S-5.
| 7-5-3 | 8-5-3 | 9-5-3 | 10-5-3 |
| 25 ± 1 | 6.5 ± 1 | 3.0 ± 0.2 | 4.0 ± 0.3 |
| 7-6-3 | 8-6-3 | 9-6-3 | 10-6-3 |
| 11 ± 1 | 22 ± 1 | 2.8 ± 0.1 | 14 ± 2 |
| 3-5-7 | 3-5-8 | 3-5-9 | 3-5-10 |
| 75 ± 1 | 48 ± 15 | 17 ± 3 | 35 ± 1 |
| 3-6-7 | 3-6-8 | 3-6-9 | 3-6-10 |
| 75 ± 7 | 57 ± 13 | 6.0 ± 0.1 | 12 ± 1 |
| 7-5-4 | 8-5-4 | 9-5-4 | 10-5-4 |
| 160 ± 4 | 290 ± 20 | 32 ± 2 | 8.0 ± 0.1 |
| 7-6-4 | 8-6-4 | 9-6-4 | 10-6-4 |
| 55 ± 10 | 56 ± 2 | 31 ± 1 | 28 ± 1 |
| 4-5-7 | 4-5-8 | 4-5-9 | 4-5-10 |
| 340 ± 10 | 360 ± 10 | 71 ± 7 | 86 ± 2 |
| 4-6-7 | 4-6-8 | 4-6-9 | 4-6-10 |
| 100 ± 20 | 120 ± 10 | 63 ± 2 | 30 ± 3 |
The most impressive light-induced fluorescent enhancements appear to be a consequence of two structural features: First, 7 and 8 more deeply quench the fluorescence of fluorescein and TAMRA than 9 or 10 (which may be a consequence of efficient FRET and collisional quenching) and thus deliver a larger fluorescent response. Second, nitrobenzyl-derivatives are modest quenchers of fluorescence as well.5 Cassettes in which photolysis detaches the nitrobenzyl-based photolinkers from the fluorophore-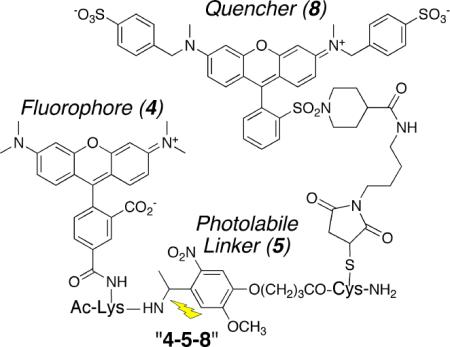 appended segment (e.g. 4-5-8), produce larger fluorescent changes than the corresponding cassettes in which the nitrobenzyl linker remains associated with the flourophore (e.g. 8-5-4). These large fluorescent changes can be easily observed using a hand held UV-vis lamp (video in Supporting Information), which both photolyzes the linker and excites the fluorophore.
The construction of “caged” compounds commonly relies upon transforming a biologically active species into an inert derivative via covalent modification of an essential functional group with a light sensitive moiety.1 However, direct modification of a single key site for complete biological caging purposes is not always feasible. It occurred to us that an alternative approach for manipulating activity is light-driven spatial control of the cellular distribution of the biological entity. For example, mitochondrial localization sequences (MLS), as well as related species, can be used to deliver activators (or inhibitors) to mitochondria, thereby triggering (or inhibiting) an organelle-specific biochemical cascade.6 If the bioactive species is linked to the MLS via a photocleavable moiety, then photolysis could potentially be used to switch off mitochondrial-specific activity via release of the active reagent from the MLS, leading to its subsequent dilution in the cytoplasm (Fig. 1). We've used cassettes from Table 1 to examine this “organelle targeted/light-mediated release strategy”.
Figure 1.
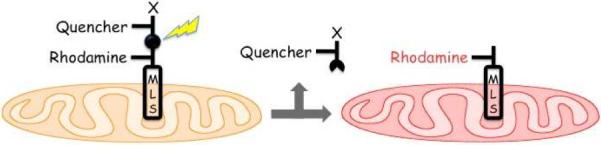
Mitochondrial-targeted light-mediated release strategy. Photolysis releases the quencher (and any associated biochemically active agent “X”) from the mitochondrial surface into the cytoplasm.
The peptide MLALLGWWWFSRKK-(PEG)-4-5-8-amide (“MLS-PEG-4-5-8”) was prepared via solid phase peptide synthesis, where the italicized component is based on a MLS that targets the mitochondrial outer membrane7 and PEG = — NHCH2(CH2CH2O)3(CH2)3NHCO-CH2OCH2CO—. Photolysis of MLS-PEG-4-5-8 splits the quencher (8) from the TAMRA (4)-appended peptide, which furnishes a 11-fold fluorescent enhancement (Fig. S-7). The latter is dramatically reduced from the fluorescent yield observed for the 4-5-8 cassette itself, which we ascribe to the presence of the MLS Trp (a known fluorescent quencher8) triplet. The mauve-colored MLS-PEG-4-5-8 is rapidly taken-up by isolated bovine heart mitochondria (Figs. S-12 – S-13), with little remaining in the supernatant as assessed by visual inspection, as well as by absorbance and fluorescence spectroscopy. Photolysis produces a sharp increase in supernatant absorbance, consistent with the release of the colored fluorescent quencher 8 from the mitochondria. Mitochondrial fluorescence quantitation was assessed via flow cytometry9, which revealed a light-mediated 13.4-fold fluorescent enhancement (Fig. S-13).
Unfortunately, the Trp-induced dim fluorescence of photolyzed MLS-PEG-4-5-8 precluded single cell imaging experiments. Consequently, we synthesized alternative constructs that utilized a cell permeable MLS10 (“CPMLS”; Ac-Fx-r-Fx-K-Fx-r-Fx-K where Fx = cyclohexylAla and r = D-Arg), with CPMLS-4-5-7 furnishing the largest light-induced fluorescent change (51-fold; Fig. S-8). Exposure of HeLa cells to CPMLS-4-5-7 and subsequent photolysis produced an 11.8 ± 0.7 fold fluorescence increase and subcellular mitochondrial localization as assessed by overlap with mitotracker FarRed (Fig. 2). By contrast, photolyzed 4-5-8 gives a diffuse pattern similar to TAMRA itself (Fig. S-16).
Figure 2.
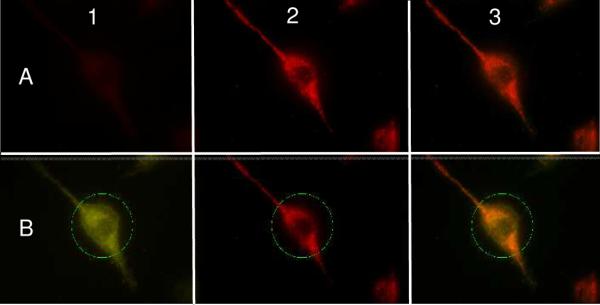
HeLa cells exposed to CPMLS-4-5-7 and mitotracker FarRed. Row A (unphotolyzed) and Row B (photolyzed), Column 1 (Cy 3 window, green, TAMRA-labeled peptide), Column 2 (Cy 5.5 window, red, mitotracker FarRed), Columns 3 (merged Columns 1 and 2, orange signifies regions of overlap, Pearson coefficient: 0.88 ± 0.03), and green circle (laser focus).
We have identified a series of photolabile fluorescently quenched cassettes that display large fluorescent enhancements upon photolysis. Cassette-containing MLS peptides are mitochondrial absorbed and photolyzed in the expected fashion. These reagents are under evaluation as the basis for a new strategy to spatially manipulate intracellular biochemical activity.
Supplementary Material
ACKNOWLEDGMENTS
We thank the NIH (CA79954) for financial support.
Footnotes
Supporting Information Available: Details of quenched fluorophore cassette and MLS-peptide synthesis, photolysis, mitochondrial, and cellular studies.
References
- 1.(a) Lee HM, Larson DR, Lawrence DS. ACS Chem. Biol. 2009;4:409–27. doi: 10.1021/cb900036s. [DOI] [PMC free article] [PubMed] [Google Scholar]; (b) Mayer G, Heckel A. Angew. Chem. Intl. Ed. Engl. 2006;45:4900–21. doi: 10.1002/anie.200600387. [DOI] [PubMed] [Google Scholar]
- 2.Pellois JP, Hahn ME, Muir TW. J. Am. Chem. Soc. 2004;126:7170–1. doi: 10.1021/ja0499142. [DOI] [PubMed] [Google Scholar]
- 3.Majjigapu JR, Kurchan AN, Kottani R, Gustafson TP, Kutateladze AG. J. Am. Chem. Soc. 2005;127:12458–9. doi: 10.1021/ja053654m. [DOI] [PubMed] [Google Scholar]
- 4.Sharma V, Lawrence DS. Angew. Chem. Intl. Ed. Engl. 2009;48:7290–2. doi: 10.1002/anie.200903717. [DOI] [PMC free article] [PubMed] [Google Scholar]
- 5.Carmel A, Keller E, Yaron A. Eur. J. Biochem. 1977;73:617–25. doi: 10.1111/j.1432-1033.1977.tb11357.x. [DOI] [PubMed] [Google Scholar]
- 6.Yousif LM, Stewart KM, Kelley SO. ChemBioChem. 2009;10:1939–50. doi: 10.1002/cbic.200900185. [DOI] [PubMed] [Google Scholar]
- 7.Huang LJ, Wang L, Ma Y, Durick K, Perkins G, Deerinck TJ, Ellisman MH, Taylor SS. J. Cell Biol. 1999;145:951–9. doi: 10.1083/jcb.145.5.951. [DOI] [PMC free article] [PubMed] [Google Scholar]
- 8.Doose S, Neuweiler H, Sauer M. ChemPhysChem. 2005;6:2277–85. doi: 10.1002/cphc.200500191. [DOI] [PubMed] [Google Scholar]
- 9.Fuller KM, Arriaga EA. Curr. Opin. Biotechnol. 2003;14:35–41. doi: 10.1016/s0958-1669(02)00008-3. [DOI] [PubMed] [Google Scholar]
- 10.Horton KL, Stewart KM, Fonseca SB, Guo Q, Kelley SO. Chem. Biol. 2008;15:315–82. doi: 10.1016/j.chembiol.2008.03.015. [DOI] [PubMed] [Google Scholar]
Associated Data
This section collects any data citations, data availability statements, or supplementary materials included in this article.