

Abstract
To understand and remember stories, readers integrate their knowledge of the world with information in the text. Here we present functional neuroimaging evidence that neural systems track changes in the situation described by a story. Different brain regions track different aspects of a story, such as a character’s physical location or current goals. Some of these regions mirror those involved when people perform, imagine, or observe similar real-world activities. These results support the view that readers understand a story by simulating the events in the story world and updating their simulation when features of that world change.
The information available to readers when reading a story is vastly richer than the information provided by the text alone. For example, when reading about a soccer game, readers with a rudimentary knowledge of the sport are quickly able to grasp the meaning of the sentence “The midfielder scored a goal” even though the text does not explicitly state how the goal was made, who was involved, or where the action took place. These elaborate representations of the situations described by text – situation models – arise through the integration of a reader’s knowledge of the world with information explicitly presented in text (Kintsch & van Dijk, 1978). Situation models are proposed to guide ongoing comprehension, and thereby affect later memory (van Dijk & Kintsch, 1983).
Situation models are thought to function by maintaining and updating representations of information that is presented in a story. Multiple dimensions of the situation are maintained in situation models, including the characters and objects present, the spatial and temporal layout of the narrated situation, and the characters’ goals and intentions (Gernsbacher, 1990). Readers can use these different aspects of story-relevant information to index the degree of overlap between what they are currently reading and what has happened previously in the story. Readers may update their situation models at points when overlap is low (Gernsbacher, 1990; Zwaan & Radvansky, 1998).
Recent theories of reading comprehension suggest that the representations of these various situation model dimensions are based on the activity of brain regions involved in analogous perceptions and actions in the real world (Barsalou, 1999; Glenberg, 1997; Zwaan, 2004). These theories suggest that the same representations used for making or watching a goal kick are activated when reading about a goal kick. Behavioral evidence provides some support for this claim: After reading a sentence describing an action, people are faster to recognize a picture that is consistent with the action than a picture that is inconsistent with the action (Zwaan, Stanfield, & Yaxley, 2002), and are faster to make movements consistent with the action than movements that are inconsistent with the action (Glenberg & Kaschak, 2002).
Neuroimaging studies of single word reading have also provided some initial support for the hypothesis that readers’ representations of word meaning are grounded in visual and motor representations. These studies have demonstrated that brain regions involved in reading action words are some of the same regions involved in performing analogous actions in the real world. For example, reading verbs such as “run” or “kick” activates brain regions that are selectively activated when moving one’s foot (Pulvermüller, 2005). One limitation of these studies is that they used restricted lists of single words. The processing of such stimuli may differ substantially from the processing of meaningful stories. However, these results do suggest a strong but untested prediction about the brain regions that should be active during story reading: The brain regions involved in tracking different dimensions of a reader’s situation model should correspond to regions that have a role in seeing and acting out similar activities in the real world.
To test this claim, we recorded brain activity using functional magnetic resonance imaging (fMRI) while participants read four short narratives. Each narrative was coded on six different dimensions of story information thought to be relevant to readers’ situation models (Zwaan & Radvansky, 1998): references to temporal information (e.g., “immediately”), changes in the causal relationships between narrated activities (i.e., when the activity described was not caused by an activity described previously), points when the subject of the text changed (character changes), changes in characters’ spatial locations (e.g., moving from one room to another, or from one point to another within a room), changes in characters’ interactions with objects (e.g., when characters picked something up or put something down), and points when a character initiated a new goal (see Figure 1a). We then identified brain regions whose activity significantly increased at points when each of these aspects of the story situation had changed. In this way, we were able to determine whether the regions activated at these points were similar to the regions activated when observers or actors perceive or carry out analogous activities in the real world.
Figure 1.
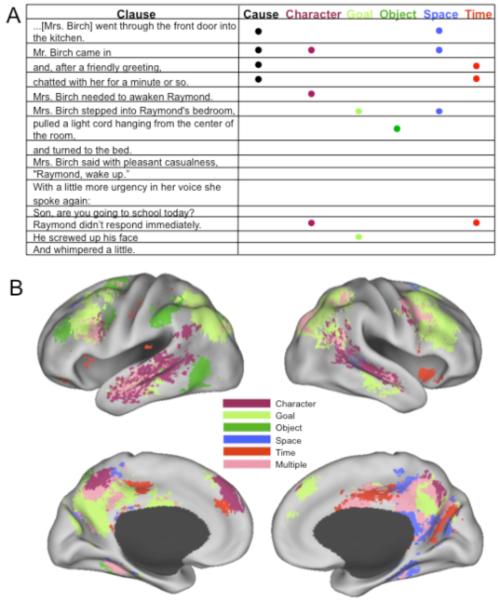
Regions involved in comprehending changes in the narrated situation. Panel A shows a sample passage and coding scheme from the “waking up” narrative. Brain regions that increased in activity in response to one or more types of situation changes while reading the narratives are shown in Panel B. The top images give inflated left and right lateral views of cortex, and the bottom images give the corresponding inflated medial views.
Method
Participants
All 28 participants were right-handed, native English speakers (ages 19-34, 20 women), and all gave informed consent according to the guidelines set forth by Washington University. Five participants had data from only two (n = 1) or three (n = 4) stories due to equipment malfunction or participant fatigue.
Materials
Four narratives were taken from the book One Boy’s Day (Barker & Wright, 1951), and described the everyday activities of a seven year-old boy. The narratives described Raymond getting up and eating breakfast (“Waking up”), playing with his friends on the school ground (“Play before school”), performing an English lesson in school (“Class work”), and participating in a music lesson (“Music lesson”). For the current series of studies, all references to Raymond’s interactions with the observers who recorded his activities were deleted (these references were rare), and the scenes were shortened where necessary to keep the length of each narrative below 1,500 words (Waking up, 1368 words; Play before school, 1104 words; Class work, 1182 words; Music lesson, 1404 words). All stimuli can be downloaded from http://dcl.wustl.edu/DCL/stimuli.html.
An LCD projector was used to project stimuli onto a screen positioned at the foot of the scanner, and participants viewed the stimuli through a mirror connected to the head coil. Stimulus presentation and timing were controlled by PsyScope software (Cohen, MacWhinney, Flatt, & Provost, 1993) running on an Apple PowerMac G4 computer (Apple, Cupertino, CA). A PsyScope button box was used to record responses during the behavioral testing session.
Task and Procedure
Each narrative was presented one word at a time to minimize eye movements, with each word remaining on the screen for 200 ms, followed by a 150 ms/syllable blank delay. Participants practiced this reading method on a separate narrative prior to scanning until they reported being comfortable with word-by-word reading.
The four narratives ranged in length from 8.5 to 10.9 minutes, and the order of the narratives was counterbalanced across participants. The first and fourth authors coded the narratives for situation changes at the level of clauses. Clauses were defined by identifying verbs together with their arguments. Complement clauses, subordinate clauses, and relative clauses that were dominated by a larger unit were grouped with those larger units.
We assessed whether or not a given clause contained a change in any of six situational dimensions (see Zacks, Speer, & Reynolds, in press). Spatial changes consisted of changes in the locations of characters of the narrative focus, such as moving from one room in a house to another or moving from one region of interaction within a room to another (e.g., “Raymond raced down the terrace”). Object changes occurred when a character interacted in an object in a new way (e.g., Raymond picking up a candy Easter egg). Character changes occurred whenever the subject of a clause was different than the subject of the previous clause. Causal changes occurred whenever a clause described an activity that was not directly caused by an activity described in the previous clause (e.g., a character initiating a new action). Goal changes occurred whenever a character started an action with a new goal. Although there were no temporal changes, each clause was coded for the presence or absence of a temporal reference (e.g., “immediately” or “slowly”). Mean inter-rater reliability across the situation changes was .77 as measured by Cohen’s Kappa, and disagreements were resolved by discussion.
Participants were told in advance that they would be given a comprehension test at the end of the session. Mean accuracy on this 20-item, 4-alternative multiple-choice test was 82.74% (SEM = 2.14%), indicating that participants were comprehending the narratives. Participants returned for a second, unscanned behavioral testing session in the laboratory (see Speer, Reynolds, & Zacks, 2007), but only the data from the scanning session are relevant to the current study.
Imaging
Images were acquired on a 3-T Siemens Vision MRI scanner (Erlangen, Germany). High-resolution (1 × 1 × 1.25 mm) structural images were acquired using a sagittal MP-RAGE T1-weighted sequence. Blood oxygen level dependent (BOLD) functional images were acquired using a T2*-weighted asymmetric spin-echo echo-planar sequence, with 32 slices (4.0 × 4.0 mm in-plane resolution) acquired every 2.048 s. A T2-weighted fast turbo spin-echo scan was acquired in the same planes as the functional scans to map the functional data to the structural data. The functional data were pre-processed to correct for timing offsets, slice intensity differences, and participant movement, and warped to a standard stereotactic space with isotropic voxels (3 × 3 × 3 mm) (Talairach & Tournoux, 1988). Data were then smoothed with a Gaussian filter (2 mm full-width half-maximum).
Imaging Data Analysis
Each participant’s brain response to each of the situation changes was estimated using the general linear model (GLM). Individual clauses were treated as trials in a rapid event-related data analysis. The clause start variable coded the onset of each trial. Clauses varied considerably in duration, and the interval between successive instances of each type of change varied considerably, which made it possible to accurately estimate the independent effects of each type of change (Maccotta, Zacks, & Buckner, 2001; Zacks et al., 2001). Six additional variables coded which (if any) situation changes occurred during each clause. The clause starts and situation changes were each coded as a 500-ms impulse at the beginning of the clause and convolved with a canonical hemodynamic response function with time constant = 1.25 s, delay = 2.0 s (Boynton, Engel, Glover, & Heeger, 1996) to generate regressors from the GLM. Ten additional regressors coded for effects of no interest (terminal and non-terminal punctuation, differences across each BOLD run, and the linear trend within each BOLD run). Participants with fewer than four BOLD runs had fewer regressors coding for differences across and linear trends within BOLD runs. Paired sample t-tests compared each of the situation changes to the clause start variable in order to generate maps of t-statistics for each of the six situation changes for each participant. The t-statistic maps were converted to z statistics and thresholded to control the map-wise false positive rate at p = .01 (clusters of at least 4 contiguous voxels with z values greater than 4.5; McAvoy, Ollinger, & Buckner, 2001). These maps were combined to create a composite map illustrating the voxels that responded significantly to one of the situation changes or to multiple situation changes. (A single category was used for those voxels that responded to more than one change to simplify the visualization.) The map was projected onto the cortical surface using CARET with the PALS atlas (Van Essen et al., 2001; Van Essen, 2002; http://brainmap.wustl.edu/caret; http://brainmap.wustl.edu:8081/sums/directory.do?id=636032).
To characterize the activated regions, local maxima in the statistical map for each situation change were identified, subject to the constraint that no two maxima were closer than 20 mm. Each significant voxel was assigned to the closest local maximum to define regions of interest for reporting and for further analyses. In order to test regional selectivity, region-based analyses asked whether, after removing the variance in the BOLD data associated with the situation change used to define each region, any of the remaining situation changes accounted for substantial additional variance. We used a hierarchical regression approach. In stage one we fit linear models for each region predicting the fMRI signal for each participant from the nuisance variables, the clause start variable, and the situation change variable used to define the region. In stage two we used each of the remaining situation change variables as the sole predictors in a simple regression model of the residuals from the stage one model. This was performed separately for each participant and the regression coefficients from the stage two models were compared to zero in t-tests with subject as the random effect (df = 27). Regions for which none of the t statistics exceeded 1.0 were characterized as selective for a single situation change. For a region with an effect of one of the other variables that was conventionally “medium” in size (d = .5; Cohen, 1988), the power to detect that effect by this criterion is .89; for a region in which two situation changes have medium effects, the power is .99.
Results
Responses To Individual Situation Changes
The regions responding to situation changes are illustrated in Figure 1B and listed in Table 1. Figure 1B shows all brain voxels that were associated with one or more situation changes, with those that were significantly associated with two or more situation changes colored pink. Activity in a number of regions changed during processing of the different types of changes. Furthermore, the neural responses to particular types of changes in the stories occurred in the vicinity of regions that increase in activity when viewing similar changes or when carrying out similar activities in the real world.
Table 1. Regions that significantly increased in activation in response to situation changes.
| x | y | z | Hemisphere | Sulcus/gyrus | BA | Size | |
|---|---|---|---|---|---|---|---|
| Cause | |||||||
|
| |||||||
| 29 | −70 | 37 | R | intraparietal sulcus | 19 | 1,620 | |
| 42 | 6 | 32 | R | middle frontal gyrus | 6 | 1,161 | |
| Character | |||||||
|
| |||||||
| * | −54 | −28 | −9 | L | superior temporal sulcus | 21 | 4,320 |
| * | −52 | −61 | 18 | L | parietotemporal junction | 39 | 621 |
| −44 | 8 | 29 | L | inferior/middle frontal gyrus | 9/44 | 1,107 | |
| −40 | −79 | 28 | L | superior occipital gyrus | 19 | 243 | |
| −31 | −59 | 43 | L | superior intraparietal sulcus | 7 | 297 | |
| −23 | −34 | 27 | L | white matter | n/a | 216 | |
| * | −6 | 48 | 26 | L | superior frontal gyrus | 9 | 270 |
| * | −3 | 42 | 46 | L | superior frontal gyrus | 8 | 1,134 |
| −2 | −59 | 38 | L | precuneus | 7/31 | 4,941 | |
| 30 | −66 | 40 | R | intraparietal sulcus | 7 | 810 | |
| 44 | 12 | 30 | R | inferior/middle frontal gyrus | 9/44 | 2,430 | |
| 51 | −22 | −10 | R | superior temporal gyrus | 22 | 2,214 | |
| * | 54 | −51 | 13 | R | parietotemporal junction | 22/39 | 1,107 |
| Goal | |||||||
|
| |||||||
| −54 | −27 | −12 | L | anterior superior temporal sulcus | 21 | 1,431 | |
| −46 | 12 | −19 | L | anterior superior temporal sulcus | 21 | 216 | |
| −45 | −54 | 17 | L | parietotemporal junciton | 39 | 135 | |
| −37 | 2 | 49 | L | middle frontal gyrus | 6/8 | 648 | |
| * | −35 | 14 | 29 | L | middle frontal gyrus | 44 | 3,159 |
| −34 | −66 | 38 | L | inferior parietal lobule | 39/40 | 11,799 | |
| −27 | −36 | −17 | L | hippocampus | 35 | 405 | |
| −22 | 17 | 56 | L | superior frontal gyrus | 8 | 702 | |
| −12 | −24 | 8 | L | thalamuus | n/a | 270 | |
| −9 | −64 | 22 | L | posterior cingulate gyrus/precuneus | 7/23/31 | 6,318 | |
| −9 | 30 | 46 | L | medial frontal gyrus | 8 | 810 | |
| −8 | −78 | −31 | L | medial cerebellum | n/a | 567 | |
| −3 | 42 | 27 | L | medial frontal gyrus | 9/32 | 297 | |
| 0 | −47 | 36 | medial | posterior cingulate gyrus | 5/31 | 7,614 | |
| 5 | −7 | 32 | medial | cingulate gyrus | 24 | 1,431 | |
| 8 | −19 | 9 | R | thalamus | n/a | 270 | |
| 14 | −62 | 24 | R | posterior cingulate gyrus/precuneus | 7/31 | 2,754 | |
| 18 | 16 | 52 | R | superior frontal gyrus | 6/8 | 675 | |
| 32 | −66 | 43 | R | inferior/superior parietal lobule | 7/19/39 | 8,154 | |
| 32 | −14 | 34 | R | inferior frontal gyrus | 44 | 837 | |
| 38 | 6 | 44 | R | precentral sulcus | 6 | 5,832 | |
| 42 | −49 | 52 | R | superior parietal lobule | 7 | 3,240 | |
| * | 43 | 22 | 26 | R | inferior frontal gyrus | 44/45/46 | 4,023 |
| 45 | −57 | 24 | R | inferior parietal lobule | 39 | 1,728 | |
| 56 | −29 | −11 | R | middle temporal gyrus | 21/22 | 1,377 | |
| Object | |||||||
|
| |||||||
| −59 | −35 | 39 | L | postcentral gyrus | 2/40 | 1,134 | |
| −52 | −33 | −5 | L | superior temporl sulcus | 22 | 189 | |
| −50 | −62 | −10 | L | posterior middle temporal gyrus | 37/39 | 1,701 | |
| * | −45 | 1 | 27 | L | precentral gyrus | 6 | 270 |
| −42 | 35 | 24 | L | middle frontal gyrus | 46 | 486 | |
| −41 | −46 | 42 | L | intraparietal sulcus | 37 | 324 | |
| −33 | −77 | 33 | L | interior parietal sulcus | 7/19/39 | 1,188 | |
| −30 | −43 | −16 | L | fusiform gyrus | 20/36 | 1,188 | |
| −28 | 1 | 60 | L | precentral gyrus | 6 | 2,079 | |
| −27 | 20 | 50 | L | middle frontal gyrus | 8 | 351 | |
| −9 | −68 | 54 | L | precuneus | 7 | 189 | |
| Space | |||||||
|
| |||||||
| −27 | −37 | −16 | L | hippocampus/parahippocampal gyrus | 35/36 | 1,242 | |
| −27 | 1 | 57 | L | superior frontal gyrus | 6 | 243 | |
| −26 | 22 | 43 | L | superior frontal gyrus | 8/9 | 135 | |
| −12 | −56 | 17 | L | parieto-occipital sulcus | 19 | 324 | |
| −6 | −43 | 39 | L | posterior cingulate gyrus | 5/31 | 2,970 | |
| 14 | −57 | 23 | R | parieto-occipital sulcus | 18/19 | 2,781 | |
| 14 | −32 | 11 | R | thalamus | n/a | 216 | |
| 22 | 7 | 57 | R | superior frontal gyrus | 6 | 135 | |
| 29 | −35 | −14 | R | hippocampus/parahippocampal gyrus | 35/36 | 999 | |
| 34 | −70 | 38 | R | superior parietal lobule | 7/19 | 270 | |
| 39 | −48 | 43 | R | intraparietal sulcus | 7 | 864 | |
| 53 | −38 | 1 | R | posterior superior temporal sulcus | 22 | 162 | |
| Time | |||||||
|
| |||||||
| * | −38 | 10 | 0 | L | insula | 44 | 243 |
| −33 | −67 | 38 | L | intraparietal sulcus | 7 | 810 | |
| −32 | 34 | 4 | L | inferior frontal gyrus | 45/47 | 513 | |
| −30 | −24 | 29 | L | white matter | n/a | 1,512 | |
| −29 | −36 | −14 | L | fusiform gyrus | 20 | 189 | |
| −22 | −48 | 18 | L | posterior cingulate gyrus | 23/31 | 3,834 | |
| * | −21 | 2 | 37 | L | white matter | n/a | 270 |
| −16 | −24 | 5 | L | thalamus | n/a | 1,296 | |
| −15 | −50 | 46 | L | posterior cingulate gyrus | 31 | 918 | |
| −13 | 36 | 24 | L | anterior cingulate gyrus | 32 | 162 | |
| 2 | −11 | 32 | R | cingulate gyrus | 24 | 1,620 | |
| 15 | −21 | 8 | R | thalamus | n/a | 1,134 | |
| 15 | 16 | 40 | R | cingulate gyrus | 31 | 135 | |
| 17 | −59 | 21 | R | posterior cingulate gyrus/precuneus | 30/31 | 3,240 | |
| 20 | −39 | 39 | R | posterior cingulate gyrus | 5/23/31 | 2,160 | |
| 24 | −41 | 13 | R | white matter | n/a | 3,186 | |
| 33 | 24 | −3 | R | inferior frontal gyrus | 47 | 621 | |
| 34 | −58 | 45 | R | intraparietal sulcus | 7 | 3,105 | |
| 38 | 2 | 37 | R | precentral gyrus | 6 | 1,782 | |
NOTE: x, y, and z represent coordinates of peaks in Talairach space; L=left, R=right
Region showed significant activity that was unique to a single change.
Characters and goals
Adjacent and overlapping regions in bilateral posterior superior temporal cortex (Brodmann’s areas 22/39) responded to changes in characters and goals. These regions also increase in activation when observing goal-directed, intentional actions relative to non-goal directed, meaningless motion (Decety & Grezes, 1999). Changes in characters’ goals also were associated with increased activation in prefrontal cortex (BA 9, 44, 46), damage to which results in impaired knowledge of the typical order and structure of daily, goal-directed activities (Wood & Grafman, 2003).
Object interactions
Regions that increased for character-object interactions included several regions considered part of the human grasping circuit (Castiello, 2005). One region of the lateral precentral sulcus (BA 6) likely corresponds to the premotor hand area (e.g., Ehrsson, Geyer, & Naito, 2003); another region, in the postcentral cortex (BA 2/40) likely corresponds to the somatosensory hand representation (Porro et al., 1996) and adjacent anterior intraparietal cortex (Johnson et al., 2002). Consistent with these regions’ involvement during grasping, both the precentral and postcentral activations were lateralized to the left hemisphere. The character-object interactions that were associated with these increases typically referred to characters putting down or picking up objects (e.g., “Raymond laid down his pencil”).
Space
Two bilateral superior frontal regions (BA 6) responded to changes in characters’ spatial locations. The locations of these regions fall within the 95% confidence intervals for functionally defined frontal eye fields (FEF), which increase in activation during saccadic eye movements relative to fixation (Speer, Swallow, & Zacks, 2003). Regions in right and left parahippocampal cortex, which increase in activation when processing changes in spatial location (Burgess, Maguire, & O’Keefe, 2002), also showed increased activation in relation to changes in characters’ spatial locations.
Time
Regions that increased during temporal references included the inferior frontal gyrus (BA 45/47), insula (BA 44), intraparietal sulcus (BA 7), medial posterior cortex (precuneus and cingulate gyrus, esp. BA 23/31) and anterior cingulate gyrus (BA 32), as well as posterior and anterior white matter tracts. The neurophysiology of time perception in this range of durations (seconds to minutes) is not well understood, so there are few if any neuroimaging data with which to compare these results. However, the cortical activations do correspond well with those observed in a recent study comparing stories with temporal inconsistencies to stories with emotional inconsistencies (Ferstl, Rinck, & von Cramon, 2005). (The extensive activations in white matter were unexpected and await further empirical confirmation.)
Selectivity of responses
Figure 1B suggests that a core network comprising the medial posterior cortex (precuneus, posterior cingulate cortex, the temporoparietal junction) and the lateral posterior frontal cortex were activated by multiple situation changes. Of note, all the regions that responded to causal changes also responded to other situation changes. However, Figure 1 also suggests that some brain regions were selectively activated by only one type of situation change. Given that a region shows a significant response to one situation change, the mere failure to detect significant responses to other changes is weak evidence of selectivity—particularly given the stringent statistical thresholds used here. To provide a direct assessment of selectivity for a single change, we performed a set of hierarchical regression analyses (see Imaging Data Analysis, above). The subset of regions that were determined to respond selectively to a single type of situation change are marked with asterisks in Table 1 and illustrated in Figure 2. These included responses to character changes in the posterior superior temporal sulcus and in medial frontal cortex, responses to goal changes in lateral frontal cortex, responses to object changes in premotor cortex, and responses to time changes in the left frontal operculum and anterior cingulate cortex.
Figure 2.

Subset of regions in Figure 1 that responded selectively to only one type of change. The left medial time-specific region was internal to the cortical surface; its approximate location is indicated with a spherical marker.
Responses To Increasing Numbers of Situation Changes
An additional analysis was conducted to identify regions that might play a role in determining when perceptual and motor representations of characters, goals, etc. should be updated in a reader’s situation model. Because readers update their situation models when incoming information conflicts with information maintained in the active situation model (Zwaan & Radvansky, 1998), the more dimensions that change at a given point in the story, the more likely that the active situation model is updated. This analysis coded for the total number of situation changes present in each clause in the GLMs rather than the type of changes (0, 1, 2, or ≥3 changes). A linear contrast identified voxels whose activation linearly increased with increasing numbers of changes, and the resulting t-statistics were generated in the same manner as the t-statistics for the individual situation model changes.
The number of changes in a given clause was related to activation in many of the change-related regions, such as dorsolateral prefrontal cortex (BA 9/46), posterior parietal cortex (BA 7/40), posterior cingulate cortex (BA 7/29/31) cortex, and bilateral hippocampi (BA 36) (compare Figure 1 and Figure 3, and see Table 2). This sensitivity to the number of changes in a clause may reflect the increased processing demands at points where multiple aspects of the narrated situation are changing, the higher probability of encountering a change on a given dimension, or the process of updating the situation model.
Figure 3.

Voxels whose activation increased with increasing numbers of situation changes are shown in orange-yellow. For reference, the regions from Figure 1 are shown as a light blue underlay. The top four images give inflated views of the cortical surface as in Figures 1 and 2; the bottom two images give axial slices to provide views of regions in anterior cingulate cortex that responded to increasing numbers of situation changes, but did not show significant increases to any individual change (orange circles).
Table 2. Regions with a linear relationship to the number of changes in a clause.
| x | y | z | Hemisphere | ROI | BA | Size (voxels) |
|---|---|---|---|---|---|---|
| −28 | 6 | 53 | L | middle frontal gyrus | 6 | 46 |
| −27 | 19 | 33 | L | middle frontal gyrus | 8/9 | 88 |
| −33 | 47 | 10 | L | middle frontal gyrus | 10/46 | 13 |
| −12 | −43 | 8 | L | posterior cingulate | 29/30 | 77 |
| −11 | −63 | 22 | L | posterior cingulate | 29/30/31 | 429 |
| −29 | −19 | 36 | L | posterior cingulate | 31 | 7 |
| −28 | −34 | −12 | L | hippocampus | 36 | 27 |
| −32 | −53 | 24 | L | inferior parietal lobule | 40 | 32 |
| −39 | −78 | 29 | L | inferior parietal lobule | 40 | 22 |
| 5 | −59 | 42 | bilateral | precuneus | 7 | 610 |
| −1 | −42 | 64 | bilateral | precuneus | 7 | 19 |
| 6 | −21 | 33 | bilateral | posterior cingulate | 23/31 | 115 |
| −5 | −42 | 33 | bilateral | posterior cingulate | 31 | 423 |
| 4 | 33 | 31 | bilateral | anterior cingulate gyrus | 32 | 45 |
| −2 | 45 | 5 | bilateral | anterior cingulate gyrus | 32 | 38 |
| 34 | 6 | 39 | R | middle frontal gyrus | 6 | 1 |
| 25 | 20 | 52 | R | middle frontal gyrus | 6/8 | 171 |
| 38 | 30 | 34 | R | middle frontal gyrus | 8 | 29 |
| 34 | 51 | 13 | R | middle frontal gyrus | 10/46 | 50 |
| 36 | −48 | 10 | R | superior temporal gyrus | 22 | 6 |
| 10 | −58 | 21 | R | posterior cingulate | 29/30/31 | 439 |
| 22 | −36 | 22 | R | posterior cingulate | 31 | 40 |
| 23 | −35 | −6 | R | hippocampus | 36 | 24 |
| 43 | −58 | 37 | R | inferior parietal lobule | 39/40 | 371 |
NOTE: x, y, and z represent coordinates of peaks in Talairach space; L = left, R = right; BA = Brodmann’s Area; Size = region size in cubic mm
Discussion
These results suggest that readers dynamically activate specific visual, motor, and conceptual features of activities while reading about analogous changes in activities in the context of a narrative, while reading: Regions involved in processing goal-directed human activity, navigating spatial environments, and manually manipulating objects in the real world increased in activation at points when those specific aspects of the narrated situation were changing. For example, when readers processed changes in a character’s interactions with an object, precentral and parietal areas associated with grasping hand movements increased in activation. Previous studies of motor execution and motor imagery provide strong evidence that the portion of premotor cortex identified in this study performs computations that are specific to motor planning and execution (Ehrsson et al., 2003; Michelon, Vettel, & Zacks, 2006; Picard & Strick, 2001). These results suggest that readers use perceptual and motor representations in the process of comprehending narrated activity, and these representations are dynamically updated at points where relevant aspects of the situation are changing.
Several recent studies have reported modality-specific brain activation using paradigms in which participants made judgments about individual words (Hauk, Johnsrude, & Pulvermuller, 2004; Hauk & Pulvermuller, 2004; Goldberg, Perfetti, & Schneider, 2006a; Goldberg, Perfetti, & Schneider, 2006b) or phrases (Aziz-Zadeh, Wilson, Rizzolatti, & Iacoboni, 2006; Noppeney, Josephs, Kiebel, Friston, & Price, 2005). However, such paradigms leave open the possibility that evoked responses could reflect, in part, cognitive operations that are specific to the specific word or phrase judgment task. By contrast, the current paradigm used continuous reading of extended passages with no overt judgment task.
Although a number of regions responded selectively to a particular type of change, there were also a number of regions whose activity increased for more than one type of situation change (compare Figures 1 and 2). These regions may be particularly important for indicating when the representations of characters, goals, etc. should be updated in a reader’s situation model. Because readers update their situation models when incoming information conflicts with information maintained within the active situation model, increasing the number of aspects of the situation that are changing may increase the likelihood that the active situation model is updated (Gernsbacher, 1990; Zwaan & Radvansky, 1998). This updating process should be associated with the perception that a new narrative event has begun (Zacks, Speer, Swallow, Braver, & Reynolds, 2007). Indeed, previously reported analyses of these data provided evidence that when changes occur readers tend to perceive that a new event has begun (Speer et al., 2007; see also Zacks et al., in press).
Figure 3 indicates that the number of changes in a given clause was related to activation in many of the regions depicted in Figure 1, such as dorsolateral prefrontal cortex (BA 9/46), posterior parietal cortex (BA 7/40), posterior cingulate cortex (BA 7/29/31) cortex, and bilateral hippocampi (BA 36). This sensitivity to the number of changes in a clause may reflect the increased processing demands at points where multiple aspects of the narrated situation are changing, or the higher probability of encountering a change. However, a region in the anterior cingulate cortex (BA 32), which was not involved in processing any of the individual changes, also increased in activity with increasing numbers of changes. Given the role of the anterior cingulate cortex in monitoring external and internal conflict (Brown & Braver, 2005), activation in this region may serve as a cue for the reader to update the current situation model, or begin constructing a new model. Additional studies are needed to determine the reason for this relation between activation and the number of changes in a reader’s situation model.
The collection of medial brain regions associated with situation changes in the current study closely resembles a network of regions that have been recently associated with the act of projecting one’s self into a remembered, anticipated, or imagined situation (Buckner & Carroll, 2007). These regions are functionally connected to the hippocampi (Vincent et al., 2006), which were also observed to increase in activity with increasing numbers of situation changes. This convergence is consistent with the idea that readers construct simulations of situations as they read a text, and that this process is similar to those of recalling previous situations or imagining potential ones.
Overall, these data make a strong case for embodied theories of language comprehension, in which readers’ representations of situations described in language are constructed from basic sensory and motor representations (Barsalou, 1999; Glenberg, 1997; Zwaan, 2004). However, the use of perceptual and motor representations to guide story comprehension may be an example of a more general, fundamental principle of cognitive function. Brain regions involved in motor function are active when viewing another person execute an action (Rizzolatti & Craighero, 2004). When viewing a movie, somatosensory and motor cortices increase in activity during scenes showing close-ups of features such as hands and faces (Hasson, Nir, Levy, Fuhrmann, & Malach, 2004), and similar correspondences exist between the regions involved in perceiving and later remembering auditory and visual information (Wheeler & Buckner, 2004). Thus, the use of sensory and motor representations during story comprehension observed in the current study may reflect a more general neural mechanism for grounding cognition in real-world experiences. Language may have adopted this general mechanism over the course of human evolution to allow individuals to communicate experiences efficiently and vividly.
Acknowledgments
NKS is now at the Western Interstate Commission for Higher Education; JRR is now at the University of Denver; KMS is now at the University of Minnesota. This research was supported by a grant from the National Institute of Mental Health (NIH RO1-MH70674), and a dissertation research award from the American Psychological Association. We thank Rebecca Hedden and Carol McKenna for assistance with data collection, and Dave Balota and Randy Buckner for comments on a previous draft of the manuscript.
References
- Aziz-Zadeh L, Wilson SM, Rizzolatti G, Iacoboni M. Congruent embodied representations for visually presented actions and linguistic phrases describing actions. Current Biology. 2006;16(18):1818–1823. doi: 10.1016/j.cub.2006.07.060. [DOI] [PubMed] [Google Scholar]
- Barsalou LW. Perceptual symbol systems. Behavioral and Brain Sciences. 1999;22(4):577–660. doi: 10.1017/s0140525x99002149. [DOI] [PubMed] [Google Scholar]
- Boynton GM, Engel SA, Glover GH, Heeger DJ. Linear systems analysis of functional magnetic resonance imaging in human V1. Journal of Neuroscience. 1996;16(13):4207–4221. doi: 10.1523/JNEUROSCI.16-13-04207.1996. [DOI] [PMC free article] [PubMed] [Google Scholar]
- Brown JW, Braver TS. Learned predictions of error likelihood in the anterior cingulate cortex. Science. 2005;307(5712):1118–1121. doi: 10.1126/science.1105783. [DOI] [PubMed] [Google Scholar]
- Buckner RL, Carroll DC. Self-projection and the brain. Trends in Cognitive Sciences. 2007;11(2):49–57. doi: 10.1016/j.tics.2006.11.004. [DOI] [PubMed] [Google Scholar]
- Burgess N, Maguire EA, O’Keefe J. The human hippocampus and spatial and episodic memory. Neuron. 2002;35(4):625–641. doi: 10.1016/s0896-6273(02)00830-9. [DOI] [PubMed] [Google Scholar]
- Castiello U. The neuroscience of grasping. Nature Reviews Neuroscience. 2005;6(9):726–736. doi: 10.1038/nrn1744. [DOI] [PubMed] [Google Scholar]
- Cohen J. Statistical power analysis for the behavioral sciences. 2 ed. Lawrence Erlbaum Associates, Inc.; Hillsdale, N.J.: 1988. [Google Scholar]
- Decety J, Grezes J. Neural mechanisms subserving the perception of human actions. Trends in Cognitive Sciences. 1999;3:172–178. doi: 10.1016/s1364-6613(99)01312-1. [DOI] [PubMed] [Google Scholar]
- Ehrsson HH, Geyer S, Naito E. Imagery of voluntary movement of fingers, toes, and tongue activates corresponding body-part-specific motor representations. Journal of Neurophysiology. 2003;90(5):3304–3316. doi: 10.1152/jn.01113.2002. [DOI] [PubMed] [Google Scholar]
- Ferstl EC, Rinck M, von Cramon DY. Emotional and temporal aspects of situation model processing during text comprehension: An event-related fMRI study. Journal of Cognitive Neuroscience. 2005;17(5):724–739. doi: 10.1162/0898929053747658. [DOI] [PubMed] [Google Scholar]
- Gernsbacher MA. Language comprehension as structure building. L. Erlbaum; Hillsdale: 1990. [Google Scholar]
- Glenberg AM, Kaschak MP. Grounding language in action. Psychonomic Bulletin & Review. 2002;9(3):558–565. doi: 10.3758/bf03196313. [DOI] [PubMed] [Google Scholar]
- Glenberg AM. What memory is for. Behavioral & Brain Sciences. 1997;20(1):1–19. doi: 10.1017/s0140525x97000010. [DOI] [PubMed] [Google Scholar]
- Goldberg RF, Perfetti CA, Schneider W. Distinct and common cortical activations for multimodal semantic categories. Cognitive Affective & Behavioral Neuroscience. 2006a;6(3):214–222. doi: 10.3758/cabn.6.3.214. [DOI] [PubMed] [Google Scholar]
- Goldberg RF, Perfetti CA, Schneider W. Perceptual knowledge retrieval activates sensory brain regions. Journal of Neuroscience. 2006b;26(18):4917–4921. doi: 10.1523/JNEUROSCI.5389-05.2006. [DOI] [PMC free article] [PubMed] [Google Scholar]
- Hasson U, Nir Y, Levy I, Fuhrmann G, Malach R. Intersubject synchronization of cortical activity during natural vision. Science. 2004;303(5664):1634–1640. doi: 10.1126/science.1089506. [DOI] [PubMed] [Google Scholar]
- Hauk O, Johnsrude I, Pulvermuller F. Somatotopic representation of action words in human motor and premotor cortex. Neuron. 2004;41(2):301–307. doi: 10.1016/s0896-6273(03)00838-9. [DOI] [PubMed] [Google Scholar]
- Hauk O, Pulvermuller F. Neurophysiological distinction of action words in the fronto-central cortex. Human Brain Mapping. 2004;21(3):191–201. doi: 10.1002/hbm.10157. [DOI] [PMC free article] [PubMed] [Google Scholar]
- Johnson SH, Rotte M, Grafton ST, Hinrichs H, Gazzaniga MS, Heinze HJ. Selective activation of a parietofrontal circuit during implicitly imagined prehension. NeuroImage. 2002;17(4):1693–1704. doi: 10.1006/nimg.2002.1265. [DOI] [PubMed] [Google Scholar]
- Kintsch W, van Dijk TA. Toward a model of text comprehension and production. Psychological Review. 1978;85:363–394. [Google Scholar]
- Maccotta L, Zacks JM, Buckner RL. Rapid self-paced event-related functional MRI: Feasibility and implications of stimulus-versus response-locked timing. NeuroImage. 2001;14:1105–1121. doi: 10.1006/nimg.2001.0912. [DOI] [PubMed] [Google Scholar]
- McAvoy M, Ollinger JM, Buckner RL. Cluster size thresholds for assessment of significant activation in fMRI. NeuroImage. 2001;13:S198. [Google Scholar]
- Michelon P, Vettel JM, Zacks JM. Lateral somatotopic organization during imagined and prepared movements. Journal of Neurophysiology. 2006;95:811–822. doi: 10.1152/jn.00488.2005. [DOI] [PubMed] [Google Scholar]
- Noppeney U, Josephs O, Kiebel S, Friston KJ, Price CJ. Action selectivity in parietal and temporal cortex. Cognitive Brain Research. 2005;25(3):641–649. doi: 10.1016/j.cogbrainres.2005.08.017. [DOI] [PubMed] [Google Scholar]
- Picard N, Strick PL. Imaging the premotor areas. Current Opinion in Neurobiology. 2001;11(6):663–672. doi: 10.1016/s0959-4388(01)00266-5. [DOI] [PubMed] [Google Scholar]
- Porro CA, Francescato MP, Cettolo V, Diamond ME, Baraldi P, Zuiani C, et al. Primary motor and sensory cortex activation during motor performance and motor imagery: a functional magnetic resonance imaging study. The Journal of Neuroscience. 1996;16(23):7688–7698. doi: 10.1523/JNEUROSCI.16-23-07688.1996. [DOI] [PMC free article] [PubMed] [Google Scholar]
- Pulvermüller F. Brain mechanisms linking language and action. Nature Reviews Neuroscience. 2005;6:576–582. doi: 10.1038/nrn1706. [DOI] [PubMed] [Google Scholar]
- Rizzolatti G, Craighero L. The mirror-neuron system. Annual Review of Neuroscience. 2004;27:169–192. doi: 10.1146/annurev.neuro.27.070203.144230. [DOI] [PubMed] [Google Scholar]
- Speer NK, Reynolds JR, Zacks JM. Human brain activity time-locked to narrative event boundaries. Psychological Science. 2007;18(5):449–455. doi: 10.1111/j.1467-9280.2007.01920.x. [DOI] [PubMed] [Google Scholar]
- Speer NK, Swallow KM, Zacks JM. The role of motion processing and eye movements in event perception; Paper presented at the Annual Meeting of the Cognitive Neuroscience Society; New York, NY. 2003. [Google Scholar]
- Talairach J, Tournoux P. Co-planar stereotaxic atlas of the human brain: 3-dimensional proportional system, an approach to cerebral imaging. G. Thieme; Stuttgart: 1988. [Google Scholar]
- van Dijk TA, Kintsch W. Strategies of discourse comprehension. Academic Press; New York: 1983. [Google Scholar]
- Van Essen DC, Drury HA, Dickson J, Harwell J, Hanlon D, Anderson CH. An integrated software suite for surface-based analyses of cerebral cortex. Journal of the American Medical Informatics Association. 2001;8(5):443–59. doi: 10.1136/jamia.2001.0080443. [DOI] [PMC free article] [PubMed] [Google Scholar]
- Van Essen DC. Windows on the brain: the emerging role of atlases and databases in neuroscience. Current Opinion in Neurobiology. 2002;12(5):574–579. doi: 10.1016/s0959-4388(02)00361-6. [DOI] [PubMed] [Google Scholar]
- Vincent JL, Snyder AZ, Fox MD, Shannon BJ, Andrews JR, Raichle ME, et al. Coherent spontaneous activity identifies a hippocampal-parietal memory network. Journal of Neurophysiology. 2006;96(6):3517–3531. doi: 10.1152/jn.00048.2006. [DOI] [PubMed] [Google Scholar]
- Wheeler ME, Buckner RL. Functional-anatomic correlates of remembering and knowing. Neuroimage. 2004;21(4):1337–1349. doi: 10.1016/j.neuroimage.2003.11.001. [DOI] [PubMed] [Google Scholar]
- Wood JN, Grafman J. Human prefrontal cortex: Processing and representational perspectives. Nature Reviews Neuroscience. 2003;4:139–147. doi: 10.1038/nrn1033. [DOI] [PubMed] [Google Scholar]
- Zacks JM, Braver TS, Sheridan MA, Donaldson DI, Snyder AZ, Ollinger JM, et al. Human brain activity time-locked to perceptual event boundaries. Nature Neuroscience. 2001;4(6):651–655. doi: 10.1038/88486. [DOI] [PubMed] [Google Scholar]
- Zacks JM, Speer NK, Reynolds JR. Situation changes predict the perception of event boundaries, reading time, and perceived predictability in narrative comprehension. Journal of Experimental Psychology: General. in press. [Google Scholar]
- Zacks JM, Speer NK, Swallow KM, Braver TS, Reynolds JR. Event perception: A mind/brain perspective. Psychological Bulletin. 2007;133(2):273–293. doi: 10.1037/0033-2909.133.2.273. [DOI] [PMC free article] [PubMed] [Google Scholar]
- Zwaan RA. The immersed experiencer: Toward an embodied theory of language comprehension. In: Ross BH, editor. The Psychology of Learning and Motivation. Vol. 44. Academic Press; New York: 2004. pp. 35–62. [Google Scholar]
- Zwaan RA, Radvansky GA. Situation models in language comprehension and memory. Psychological Bulletin. 1998;123(2):162–185. doi: 10.1037/0033-2909.123.2.162. [DOI] [PubMed] [Google Scholar]
- Zwaan RA, Stanfield RA, Yaxley RH. Language comprehenders mentally represent the shape of objects. Psychological Science. 2002;13(2):168–171. doi: 10.1111/1467-9280.00430. [DOI] [PubMed] [Google Scholar]