

Abstract
Introduction
Brain volume shrinkage is common in treatment-seeking patients with alcohol use disorders. Whether women are more vulnerable to brain dysmorphology than men despite lower alcohol consumption levels or shorter dependency (“telescoping effect”) remains controversial and has not been considered with respect to infratentorial structures or their potential contribution to ataxia.
Methods
The 200 participants included 64 men and 31 women with Diagnostic and Statistical Manual of Mental Disorders, Fourth Edition alcohol dependence and 105 controls. An infratentorial region (pons, cerebellar hemispheres, vermis (anterior, posterior, and inferior sectors), fissures, cisterns, fourth ventricle) was quantified with atlas-based parcellation. To enable comparison of men and women, regional tissue volumes were expressed as ratios of tissue in the volume. Participants also completed quantitative ataxia testing.
Results
Total infratentorial and vermian tissue ratios were significantly smaller in alcoholics than controls; alcoholic women did not show disproportionately greater volume deficits than alcoholic men. A re-analysis including alcoholic men and women matched in alcohol consumption, onset age, abstinence duration, and age revealed again that alcoholic women did not have disproportionately greater regional vermian volume deficits than alcoholic men. Alcoholic men and women were impaired in all measures of ataxia, which correlated with low infratentorial tissue ratios in men.
Discussion
Alcoholic men showed deficits of pontocerebellar volume ratios, yet alcoholic women did not display signs of “telescoping”. Further, alcoholic men and women both showed signs of ataxia of gait and balance, related to affected pontocerebellar systems in the men but not the women, suggesting the need to consider other neural substrates for ataxia in women.
Keywords: MRI, Cerebellum, Pons, Ataxia, Alcohol, Gender
Introduction
It is commonly held that regions of the cerebellum and pons are especially vulnerable to neurotoxic processes associated with chronic alcoholism. Notable neurological conditions, which involve these structures, are commonly associated with alcoholism and include alcoholic cerebellar degeneration (Gilman et al. 1990; Hillbom et al. 1986; Yokota et al. 2006) and central pontine myelinolysis (CPM; Adams et al. 1959; for review, Kleinschmidt-Demasters et al. 2006). Each condition is marked by well-recognized clinical manifestations affecting gait, balance, and postural stability: Ataxia of gait and postural instability is typical of alcoholic cerebellar degeneration (Gilman et al. 1981), and signs of dysarthria and dysphagia or as severe as quadriplegia (Mochizuki et al. 2003) are associated with acute central pontine myelinolysis (for review, Kleinschmidt-Demasters et al. 2006), although neuroradiological (Strub et al. 1999; Sullivan and Pfefferbaum 2001) and neuropathological (Newell and Kleinschmidt-DeMasters 1996; Slager 1986) studies have revealed clinically silent lesions. Both conditions can remit with sustained sobriety, providing confirmation for at least a partial alcoholism etiology (ataxia: Diener et al. 1984; Rosenbloom et al. 2004, 2007; CPM: Kleinschmidt-Demasters et al. 2006). Alcoholic cerebellar degeneration and its clinical correlates make alcoholism a target diagnosis for mapping functional impairment arising from regional cerebellar insult. A problem for such studies, however, arises when the assumption is made that alcoholics have cerebellar injury because both postmortem (Phillips et al. 1987; Torvik et al. 1986; Yokota et al. 2006), and in vivo (Davila et al. 1994; Sullivan and Pfefferbaum 2009) evidence indicates that cerebellar tissue damage is not necessarily present in all alcoholic-dependent individuals. Indeed, it is more likely that alcoholics who had suffered Wernicke's encephalopathy and its classical sequela, Korsakoff's syndrome, are more likely to have sustained cerebellar injury than those who had not (Harper et al. 2003a; Shear et al. 1996; Victor et al. 1989; Yokota et al. 2006). Further, the extent and involvement of cerebellar regions affected can differ across individual alcoholics (Victor et al. 1989), may be more severe in treatment-seeking than nontreatment-seeking alcoholics (cf., Fein and Landman 2005), and are dramatic in alcoholics who have sustained severe thiamine deficiency, causing Wernicke's encephalopathy (Victor et al. 1989).
An additional source of variability is sex. It remains controversial whether alcoholic brain dysmorphology is greater in men or women. The “telescoping effect” describes the phenomenon that women exhibit a similar extent of neuropathological markers as men despite lower alcohol consumption levels or shorter time alcohol dependent, typifying the drinking patterns of women (Diehl et al. 2007; Mann et al. 1992; Randall et al. 1999). A computed tomography (CT) study reported that alcoholic women develop alcoholism and brain structural and functional problems earlier in the course of alcoholism than did men yet showed the same degree of brain tissue shrinkage after a shorter disease duration and the same degree of recovery following 6 weeks of abstinence (Mann et al. 2005); neither the cerebellum nor the pons was measured. Magnetic resonance imaging (MRI) studies have also reported greater degree of volume abnormalities in alcoholic women than men relative to their sex-matched controls in structures of the supratentorium, including the corpus callosum (Hommer et al. 1996) and cortical gray matter; however, other regions, including cortical sulci, white matter, and lateral ventricles, were not disproportionately affected in alcoholic women relative to alcoholic men (Hommer et al. 2001).
Despite detection of a telescoping effect for progression and untoward consequences of alcoholism, one study reported similar treatment outcomes in alcoholic men and women matched on age, education, duration of sobriety, and alcohol consumption when corrected for body mass (Diehl et al. 2007). Not all neuroimaging studies have observed telescoping in alcoholic women (Pfefferbaum et al. 2001) and rarely have infratentorial structures—specifically, the cerebellum and pons—been considered in studies of sex differences in alcohol's effect on the brain nor have sex differences been found when sought (Mechtcheriakov et al. 2007). One study that did examine these brain structures found that in adolescents and young adults with alcohol use disorders, the young men, but not the young women, exhibited cerebellar volume deficits relative to their age- and sex-matched controls; neither men nor women in this young alcoholism group showed volume deficits in a region that included the pons and brain stem (De Bellis et al. 2005).
Here, we examined whether an infratentorial volume comprising the pons and entire cerebellum would be marked by regional tissue shrinkage measured by quantitative MRI, whether history of alcoholism would have a greater detrimental effect on middle-aged to elderly women than men, and whether tissue deficits would be related to functional impairment in postural stability. Accordingly, this controlled study used a quantitative test of ataxia (Fregly et al. 1972) to measure static and walking stability, with and without visual control, in treatment-seeking alcoholic men and women without Korsakoff's syndrome and who underwent conventional MRI.
Materials and methods
Subjects
Participants included 64 men and 31 women meeting Diagnostic and Statistical Manual of Mental Disorders, Fourth Edition, Text Revision criteria for a history of alcohol dependence (mean age 49 years) and 105 age-matched controls (50 men and 55 women) without medical or psychiatric conditions. MRI or ataxia data from smaller samples of these groups appeared in other publications (Fama et al. 2007; Sullivan et al. 2006; Sullivan et al. 2009b, c, d), but the MRI analysis presented herein is novel, and the presentation of MRI and ataxia data from this full group of 200 alcoholic and control men and women will have been presented in abstract form only (Sullivan et al. 2009a).
On average, the groups had at least 2 years of high school, although the alcoholic men and women had fewer years of education than the controls. The groups did not differ significantly, however, in socioeconomic status or premorbid intelligence as estimated from the National Adult Reading Test (NART; Nelson 1982; Table 1). The four groups were matched in handedness, and the alcoholic men and alcoholic women were matched on body mass index to their respective controls (group-by-sex analysis of variance (ANOVA): group F(1, 195)=0.517, p=0.4728; sex F(1, 195)=14.65, p=0.0002).
Table 1.
Subject characteristics of the four study groups: mean (± SD) or frequency count
| Control men | Alcoholic men | Control women | Alcoholic women | ANOVA p-value Follow-up t tests | |
|---|---|---|---|---|---|
| Sample size | 50 | 64 | 55 | 31 | |
| Age | 46.9 (13.92) | 49.7 (10.98) | 50.8 (12.07) | 47.8 (9.67) | n.s. |
| Education (years) | 16.1 (2.30) | 14.7 (2.71) | 15.5 (2.04) | 14.1 (2.00) | p=0.0005 |
| CM=CW>AM=AW | |||||
| SESa | 24.7 (14.03) | 28.8 (14.60) | 26.7 (11.08) | 32 (10.56) | n.s. |
| Handednessb | 21.5 (8.77) | 25.8 (15.45) | 22.9 (14.90) | 24.5 (13.69) | n.s. |
| Body mass index | 26.8 (4.53) | 26.9 (3.88) | 24.9 (4.50) | 23.9 (4.77) | p=0.0024 |
| CM=AM>CW=AW | |||||
| Current smokers | 8.2% | 44.4% | 0.0% | 58.1% | p=0.0001 |
| CW<CM<AM=AW | |||||
| Age of onset | – | 29.8 (11.56) | – | 29.2 (9.64) | n.s. |
| Lifetime alcohol consumption (kg) | 69.6 (81.94) | 1,021.3 (834.04) | 27.3 (31.51) | 528.6 (376.06) | p=0.0001 |
| CM=CW<AW<AM | |||||
| Days soberc | – | 76.1 (62.51) | – | 88 (106.5) | n.s. |
| NART IQd | 113.2 (6.58) | 110.4 (8.32) | 113.8 (5.51) | 114.7 (5.54) | n.s. |
SES socioeconomic status
Lower scores indicate higher SES
Right handedness=14–32; left handedness=50–70
Excluding three men and four women with outlying values; see text for full description
Only 24 control men, 39 alcoholic men, 38 control women, and 15 alcoholic women had NART scores
Following established guidelines, trained research assistants or psychologists interviewed each subject with a time-back history to obtain an estimate of lifetime alcohol consumption (Pfefferbaum et al. 1992; Skinner 1982; Skinner and Sheu 1982). The alcoholic men drank ∼15 times more than the control men, and the alcoholic women drank ∼20 times more than the control women. Length of sobriety of 61 alcoholic men ranged from 2 to 307 days; an additional three men had outlying values with reported sobriety of 463, 467, and 732 days. Median of the total group of 64 alcoholic men was 58 days. Length of sobriety of 27 alcoholic women ranged from 1 to 393 days; an additional four women had outlying values with reported sobriety of 434, 666, 720, and 754 days. Median of the total group of 31 alcoholic women was 65 days.
MRI acquisition protocol
MR imaging was conducted on a General Electric (Waukesha, MI, USA) 1.5-T whole body clinical system. Images used for quantification were acquired with a volumetric spoiled gradient recalled (SPGR) sequence (94, 2-mm-thick slices; TR/TE=25/5 ms, flip angle=30°, matrix=256×192) for morphometry and a late-echo fast spin-echo (FSE) sequence (94, 2 mm thick slices; TR/TE=11,050/98 ms, matrix=256×192) for automated fluid-tissue delineation. Before conducting quantitative analysis, images were read by a clinical neuroradiologist to identify space occupying lesions or other dysmorphology indicative of neuropathology that could interfere with morphometric analysis. Additional review of images identified studies of quality too poor for quantification.
MRI quantification
A structural mask of cerebellum and pons was defined on the SRI24 atlas (Rohlfing et al. 2010) by manual outlining. This mask was propagated to the FSE images of all subjects via registrations from the SRI24 atlas to the subject SPGR images, concatenated with the transformation from the subject SPGR to subject FSE image space. The resulting subject-space masks were then used to extract cerebellum and pons from each subject. The extracted cerebellum and pons FSE data for 66 normal controls were then used to construct a study-specific high-resolution template of pons and cerebellum for further analysis. To this end, the 66 pons and cerebellum images were coregistered using the same template-free group-wise registration algorithm that we previously applied to generate the SRI24 whole-brain atlas (Rohlfing et al. 2010).
The resulting template, which had a resolution of 0.9375 mm isotropic pixel size, was used for manual delineation of the borders of the infratentorial volume, which included the pons, cerebellar hemispheres, vermis, and cerebrospinal fluid (CSF)-filled fissures, cisterns, and fourth ventricle. Further manual delineation divided the vermis into three regions (anterior, posterior, and inferior sectors) on nine midsagittal slices (Fig. 1).
Fig. 1.
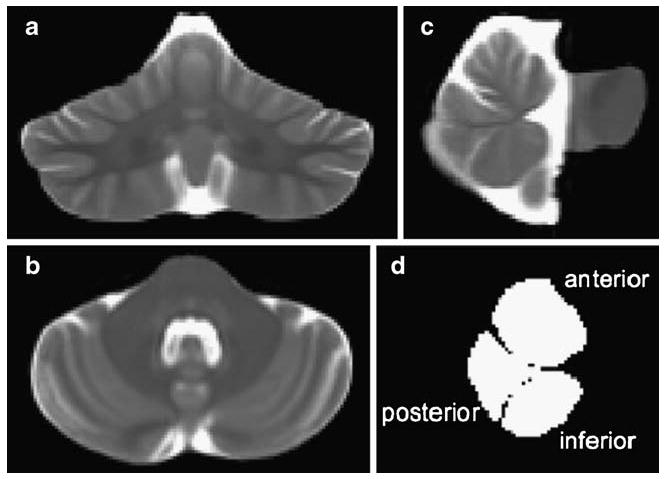
Coronal (a), axial (b), and sagittal (c) slices through the infratentorial volume from the FSE group template; d sagittal view of the region-of-interest masks for the superior, posterior, and inferior sectors of the cerebellar vermis
Each subject's extracted pons and cerebellum FSE image was finally registered via nonrigid image registration (Rohlfing and Maurer 2003) to the study-specific template, and the registration transformation was used to project the infratentorial and vermis masks from the template back into each subject's native space for fluid-tissue segmentation.
To reduce differences attributable to individual variation in volumes, especially between men and women, regional tissue volumes were expressed as ratios (or percentages) of the amount of tissue in each region of interest, i.e., [tissue/(tissue + CSF)] of the region.
Motor tests
Ataxia test
Most participants completed the Walk-a-Line Ataxia Battery (Fregly et al. 1972), which consisted of three tasks, each performed first with eyes open and then eyes closed and always with arms folded across the chest. Each condition was tested twice, unless a perfect score was achieved on the initial trial, in which case the subject received full credit on that condition. The conditions were as follows: stand heel to toe for 60 s (maximum score=120 s), walk heel to toe for ten steps (maximum score=20 steps), and stand on one foot, first the right foot and then the left, each for 30-s trials (maximum score=60 s for each foot).
Fine finger movement test
Subjects turned a knurled rod with their forefinger and thumb, unimanually and then bimanually (Corkin et al. 1986). Three, 30-s trials for each condition were administered. For correlational analyses, we reduced the data to two summary scores: the mean of the left and right unimanual conditions and the mean of the left and right bimanual conditions. This task was used solely as a motor comparison to test the selectivity of observed correlations between ataxia and regional brain volumes.
Statistical analysis
Regional brain volume ratios and ataxia scores were subjected to a series of two-way (diagnosis-by-sex) ANOVAs. Follow-up t tests identified specific group differences in brain volume or performance. Correlations between regional brain volumes and ataxia scores or alcoholism factors were tested with Pearson correlations. Multiple regression analysis was used to test for specificity of brain structure–function relationships.
Results
Group differences in regional infratentorial volumes
A two-way ANOVA, which compared the total infratentorial volume ratios, expressed as percent tissue, yielded significant effects of group (F(1, 196)=8.659, p=0.0036) and sex (F(1, 196)=5.481, p=0.0202), but not a group-by-sex interaction (F(1, 196)=1.029, p=0.3116). The infratentorial tissue ratio was ∼4% smaller in alcoholic men (76.6%) than control men (79.8%) and ∼2% smaller in alcoholic women (79.3%) than their respective control (80.8%; Fig. 2).
Fig. 2.
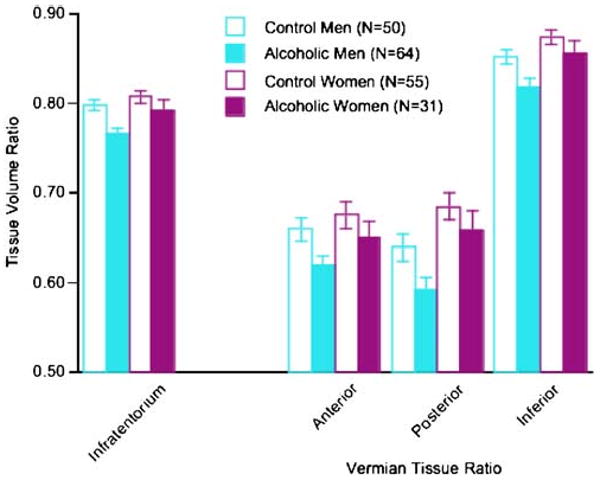
Mean±SEM of the tissue volume ratios of the four regions of interest for the four subject groups
Group-by-sex ANOVAs were conducted for the three vermian tissue ratios (Fig. 2). The group effect was significant in each of the three vermian regions (anterior F(1, 196)=5.316, p=0.0222; posterior F(1, 196)=5.001, p=0.0265; inferior F(1, 196)=6.938, p=0.0091). The sex effect was significant for the posterior (F(1, 196)=11.381, p=0.0009) and inferior (F(1, 196)=9.286, p=0.0026) but not anterior (F(1, 196)=2.58, p=0.1098) vermis. None of the group-by-sex interactions was significant. A group-by-region ANOVA comparing the alcoholic men and alcoholic women yielded a significant interaction (F(1, 186)=3.296, p=0.0392); follow-up tests indicated that the alcoholic men had disproportionately greater volume deficits than the alcoholic women in the posterior (t(93)=2.668, p=0.009) and inferior (t(93)=2.39, p=0.0189) vermian regions but not significantly in the anterior region (t(93)=1.513, p= 0.1336). Unlike the alcoholic men, the alcoholic women did not differ significantly from their controls in any regional vermian volume (anterior t(84)=1.063, p=0.291; posterior t (84)=0.984, p=0.328; inferior t(84)=1.125, p=0.2636).
We next determined the number of alcoholics whose regional infratentorial volumes fell below a defined abnormal cut point, which was 2 SD below the expected means of the controls. To establish this criterion, the regional volume ratios were transformed into age-adjusted standardized Z scores based on the full group of 105 controls. Of the 63 alcoholic men and 31 alcoholic women, 12 (19.0%) men and two (6.5%) women had volume ratios in the abnormal range for the total infratentorial region. The numbers of alcoholic men and alcoholic women falling outside the 2 SD cutoff for abnormality in the three regions of the vermis were as follows: two alcoholic men and two alcoholic women for the anterior region, 14 men and two women for the posterior region, and nine men and two women for the inferior region. No one alcoholic met the 2 SD volume deficit criterion for all four regions of interest, although five men and two women met this criterion for three of four regions.
The alcoholic men had drunk about twice as much alcohol in their lifetime (1,021 kg) as the alcoholic women (529 kg). To account for these and other factors that could contribute to the identified sex differences, we re-analyzed the brain data on subgroups of 42 alcoholic men and 23 alcoholic women matched in lifetime alcohol consumption, age of onset, duration of sobriety, and age (Table 2). Group-by-sex ANOVAs yielded significant group and sex effects in three of the four regional volume ratios: total infratentorium (group F(1, 196)=6.518, p=0.0116; sex F(1, 196)= 6.890, p=0.0095), posterior vermis (group F(11, 196)= 4.115, p=0.0441; sex F(1, 196)=8.504, p=0.004), and inferior vermis (group F(1, 196)=5.665, p=0.0184; sex F (1, 196)=5.316, p=0.0222). The exception was the anterior vermis (group F(1, 196)=3.786, p=0.0534; sex F(1, 196)= 9.718, p=0.0022). In no case was the group-by-sex interaction significant (Fig. 3). A group-by-three region ANOVA comparing the alcoholic men and alcoholic women yielded significant effects of group (F(1, 126)= 4.599, p=0.0359) and region (F(2, 126)=362.37, p= 0.0001) but no interaction (F(2, 126)=1.201, p=0.3042). Relative to the subgroup of alcoholic women, the matched alcoholic men had smaller tissue volume ratios of the infratentorium (t(63)=2.336, p=0.0227) and posterior (t(63)=2.069, p=0.0426) and inferior vermis (t(63)= 2.361, p=0.0213) but not anterior vermis (t(63)=1.485, p=0.1426).
Table 2.
Characteristics of the two matched alcoholic groups: mean (± SD) or frequency count
| Alcoholic men | Alcoholic women | t-test p value | |
|---|---|---|---|
| Sample size | 42 | 23 | |
| Age | 49.8 (11.03) | 47.7 (8.83) | n.s. |
| Education (years) | 15.0 (2.56) | 14.1 (2.20) | n.s. |
| SESa | 26.4 (13.25) | 30.4 (11.18) | n.s. |
| Handednessb | 25.5 (15.41) | 25.2 (14.59) | n.s. |
| Body mass index | 27.2 (3.51) | 23.8 (4.93) | p=0.0021 |
| Current smokers | 35.7% | 60.9% | p=0.091 |
| Age of onset | 31.1 (12.68) | 30.7 (8.81) | n.s. |
| Lifetime alcohol consumption (kg) | 630 (280.73) | 566.1 (375.63) | n.s. |
| Days sober | 89.9 (104.76) | 95.7 (110.4) | n.s. |
| NART IQc | 112.4 (7.40) | 115.1 (4.44) | n.s. |
SES socioeconomic status
Lower scores indicate higher SES
Right handedness=14–32; left handedness=50–70
Only 28 alcoholic men and 13 alcoholic women had NART scores
Fig. 3.
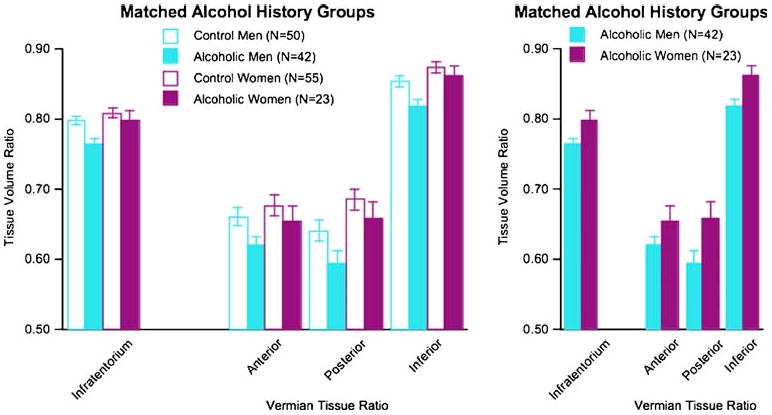
Mean±SEM of the tissue volume ratios of the four regions of interest of the subset of alcohol men and alcoholic women matched on alcohol history variables. In general, the same pattern of sex differences observed in the full group (Fig. 2) endured in the matched groups
Group differences in ataxia
One-way ANOVAs across the four groups revealed significant effects in all measures of ataxia, with and without vision (Fig. 4): stand heel-to-toe eyes open (F(3, 188)= 6.083, p=0.0006), eyes closed (F(3, 186)=4.678, p= 0.0036); walk heel-to-toe eyes open (F(3, 188)=4.551, p= 0.0042), eyes closed (F(3, 184)=6.969, p=0.0002); stand on left foot eyes open (F(3, 188)=6.747, p=0.0002), eyes closed (F(3, 185)=10.977, p=0.0001); and stand on right foot eyes open (F(3, 187)=10.035, p=0.0001), eyes closed (F(3, 184)=13.852, p=0.0001). Separate follow-up paired comparisons between alcoholic and control men and then women indicated that alcoholic men and women exhibited performance deficits in all but one measure of ataxia, with and without vision; the performance difference between alcoholic and control women did not reach significance for tandem walking with eyes open.
Fig. 4.
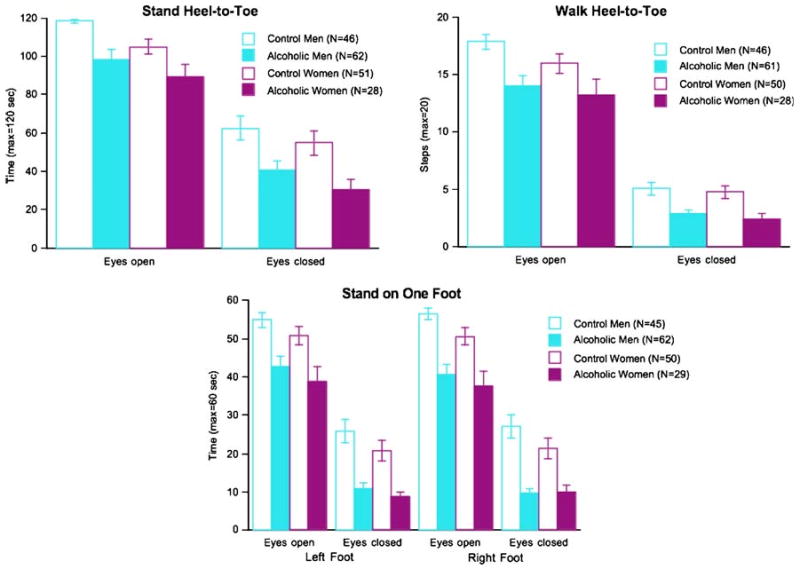
Mean±SEM of the ataxia subtest scores for the four subject groups. In all cases, the alcoholic men and the alcoholic women performed significantly below the control groups
Analogous to the brain volumes, we determined the number of alcoholics whose ataxia scores fell below a defined abnormal cut point. Each ataxia score was transformed into an age-adjusted standardized Z scores based on the group of 95–97 controls who completed each ataxia subtest. The 2 SD cutoff used for regional MRI volumes was applied to the eyes-open condition composite score (mean of Z scores across the four ataxia conditions) and identified impairment in 12 of 63 (19.0%) alcoholic men and seven of 29 (24.1%) alcoholic women with ataxia testing. For the eyes closed conditions, no alcoholic met the 2 SD impairment criterion. Consequently, we applied the less stringent cutoff of 1.5 SD below the expected means of the controls to an eyes-closed composite score of the four conditions and identified only two alcoholic men and one alcoholic woman meeting this lenient impairment criterion.
Of alcoholics matched on alcohol variables, 40 alcoholic men and 21 alcoholic women took part in ataxia testing. Re-analysis of these alcoholic subgroups and controls revealed the same pattern of performance deficits as observed in the total group. In particular, one-way ANOVAs yielded significant group effects for all eight measures: stand heel-to-toe eyes open p=0.0017, eyes closed p=0.0019; walk heel-to-toe eyes open p=0.0119, eyes closed p=0.0004; stand on left foot eyes open p= 0.001, eyes closed p=0.0001; and stand on right foot eyes open p=0.001, eyes closed p=0.0001. Follow-up tests comparing the alcoholic men and alcoholic women failed to identify any differences (p values ranged from 0.1253 to 0.8247).
Relation between infratentorial volumes and ataxia in alcoholic men and women
To reduce the number of correlations calculated to test MRI performance relations, we derived composite scores for the balance measures by taking the mean of the Z scores for the four eyes open conditions and then the mean of the Z scores for the four eyes-closed conditions. In addition, we created a total ataxia composite score from the eight Z scores. We predicted that poorer ataxia scores would be correlated with smaller regional MRI volumes. With a directional prediction, alpha for the correlations was set at p=0.034 for a family-wise Bonferroni correction for three comparisons. The most robust correlations were observed between the eyes open or total ataxia composite scores and the total infratentorial or posterior vermian ratio volume (Table 3). These correlations were observed in the alcoholic men (Fig. 5), and none of the correlations was statistically significant in the alcoholic women. Multiple regression analysis entering the total infratentorial and posterior vermian ratio volumes as predictors of the eyes open and total ataxia composite scores revealed that in both cases, only the infratentorial volume made an independent contribution to the performance prediction (eyes open ataxia p=0.0051; total ataxia p=0.0143) over and above the contribution from the posterior vermian volume (eyes open ataxia p=0.125; total ataxia p=0.3491).
Table 3.
Pearson correlation coefficient r and p values between MRI volume ratios and performance scores in alcoholic men and women
| Infratentorial ratio | Anterior vermian ratio | Posterior vermian ratio | Inferior vermian ratio | ||||||
|---|---|---|---|---|---|---|---|---|---|
| Alcoholic men | Alcoholic women | Alcoholic men | Alcoholic women | Alcoholic men | Alcoholic women | Alcoholic men | Alcoholic women | ||
| Composite ataxia scores | |||||||||
| Eyes open | r | 0.35 | 0.22 | 0.22 | 0.29 | 0.29 | 0.16 | 0.20 | 0.18 |
| p | 0.0045 | n.s. | 0.08 | n.s. | 0.0202 | n.s. | n.s. | n.s. | |
| Eyes closed | r | 0.16 | −0.03 | 0.08 | 0.01 | 0.13 | −0.15 | 0.19 | 0.02 |
| p | n.s. | n.s. | n.s. | n.s. | n.s. | n.s. | n.s. | n.s. | |
| Total | r | 0.38 | 0.28 | 0.22 | 0.32 | 0.31 | 0.18 | 0.26 | 0.23 |
| p | 0.002 | n.s. | 0.079 | 0.088 | 0.0126 | n.s. | 0.037 | n.s. | |
| Fine finger movements | |||||||||
| Unimanual | r | −0.14 | 0.001 | −0.11 | −0.002 | −0.11 | 0.05 | −0.16 | 0.01 |
| p | n.s. | n.s. | n.s. | n.s. | n.s. | n.s. | n.s. | n.s. | |
| Bimanual | r | −0.22 | 0.12 | −0.16 | 0.12 | −0.13 | 0.21 | −0.20 | 0.14 |
| p | n.s. | n.s. | n.s. | n.s. | n.s. | n.s. | n.s. | n.s. | |
Correlations marked in italics meet family-wise Bonferroni correction for three comparisons: p=0.034, one-tailed. Correlations marked in bold are significant at p=0.05, two-tailed
Fig. 5.
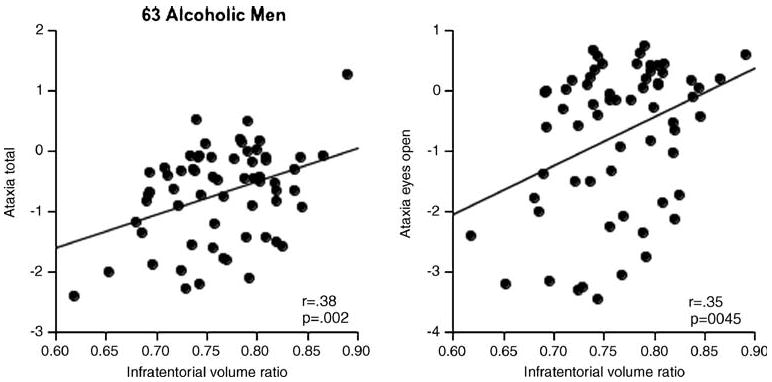
Correlations between ataxia composite scores and the total infratentorial tissue volume ratio in the 63 alcoholic men who completed MRI and ataxia testing protocols
To test the selectivity of the relation between the infratentorial volumes and ataxia, we correlated scores from the speeded finger movement task with the MRI volume ratios. Using age-adjusted Z scores, the alcoholic men, but not the alcoholic women, were impaired on the unimanual (F(3, 188)= 13.948, p=0.0001) and bimanual (F(3, 188)= 14.394, p=0.0001) components of this task. None of the correlations between these scores and the MRI volumes was significant in either the alcoholic men or the alcoholic women (Table 3).
Discussion
Alcoholic men, who were sober for weeks to months, exhibited deficits in total infratentorial tissue, which included the pons and cerebellum and regions of the cerebellar vermis. The mean regional volume deficits in the alcoholic women were on average smaller than those in the alcoholic men and were thus not disproportionately greater than those observed in the men, as would be predicted from the “telescoping” hypothesis. This pattern was present for the full groups examined—64 alcoholic men and 31 alcoholic women—and endured when subgroups of alcoholic men and women were selected to be matched in age, age of alcoholism onset, amount of alcohol consumed over a lifetime, and duration of current sobriety. Further, both alcoholic men and alcoholic women showed signs of ataxia of gait and balance.
Alcoholism and infratentorial volumes in alcoholic men and women
The infratentorial tissue ratio was ∼4% smaller in alcoholic men and ∼2% smaller in alcoholic women than their respective control groups. The alcoholic men had smaller vermian tissue volume ratios than the control men (∼5.8%), whereas the alcoholic women differed from their controls by ∼4.2%. Expression of volumes in terms of ratios of the defined infratentorial volume measured enabled direct comparison of men and women, who naturally differ systematically in intracranial and infratentorial volume (Dekaban and Sadowsky 1978; Miller and Corsellis 1977). This derived metric permitted estimation of tissue volume shrinkage for an individual with reference to an alcoholic or unaffected comparison group.
The incidence of a significant infratentorial volume deficit, defined as 2 SD from the expected age-adjusted norm, was 19% for the alcoholic men and only 6.5% for the alcoholic women in the current study. This incidence is low compared with other neuroradiological reports and postmortem studies, which may have used less stringent or qualitative criteria for determining abnormality. For example, postmortem analyses identified atrophy in the anterior vermis in 42% of alcoholics compared with 9% of controls (Torvik and Torp 1986). Another postmortem study reported significantly lower cerebellar weight and fewer Purkinje cells in the vermis of alcoholics complicated with Wernicke's encephalopathy or Korsakoff's syndrome than in uncomplicated alcoholics or controls (Harper et al. 2003a). An in vivo study of 65 patients with alcoholic cerebellar degeneration, determined with CT, reported radiological evidence for cerebellar degeneration in 51% of alcoholics, yet only 49% exhibited clinical signs of such neuropathology (Hillbom et al. 1986). Even in alcoholics with a documented history of Wernicke's encephalopathy, classical cerebellar signs including ataxia cannot necessarily be elicited (Zuccoli et al. 2009). In light of the current findings of alcoholism-related sex differences and given the preponderance of postmortem cases representing alcoholic men, postmortem study of alcoholic women could add substantially to understanding of sex-linked differences in alcoholism's untoward effects on the brain. Studies that would collect adequate antemortem data (e.g., Harper et al. 2003b) to enable correlations between clinical factors and postmortem findings (cf., Baker et al. 1999) would be particularly valuable.
Irrespective of alcohol history, the alcoholic men sustained a greater degree of brain structural deficits in all infratentorial regions measured than did the women. Thus, the alcoholic women did not display “telescoping” but rather had smaller regional tissue volume ratio deficits. Limiting this conclusion is the notorious problems with retrospective estimation of alcohol consumption, although this problem may be mitigated by assuming that men and women are similarly affected by estimation challenges. Even when telescoping is observed on some features, such as temporal development of alcohol dependence and interval between alcohol-related problems and initiation of treatment seeking, the special vulnerability of women to alcoholism does not necessarily generalize to all variables characteristically affected by alcoholism, such as treatment outcome as measured by length of sobriety (Diehl et al. 2007). Consistent with the currently observed pattern of volume deficits being associated with alcoholic men but not women is the study by De Bellis and colleagues (2005), who observed bilateral cerebellum volume deficits in adolescent and young adult alcoholic men but not women. One difference was an absence of significant effects of alcoholism on the cerebellar vermis in the young alcoholics that was observed herein in alcoholic men who were older than any of the alcoholics examined in the De Bellis study. If these divergent, age-related differences are reliable, they suggest a differential vulnerability of the vermis and lateral cerebellum, such that damage to the vermis may require an interaction with an aging brain or longer, chronic drinking, or bouts of nutritional deficiency (typically, thiamine) causing subclinical or symptomatic Wernicke's encephalopathy, which can remit without the devastating symptoms of Korsakoff's syndrome (Blansjaar and Van Dijk 1992; Harper 2006; Thomson 2000; Thomson et al. 1987; Thomson and Marshall 2006).
Ataxia, alcoholism, sex, and the brain
Tests measuring balancing with eyes open identified more alcoholics with impaired balance than tests with eyes closed. Across all eyes-open conditions, 19% of alcoholic men and 24% of alcoholic women showed at least a 2 SD deficit relative to controls. By contrast, none of the alcoholics performed at or below the 2 SD level with eyes closed. This difference in sensitivity related to test condition was likely due to a performance ceiling effect of the controls; thus, any difference from a near-perfect score would suggest impairment.
The degree of ataxia has been quantitatively related to extent of cerebellar shrinkage, especially of the vermis in alcoholic men, who as a group had significant volume deficits in the anterior vermis (Melgaard and Ahlgren 1986; Sullivan et al. 2000). In previous studies, we isolated the cerebellar hemispheres and anterior vermis in a subset of about half the men and women in this current study but failed to identify volume deficits in either alcoholic men or women. Despite the absence of evidence for tissue volume deficits in alcoholic groups compared with controls, smaller anterior vermian volumes were significant correlates of postural instability as measured with a force platform in alcoholic men (Sullivan et al. 2006) and alcoholic women (Sullivan et al. 2009c). Quantitative sway analysis afforded by the force platform procedures yielded a more refined measure of static posture than the quantitative ataxia testing used herein. The alcoholics in the later studies, who were recruited from community rehabilitation centers, may have had less regional tissue shrinkage and, as a group, had been abstinent from alcohol for longer (about 2–3 months) than the alcoholic men in the earlier studies who were recruited from inpatient alcohol programs at a US Veterans Administration hospital and examined at the end of a 28-day stay. Longitudinal MR studies report significant enlargement in the cerebellum measured with MRI (Cardenas et al. 2007) or change toward normality in metabolite levels in the vermis or cerebellar hemispheres measured with MR spectroscopy (Bendszus et al. 2001; Parks et al. 2002), and neuropsychological studies have noted substantial improvement in postural stability (Diener et al. 1984; Rosenbloom et al. 2004; Rosenbloom et al. 2007) in alcoholics who remain abstinent from alcohol. Consistent with the possibility of a graded effect on the association between severity of ataxia and vermian shrinkage is a study of a community sample of very old (age 81–97 years) nondemented men and women. In that study, greater current alcohol consumption, which did not reach levels consistent with alcohol dependence, correlated with smaller vermian areas in the men rather than the women, but neither measure was strongly or uniquely predictive of gait and balance problems assessed with tests similar to those used in the current study (Piguet et al. 2006).
Another possible substrate of ataxia, not measured herein but noted in studies of normal aging (DeCarli et al. 2005; Scheltens et al. 1993) and other studies of alcoholism (Fein et al. 2009), is degradation of white matter integrity, observed on MRI as white matter hyperintensities. The hyperintense signal arises from excessive fluid—likely interstitial—in white matter tissue occurs more frequently in elderly than young adults and is associated with hypertension and postural instability (Guttmann et al. 2000; Starr et al. 2003; Sullivan et al. 2009d; Tell et al. 1998). In recovering alcoholic men and women, poorer performance on the ataxia battery used in the present report correlated with evidence for greater compromise of fiber integrity of the genu and splenium of the corpus callosum, measured with diffusion tensor imaging (Pfefferbaum et al. 2006). Disruption of interhemispheric connectivity could diminish ability to integrate positional information required for motor coordination and stabilization correction.
The potential influence of peripheral neuropathy on alcohol-related postural instability remains in question. According to other studies, alcohol-related ataxia has been shown in some instances to be related to peripheral neuropathy (Melgaard and Ahlgren 1986), but this association has not always been forthcoming (Schroth et al. 1988) and therefore may not necessarily have accounted for the sensorimotor deficit in gait and balance observed herein.
Mechanisms of infratentorial volume shrinkage and ataxia
The most robust findings in both alcoholic men and women were volume deficits in the combined pons, cerebellar hemispheres, and vermis tissue, expressed as the ratio of one's own infratentorial tissue+CSF volume and ataxia of stance and gait, especially when tested with eyes open. Classically, ataxia has been attributed to damage of the anterior superior vermis of the cerebellum, which is measurable in terms of volume deficits in perhaps one third to one half of uncomplicated alcoholics (reviewed above) and is more likely observed and extensive in alcoholics who have suffered the complication of Wernicke's encephalopathy. The pons can also be affected in alcoholism. Although rare, central pontine myelinolysis, associated with chronic alcoholism, is a demyelinating condition of the central pons and typically attributed to rapid correction of hyponatremia or inadequate nutrition (Adams et al. 1959; Laureno and Karp 1997; Laureno and Mark 1995; Lien et al. 1990). The modest structural effects observed in both the pons and cerebellum in alcoholics may be residual signs of a previously experienced partial (cf., Sullivan and Pfefferbaum 2001) or full-blown clinical condition of Wernicke's encephalopathy or central pontine myelinolysis, reversed fully or partially with nutritional or electrolyte repletion (cf., Thomson 2000; Thomson et al. 2002) or, alternatively, the prodrome of the condition. Such a course of demise and recovery may be the foundation for the “graded effect” from uncomplicated to complicated alcoholism detected with structural MRI (Sullivan and Pfefferbaum 2009). Thus, measurement of total cerebellar and pontine tissue, as obtained in the present study, may have provided a sensitive if not specific measure of the current status of a dynamic history of alcoholism's neurotoxicity in recovering alcoholics.
Volume deficits may reflect more extreme instances of damaged microstructure or function, which may require neuroradiological methods for detection other than conventional MRI. Indeed, MR spectroscopy has been fruitful in identifying reversible compromise in cerebellar metabolite levels reflective of cellular function (Bartsch et al. 2007; cf., Meyerhoff and Durazzo 2008; Parks et al. 2002; Seitz et al. 1999). Acquisition of MRI structural data at higher field strengths (e.g., 3 T) than used herein (1.5 T) may also provide the opportunity for a more refined structural analysis of cerebellar regions that may be especially vulnerable to the throes of alcoholism and selectively affect postural stability.
Acknowledgments
Support for this work was provided by the US National Institutes of Health grants AA010723, AA017168, AA005965, and EB008381. The registration tools are available as source code in the Computational Morphometry Toolkit: http://www.nitrc.org/projects/cmtk/
Footnotes
Financial disclosures None of the authors have any conflicts to disclose.
Contributor Information
Edith V. Sullivan, Department of Psychiatry and Behavioral Sciences, School of Medicine, Stanford University, 401 Quarry Road, Stanford, CA 94305-5723, USA, edie@stanford.edu. Neuroscience Program, School of Medicine, Stanford University, Stanford, CA, USA
Torsten Rohlfing, Neuroscience Program, SRI International, Menlo Park, CA, USA.
Adolf Pfefferbaum, Department of Psychiatry and Behavioral Sciences, School of Medicine, Stanford University, 401 Quarry Road, Stanford, CA 94305-5723, USA. Neuroscience Program, SRI International, Menlo Park, CA, USA.
References
- Adams RD, Victor M, Mancall EL. Central pontine myelinolysis: a hitherto undescribed disease occurring in alcoholic and malnourished patients. Arch Neurol Psych. 1959;81:154–172. [PubMed] [Google Scholar]
- Baker K, Harding A, Halliday G, Kril J, Harper C. Neuronal loss in functional zones of the cerebellum of chronic alcoholics with and without Wernicke's encephalopathy. Neuroscience. 1999;91:429–438. doi: 10.1016/s0306-4522(98)90664-9. [DOI] [PubMed] [Google Scholar]
- Bartsch AJ, Homola G, Biller A, Smith SM, Weijers HG, Wiesbeck GA, Jenkinson M, De Stefano N, Solymosi L, Bendszus M. Manifestations of early brain recovery associated with abstinence from alcoholism. Brain. 2007;130:36–47. doi: 10.1093/brain/awl303. [DOI] [PubMed] [Google Scholar]
- Bendszus M, Weijers HG, Wiesbeck G, Warmuth-Metz M, Bartsch AJ, Engels S, Boning J, Solymosi L. Sequential MR imaging and proton MR spectroscopy in patients who underwent recent detoxification for chronic alcoholism: correlation with clinical and neuropsychological data. Am J Neuroradiol. 2001;22:1926–1932. [PMC free article] [PubMed] [Google Scholar]
- Blansjaar B, Van Dijk J. Korsakoff minus Wernicke syndrome. Alcohol Alcohol. 1992;27:435–437. [PubMed] [Google Scholar]
- Cardenas VA, Studholme C, Gazdzinski S, Durazzo TC, Meyerhoff DJ. Deformation-based morphometry of brain changes in alcohol dependence and abstinence. Neuroimage. 2007;34:879–887. doi: 10.1016/j.neuroimage.2006.10.015. [DOI] [PMC free article] [PubMed] [Google Scholar]
- Corkin S, Growdon JH, Sullivan EV, Nissen MJ, Huff FJ. Assessing treatment effects from a neuropsychological perspective. In: Poon L, editor. Handbook of clinical memory assessment in older adults. American Psychological Association; Washington: 1986. pp. 156–167. [Google Scholar]
- Davila MD, Shear PK, Lane B, Sullivan EV, Pfefferbaum A. Mammillary body and cerebellar shrinkage in chronic alcoholics: an MRI and neuropsychological study. Neuropsychology. 1994;8:433–444. [Google Scholar]
- De Bellis MD, Narasimhan A, Thatcher DL, Keshavan MS, Soloff P, Clark DB. Prefrontal cortex, thalamus, and cerebellar volumes in adolescents and young adults with adolescent-onset alcohol use disorders and comorbid mental disorders. Alcohol Clin Exp Res. 2005;29:1590–1600. doi: 10.1097/01.alc.0000179368.87886.76. [DOI] [PubMed] [Google Scholar]
- DeCarli C, Fletcher E, Ramey V, Harvey D, Jagust WJ. Anatomical mapping of white matter hyperintensities (WMH): exploring the relationships between periventricular WMH, deep WMH, and total WMH burden. Stroke. 2005;36:50–55. doi: 10.1161/01.STR.0000150668.58689.f2. [DOI] [PMC free article] [PubMed] [Google Scholar]
- Dekaban A, Sadowsky D. Changes in brain weights during the span of human life: relation of brain weights to body heights and body weights. Ann Neurol. 1978;4:345–356. doi: 10.1002/ana.410040410. [DOI] [PubMed] [Google Scholar]
- Diehl A, Croissant B, Batra A, Mundle G, Nakovics H, Mann K. Alcoholism in women: is it different in onset and outcome compared to men? Eur Arch Psychiatry Clin Neurosci. 2007;257:344–351. doi: 10.1007/s00406-007-0737-z. [DOI] [PubMed] [Google Scholar]
- Diener HC, Dichgans J, Bacher M, Guschlbauer B. Improvement in ataxia in alcoholic cerebellar atrophy through alcohol abstinence. J Neurol. 1984;231:258–262. doi: 10.1007/BF00313662. [DOI] [PubMed] [Google Scholar]
- Fama R, Eisen JC, Rosenbloom MJ, Sassoon SA, Kemper CA, Deresinski S, Pfefferbaum A, Sullivan EV. Upper and lower limb motor impairments in alcoholism, HIV-infection, and their comorbidity. Alcohol Clin Exp Res. 2007;31:1038–1044. doi: 10.1111/j.1530-0277.2007.00385.x. [DOI] [PubMed] [Google Scholar]
- Fein G, Landman B. Treated and treatment-naive alcoholics come from different populations. Alcohol. 2005;35:19–26. doi: 10.1016/j.alcohol.2004.10.007. [DOI] [PubMed] [Google Scholar]
- Fein G, Shimotsu R, Di Sclafani V, Barakos J, Harper C. Increased white matter signal hyperintensities in long-term abstinent alcoholics compared with nonalcoholic controls. Alcohol Clin Exp Res. 2009;33:70–78. doi: 10.1111/j.1530-0277.2008.00812.x. [DOI] [PMC free article] [PubMed] [Google Scholar]
- Fregly AR, Graybiel A, Smith MS. Walk on floor eyes closed (WOFEC): a new addition to an ataxia test battery. Aeros Med. 1972;43:395–399. [PubMed] [Google Scholar]
- Gilman S, Bloedel JR, Lechtenberg R. Disorders of the cerebellum. Davis; Philadelphia: 1981. [Google Scholar]
- Gilman S, Adams K, Koeppe RA, Berent S, Kluin KJ, Modell JG, Kroll P, Brunberg JA. Cerebellar and frontal hypometabolism in alcoholic cerebellar degeneration studied with positron emission tomography. Ann Neurol. 1990;28:775–785. doi: 10.1002/ana.410280608. [DOI] [PubMed] [Google Scholar]
- Guttmann CR, Benson R, Warfield SK, Wei X, Anderson MC, Hall CB, Abu-Hasaballah K, Mugler JP, 3rd, Wolfson L. White matter abnormalities in mobility-impaired older persons [in process citation] Neurology. 2000;54:1277–1283. doi: 10.1212/wnl.54.6.1277. [DOI] [PubMed] [Google Scholar]
- Harper C. Thiamine (vitamin B1) deficiency and associated brain damage is still common throughout the world and prevention is simple and safe! Eur J Neurol. 2006;13:1078–1082. doi: 10.1111/j.1468-1331.2006.01530.x. [DOI] [PubMed] [Google Scholar]
- Harper C, Dixon G, Sheedy D, Garrick T. Neuropathological alterations in alcoholic brains. Studies arising from the New South Wales Tissue Resource Centre. Prog Neuropsychopharmacol Biol Psychiatry. 2003a;27:951–961. doi: 10.1016/S0278-5846(03)00155-6. [DOI] [PubMed] [Google Scholar]
- Harper C, Garrick T, Matsumoto I, Pfefferbaum A, Sullivan EV, Adalsteinsson E, Dodd P, Lewohl J, Butterworth R. How important are brain banks for alcohol research? Alcohol Clin Exp Res. 2003b;27:310–323. doi: 10.1097/01.ALC.0000052585.81056.CA. [DOI] [PubMed] [Google Scholar]
- Hillbom M, Muuronen A, Holme L, Hindmarsh T. The clinical versus radiological diagnosis of alcoholic cerebellar degeneration. J Neurol Sci. 1986;73:45–53. doi: 10.1016/0022-510x(86)90062-6. [DOI] [PubMed] [Google Scholar]
- Hommer D, Momenan R, Rawlings R, Ragan P, Williams W, Rio D, Eckardt M. Decreased corpus callosum size among alcoholic women. Arch Neurol. 1996;53:359–363. doi: 10.1001/archneur.1996.00550040099019. [DOI] [PubMed] [Google Scholar]
- Hommer DW, Momenan R, Kaiser E, Rawlings RR. Evidence for a gender-related effect of alcoholism on brain volumes. Am J Psychiatry. 2001;158:198–204. doi: 10.1176/appi.ajp.158.2.198. [DOI] [PubMed] [Google Scholar]
- Kleinschmidt-Demasters BK, Rojiani AM, Filley CM. Central and extrapontine myelinolysis: then…and now. J Neuropathol Exp Neurol. 2006;65:1–11. doi: 10.1097/01.jnen.0000196131.72302.68. [DOI] [PubMed] [Google Scholar]
- Laureno R, Mark AS. MRI in central pontine myelinolysis. Neurology. 1995;45:1025–1026. doi: 10.1212/wnl.45.5.1026. [DOI] [PubMed] [Google Scholar]
- Laureno R, Karp BI. Myelinolysis after correction of hyponatremia. Ann Intern Med. 1997;126:57–62. doi: 10.7326/0003-4819-126-1-199701010-00008. [DOI] [PubMed] [Google Scholar]
- Lien Y, Shapiro J, Chan L. Effects of hypernatremia on organic brain osmoles. J Clin Invest. 1990;85:1427–1435. doi: 10.1172/JCI114587. [DOI] [PMC free article] [PubMed] [Google Scholar]
- Mann K, Batra A, Gunthner A, Schroth G. Do women develop alcoholic brain damage more readily than men. Alcohol Clin Exp Res. 1992;16:1052–1056. doi: 10.1111/j.1530-0277.1992.tb00698.x. [DOI] [PubMed] [Google Scholar]
- Mann KF, Ackermann K, Croissan B, Mundle G, Diehl A. Neuroimaging of gender differences in alcoholism: are women more vulnerable? Alcohol Clin Exp Res. 2005;29:896–901. doi: 10.1097/01.alc.0000164376.69978.6b. [DOI] [PubMed] [Google Scholar]
- Mechtcheriakov S, Brenneis C, Egger K, Koppelstaetter F, Schocke M, Marksteiner J. A widespread distinct pattern of cerebral atrophy in patients with alcohol addiction revealed by voxel-based morphometry. J Neurol Neurosurg Psychiatry. 2007;78:610–614. doi: 10.1136/jnnp.2006.095869. [DOI] [PMC free article] [PubMed] [Google Scholar]
- Melgaard B, Ahlgren P. Ataxia and cerebellar atrophy in chronic alcoholics. J Neurol. 1986;233:13–15. doi: 10.1007/BF00313983. [DOI] [PubMed] [Google Scholar]
- Meyerhoff DJ, Durazzo TC. Proton magnetic resonance spectroscopy in alcohol use disorders: a potential new endophenotype? Alcohol Clin Exp Res. 2008;32:1146–1158. doi: 10.1111/j.1530-0277.2008.00695.x. [DOI] [PMC free article] [PubMed] [Google Scholar]
- Miller AKH, Corsellis JAN. Evidence for secular increase in human brain weight during the past century. Ann Hum Biol. 1977;4:253–257. doi: 10.1080/03014467700007142. [DOI] [PubMed] [Google Scholar]
- Mochizuki H, Masaki T, Miyakawa T, Nakane J, Yokoyama A, Nakamura Y, Okuyama K, Kamakura K, Motoyoshi K, Matsushita S, Higuchi S. Benign type of central pontine myelinolysis in alcoholism—clinical, neuroradiological and electrophysiological findings. J Neurol. 2003;250:1077–1083. doi: 10.1007/s00415-003-0157-6. [DOI] [PubMed] [Google Scholar]
- Nelson HE. The National Adult Reading Test (NART) Nelson; Windsor: 1982. [Google Scholar]
- Newell KL, Kleinschmidt-DeMasters BK. Central pontine myelinolysis at autopsy; a twelve year retrospective analysis. J Neurol Sci. 1996;142:134–139. doi: 10.1016/0022-510x(96)00175-x. [DOI] [PubMed] [Google Scholar]
- Parks MH, Dawant BM, Riddle WR, Hartmann SL, Dietrich MS, Nickel MK, Price RR, Martin PR. Longitudinal brain metabolic characterization of chronic alcoholics with proton magnetic resonance spectroscopy. Alcohol Clin Exp Res. 2002;26:1368–1380. doi: 10.1097/01.ALC.0000029598.07833.2D. [DOI] [PubMed] [Google Scholar]
- Pfefferbaum A, Lim KO, Zipursky RB, Mathalon DH, Rosenbloom MJ, Lane B, Ha CN, Sullivan EV. Brain gray and white matter volume loss accelerates with aging in chronic alcoholics: a quantitative MRI study. Alcohol Clin Exp Res. 1992;16:1078–1089. doi: 10.1111/j.1530-0277.1992.tb00702.x. [DOI] [PubMed] [Google Scholar]
- Pfefferbaum A, Rosenbloom MJ, Deshmukh A, Sullivan EV. Sex differences in the effects of alcohol on brain structure. Am J Psychiatry. 2001;158:188–197. doi: 10.1176/appi.ajp.158.2.188. [DOI] [PubMed] [Google Scholar]
- Pfefferbaum A, Adalsteinsson E, Sullivan EV. Dysmorphology and microstructural degradation of the corpus callosum: interaction of age and alcoholism. Neurobiol Aging. 2006;27:994–1009. doi: 10.1016/j.neurobiolaging.2005.05.007. [DOI] [PubMed] [Google Scholar]
- Phillips SC, Harper CG, Kril J. A quantitative histological study of the cerebellar vermis in alcoholic patients. Brain. 1987;110:301–314. doi: 10.1093/brain/110.2.301. [DOI] [PubMed] [Google Scholar]
- Piguet O, Cramsie J, Bennett HP, Kril JJ, Lye TC, Corbett AJ, Hayes M, Creasey H, Broe GA. Contributions of age and alcohol consumption to cerebellar integrity, gait and cognition in nondemented very old individuals. Eur Arch Psychiatry Clin Neurosci. 2006;256:504–511. doi: 10.1007/s00406-006-0671-5. [DOI] [PubMed] [Google Scholar]
- Randall CL, Roberts JS, Del Boca FK, Carroll KM, Connors GJ, Mattson ME. Telescoping of landmark events associated with drinking: a gender comparison. J Stud Alcohol. 1999;60:252–260. doi: 10.15288/jsa.1999.60.252. [DOI] [PubMed] [Google Scholar]
- Rohlfing T, Maurer CR. Nonrigid image registration in shared-memory multiprocessor environments with application to brains, breasts, and bees. IEEE Trans Inf Technol Biomed. 2003;7:16–25. doi: 10.1109/titb.2003.808506. [DOI] [PubMed] [Google Scholar]
- Rohlfing T, Zahr NM, Sullivan EV, Pfefferbaum A. The SRI24 multichannel atlas of normal adult human brain structure. Hum Brain Mapp. 2010 doi: 10.1002/hbm.20906. in press. [DOI] [PMC free article] [PubMed] [Google Scholar]
- Rosenbloom MJ, Pfefferbaum A, Sullivan EV. Recovery of short-term memory and psychomotor speed but not postural stability with long-term sobriety in alcoholic women. Neuropsychology. 2004;18:589–597. doi: 10.1037/0894-4105.18.3.589. [DOI] [PubMed] [Google Scholar]
- Rosenbloom MJ, Rohlfing T, O'Reilly A, Sassoon SA, Pfefferbaum A, Sullivan EV. Improvement in memory and static balance with abstinence in alcoholic men and women: selective relations with changes in regional ventricular volumes. Psychiatry Research: Neuroimaging. 2007;155:91–102. doi: 10.1016/j.pscychresns.2006.12.019. [DOI] [PMC free article] [PubMed] [Google Scholar]
- Scheltens P, Barkhof F, Leys D, Pruvo JP, Nauta JJP, Vermersch P, Steinling M, Valk J. A semiquantitative rating scale for the assessment of signal hyperintensities on magnetic resonance imaging. J Neurol Sci. 1993;114:7–12. doi: 10.1016/0022-510x(93)90041-v. [DOI] [PubMed] [Google Scholar]
- Schroth G, Naegele T, Klose U, Mann K, Petersen D. Reversible brain shrinkage in abstinent alcoholics, measured by MRI. Neuroradiology. 1988;30:385–389. doi: 10.1007/BF00404102. [DOI] [PubMed] [Google Scholar]
- Seitz D, Widmann U, Seeger U, Nagele T, Klose U, Mann K, Grodd W. Localized proton magnetic resonance spectroscopy of the cerebellum in detoxifying alcoholics. Alcohol Clin Exp Res. 1999;23:158–163. [PubMed] [Google Scholar]
- Shear PK, Sullivan EV, Lane B, Pfefferbaum A. Mammillary body and cerebellar shrinkage in chronic alcoholics with and without amnesia. Alcohol Clin Exp Res. 1996;20:1489–1495. doi: 10.1111/j.1530-0277.1996.tb01153.x. [DOI] [PubMed] [Google Scholar]
- Skinner HA. Development and validation of a lifetime alcohol consumption assessment procedure. Addiction Research Foundation; Toronto: 1982. [Google Scholar]
- Skinner HA, Sheu WJ. Reliability of alcohol use indices: the lifetime drinking history and the MAST. J Stud Alcohol. 1982;43:1157–1170. doi: 10.15288/jsa.1982.43.1157. [DOI] [PubMed] [Google Scholar]
- Slager UT. Central pontine myelinolysis and abnormalities in serum sodium. Clin Neuropathol. 1986;5:252–256. [PubMed] [Google Scholar]
- Starr JM, Leaper SA, Murray AD, Lemmon HA, Staff RT, Deary IJ, Whalley LJ. Brain white matter lesions detected by magnetic resonance imaging are associated with balance and gait speed. J Neurol Neurosurg Psychiatry. 2003;74:94–98. doi: 10.1136/jnnp.74.1.94. [DOI] [PMC free article] [PubMed] [Google Scholar]
- Strub MU, Steck AJ, Fuhr P. Asymptomatic central pontine myelinolysis. Neurology. 1999;53:914. doi: 10.1212/wnl.53.5.914. [DOI] [PubMed] [Google Scholar]
- Sullivan EV, Pfefferbaum A. Magnetic resonance relaxometry reveals central pontine abnormalities in clinically asymptomatic alcoholic men. Alcohol Clin Exp Res. 2001;25:1206–1212. [PubMed] [Google Scholar]
- Sullivan EV, Pfefferbaum A. Neuroimaging of the Wernicke–Korsakoff syndrome. Alcohol Alcohol. 2009;44:155–165. doi: 10.1093/alcalc/agn103. [DOI] [PMC free article] [PubMed] [Google Scholar]
- Sullivan EV, Deshmukh A, Desmond JE, Lim KO, Pfefferbaum A. Cerebellar volume decline in normal aging, alcoholism, and Korsakoff's syndrome: relation to ataxia. Neuropsychology. 2000;14:341–352. doi: 10.1037//0894-4105.14.3.341. [DOI] [PubMed] [Google Scholar]
- Sullivan EV, Rose J, Pfefferbaum A. Effect of vision, touch, and stance on cerebellar vermian-related sway and tremor: a quantitative MRI and physiological study. Cereb Cortex. 2006;16:1077–1086. doi: 10.1093/cercor/bhj048. [DOI] [PubMed] [Google Scholar]
- Sullivan EV, Rohlfing T, Pfefferbaum A. Pontocerebellar volume deficits in alcoholic men but not women: relation to ataxia (abs). Annual Meeting of the American College of Neuropsychopharmacology; Hollywood, FL. 2009a. [Google Scholar]
- Sullivan EV, Rose J, Pfefferbaum A. Mechanisms of postural control in alcoholic men and women: biomechanical analysis of musculoskeletal coordination during quiet standing. Alcohol Clin Exp Res. 2009b Dec 18; doi: 10.1111/j.1530-0277.2009.01118.x. Epub. [DOI] [PMC free article] [PubMed] [Google Scholar]
- Sullivan EV, Rose J, Pfefferbaum A. Physiological and focal cerebellar substrates of abnormal postural sway and tremor in alcoholic women. Biol Psychiatry. 2009c Sep 25; doi: 10.1016/j.biopsych.2009.08.008. Epub. [DOI] [PMC free article] [PubMed] [Google Scholar]
- Sullivan EV, Rose J, Rohlfing T, Pfefferbaum A. Postural sway reduction in aging men and women: Relation to brain structure, cognitive status, and stabilizing factors. Neurobiol Aging. 2009d;30:793–807. doi: 10.1016/j.neurobiolaging.2007.08.021. [DOI] [PMC free article] [PubMed] [Google Scholar]
- Tell GS, Lefkowitz DS, Diehr P, Elster AD. Relationship between balance and abnormalities in cerebral magnetic resonance imaging in older adults. Arch Neurol. 1998;55:73–79. doi: 10.1001/archneur.55.1.73. [DOI] [PubMed] [Google Scholar]
- Thomson AD. Mechanisms of vitamin deficiency in chronic alcohol misusers and the development of the Wernicke–Korsakoff syndrome. Alcohol Alcohol Suppl. 2000;35:2–7. doi: 10.1093/alcalc/35.supplement_1.2. [DOI] [PubMed] [Google Scholar]
- Thomson AD, Marshall EJ. The natural history and pathophysiology of Wernicke's encephalopathy and Korsakoff's psychosis. Alcohol Alcohol. 2006;41:151–158. doi: 10.1093/alcalc/agh249. [DOI] [PubMed] [Google Scholar]
- Thomson AD, Jeyasingham MD, Pratt OE, Shaw GK. Nutrition and alcoholic encephalopathies. Acta Medica Scandinavica Suppl. 1987;717:55–65. doi: 10.1111/j.0954-6820.1987.tb13042.x. [DOI] [PubMed] [Google Scholar]
- Thomson AD, Cook CC, Touquet R, Henry JA. The Royal College of Physicians report on alcohol: guidelines for managing Wernicke's encephalopathy in the accident and emergency department. Alcohol Alcohol. 2002;37:513–521. doi: 10.1093/alcalc/37.6.513. [DOI] [PubMed] [Google Scholar]
- Torvik A, Torp S. The prevalence of alcoholic cerebellar atrophy: a morphometric and histological study of an autopsy material. J Neurol Sci. 1986;75:43–51. doi: 10.1016/0022-510x(86)90049-3. [DOI] [PubMed] [Google Scholar]
- Torvik A, Torp S, Lindboe CF. Atrophy of the cerebellar vermis in aging: a morphometric and histologic study. J Neurol Sci. 1986;76:283–294. doi: 10.1016/0022-510x(86)90176-0. [DOI] [PubMed] [Google Scholar]
- Victor M, Adams RD, Collins GH. The Wernicke–Korsakoff syndrome and related neurologic disorders due to alcoholism and malnutrition. 2nd. Davis; Philadelphia: 1989. [Google Scholar]
- Yokota O, Tsuchiya K, Terada S, Oshima K, Ishizu H, Matsushita M, Kuroda S, Akiyama H. Frequency and clinicopathological characteristics of alcoholic cerebellar degeneration in Japan: a cross-sectional study of 1, 509 postmortems. Acta Neuropathol. 2006;112:43–51. doi: 10.1007/s00401-006-0059-7. [DOI] [PubMed] [Google Scholar]
- Zuccoli G, Santa Cruz D, Bertolini M, Rovira A, Gallucci M, Carollo C, Pipitone N. MR imaging findings in 56 patients with Wernicke encephalopathy: nonalcoholics may differ from alcoholics. AJNR Am J Neuroradiol. 2009;30:171–176. doi: 10.3174/ajnr.A1280. [DOI] [PMC free article] [PubMed] [Google Scholar]