Abstract
Fatty liver is commonly associated with insulin resistance and type 2 diabetes, but it is unclear whether triacylglycerol accumulation or an excess flux of lipid intermediates in the pathway of triacyglycerol synthesis are sufficient to cause insulin resistance in the absence of genetic or diet-induced obesity. To determine whether increased glycerolipid flux can, by itself, cause hepatic insulin resistance, we used an adenoviral construct to overexpress glycerol-sn-3-phosphate acyltransferase-1 (Ad-GPAT1), the committed step in de novo triacylglycerol synthesis. After 5–7 days, food intake, body weight, and fat pad weight did not differ between Ad-GPAT1 and Ad-enhanced green fluorescent protein control rats, but the chow-fed Ad-GPAT1 rats developed fatty liver, hyperlipidemia, and insulin resistance. Liver was the predominant site of insulin resistance; Ad-GPAT1 rats had 2.5-fold higher hepatic glucose output than controls during a hyperinsulinemic-euglycemic clamp. Hepatic diacylglycerol and lysophosphatidate were elevated in Ad-GPAT1 rats, suggesting a role for these lipid metabolites in the development of hepatic insulin resistance, and hepatic protein kinase Cε was activated, providing a potential mechanism for insulin resistance. Ad-GPAT1-treated rats had 50% lower hepatic NF-κB activity and no difference in expression of tumor necrosis factor-α and interleukin-β, consistent with hepatic insulin resistance in the absence of increased hepatic inflammation. Glycogen synthesis and uptake of 2-deoxyglucose were reduced in skeletal muscle, suggesting mild peripheral insulin resistance associated with a higher content of skeletal muscle triacylglycerol. These results indicate that increased flux through the pathway of hepatic de novo triacylglycerol synthesis can cause hepatic and systemic insulin resistance in the absence of obesity or a lipogenic diet.
Hepatic steatosis, an increasingly common health concern, is associated with obesity, insulin resistance, type 2 diabetes, and cardiovascular disease (1–4). Despite the association of hepatic steatosis with insulin resistance, and the amelioration of hepatic triacylglycerol accumulation with improved insulin sensitivity, it is still unclear whether insulin resistance causes the increase in hepatic triacylglycerol or whether the increase in glycerolipid intermediates or triacylglycerol itself plays a causal role in hepatic or systemic insulin resistance (5–11). Most animal models of hepatic steatosis and insulin resistance have been created through high-fat or high-sucrose feeding or through genetic disruption of insulin or leptin signaling pathways. Diet-induced hepatic steatosis, however, is not a good model for isolating the role of the liver in the pathogenesis of insulin resistance because high-fat diets cause weight gain and obesity, which independently contribute to the development of systemic insulin resistance. Systemic deficiencies in leptin or insulin signaling also cause obesity by increasing centrally mediated food intake. An animal model that isolates the accumulation of triacylglycerol in liver from its accumulation in other tissues may provide a better understanding of the role of hepatic lipid synthesis or accumulation in the development of hepatic and peripheral insulin resistance.
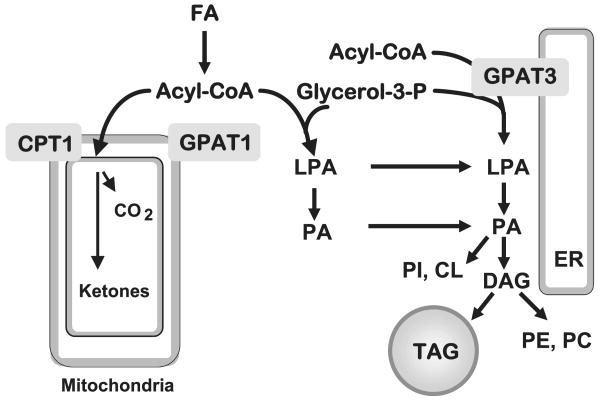
Acyl-CoA:glycerol-3-phosphate acyltransferase (GPAT)4 is the committed step in the de novo synthesis of TAG and glycerophospholipids (12). GPAT esterifies fatty acids to glycerol 3-phosphate at the sn-1 position, forming lysophosphatidic acid (LPA) (Fig. 1). Three different isoenzymes of GPAT have been described, one located in the endoplasmic reticulum (GPAT3), and two located in the outer mitochondrial membrane (GPAT1 and GPAT2) (13–15, 51). GPAT2 and GPAT3 activities are sensitive to N-ethylmaleimide (NEM), whereas GPAT1 is not. GPAT1 activity accounts for 30–50% of total liver GPAT activity, but is only 10% of total GPAT activity in other tissues (12). Unlike GPAT2 and -3, GPAT1 is transcriptionally regulated by carbohydrate re-feeding via carbohydrate-responsive elements and by insulin via sterol response element-binding protein-1c, suggesting that glycerolipid metabolism can be regulated through changes in GPAT1 expression in response to altered nutrient availability (16–18).
FIGURE 1. Pathway of de novo glycerolipid synthesis.
GPAT isoforms located in mitochondria (GPAT1) and endoplasmic reticulum (ER) (GPAT3) catalyze the initial step in the synthesis of TAG. Acyl-CoA use for β-oxidation or TAG synthesis is regulated reciprocally by carnitine palmitoyltransferase-1 (CPT-1) and GPAT1. LPA, phosphatidic acid (PA), and DAG, TAG, phosphatidylethanolamine (PE), phosphatidylcholine (PC), and fatty acid (FA) were used.
Recent studies in primary hepatocytes demonstrated that overexpression of GPAT1 primarily directs exogenous fatty acids away from β-oxidation and toward DAG and TAG rather than phospholipid synthesis (19, 20). Conversely, when GPAT1 is absent, mice are protected from high-fat diet-induced hepatic steatosis and insulin resistance (21, 22). These studies suggest that GPAT1 plays an important role in the regulation of hepatic TAG accumulation, and that the synthesis of this TAG pool can affect hepatic insulin sensitivity.
To determine whether an increase in hepatic TAG and the synthesis of its glycerolipid precursors leads to hepatic and systemic insulin resistance in the absence of obesity, we targeted the overexpression of GPAT1 to the liver using an adenoviral-GPAT1 construct (Ad-GPAT1). Because GPAT1 is a key enzyme in the pathway of de novo TAG synthesis, we expected to induce hepatic steatosis without the need to feed a lipogenic diet. Also, because GPAT1 specific activity is elevated in livers from mice with diet-induced obesity and from ob/ob mice with leptin deficiency, overexpression of GPAT1 is a realistic model for the hepatic steatosis observed in insulin-resistant animals (19). The accumulation or increased flux of lipid metabolites in the glycerolipid synthetic pathway, including acyl-CoAs, LPA, and DAG, have been implicated in the development of insulin resistance (23–29). We hypothesized that hepatic overexpression of GPAT1 would cause both lipid metabolites and TAG to accumulate and increase hepatic insulin resistance in the absence of obesity or high-fat feeding.
Materials and Methods
Recombinant Adenoviruses
The construction and generation of recombinant GPAT1-FLAG adenovirus and Ad-EGFP have been described previously (20). These viruses were plaque purified and then further amplified and purified for injection into rats by previously described methods (30, 31).
Animal Experiments
All procedures involving animals were approved by the Duke University or Vanderbilt University Institutional Animal Care and Use Committees. Male Wistar rats (300–350 g; Charles River) were housed in individual cages with a 12-h light cycle and given free access to standard chow (Harlan Teklad 7001, Harlan Teklad Laboratories). Rats received a single dose (1.0 × 10¹² or 2.0 × 10¹² particles/ml/300 g body weight) of Ad-GPAT1 or Ad-EGFP adenoviruses by tail-vein injection. Rats were given a dose (15 mg/kg body weight) of cyclosporine the day before and the day of the virus administration to minimize the immune response. Food consumption and body weight were monitored daily. Five to 7 days after virus injection, food was withdrawn 4 h before collection of blood by heart puncture of anesthetized animals. Tissues were collected by clamp freezing and stored at −80 °C.
Hyperinsulinemic-Euglycemic Clamp Experiments
Hyperinsulinemic-euglycemic clamp studies were performed as described previously with the following modifications (31). Male Wistar rats (300 g body weight) were anesthetized with sodium pentobarbital (50 mg/kg), and catheters were implanted in the carotid artery, external jugular vein, and ileal vein. After surgery, the rats recovered for 2 weeks, then, Ad-GPAT1 or Ad-EGFP virus was injected through the tail vein at 1.0–2.0 × 10¹² particles/ml 7 days before the clamp study. At −150 min a bolus of [3-3H]glucose (15 μCi/kg) was administered followed by a constant infusion of labeled glucose (0.15 μCi/kg/min). Somatostatin was infused at 3 μg/kg/min, and glucagon and insulin were infused at 2.6 ng/kg/min and 3 milliunits/kg/min, respectively, to maintain plasma glucagon and insulin levels at ∼40 pg/ml (arterial plasma) and ∼3 ng/ml (arterial plasma), respectively. 2-Deoxy-[14C]Glucose (50 μCi/rat) was administered through the carotid arterial catheter at 120 min during the clamp. During the clamp, blood glucose was monitored every 10 min via carotid arterial catheter samples. Plasma glucose, [3H]H2O, [3-3H]glucose, and 2-deoxy-[14C]glucose were measured to determine glucose disposal rate, hepatic glucose output, and the glycolytic rate. Liver and skeletal muscle glycogen content and 3H radioactivity in glycogen was measured to analyze glycogen synthesis. Skeletal muscle 2-deoxy-[14C]glucose-6-phosphate was measured to determine glucose uptake.
Measurement of Plasma Metabolic Variables
Plasma TAG concentrations were measured using an enzymatic colorimetric assay kit (Stanbio Laboratory). Plasma cholesterol levels were measured using the Cholesterol CII kit (Wako Chemicals). Plasma alanine aminotransferase, aspartate aminotransferase, glucose, and β-hydroxybutyrate concentrations were measured using kits from Stanbio Laboratory. Fatty acid concentrations were measured using a kit from Roche. Plasma insulin and leptin levels were measured by radioimmunoassay (Linco). Very low density and high density plasma lipoprotein fractions were isolated from 100 μl of total plasma using fast protein liquid chromatography with a Superose 6 HR10/30 column (GE Healthcare). Triglyceride and cholesterol contents of plasma fractions were determined using the colorimetric kits described above.
Membrane Isolation and Measurement of GPAT1 Activity
Liver tissue was homogenized in Medium I (250 mm sucrose, 10 mm Tris, pH 7.4, 1 mm EDTA, and 1 mm dithiothreitol) with 10 up-and-down strokes in a Teflon-glass motor-driven homogenizer. Homogenates were centrifuged at 100,000 × g for 1 h to obtain the total membrane fraction. The membrane pellet was re-homogenized in Medium I and stored in 100-μl aliquots at −80 °C for the enzyme assay. GPAT1 specific activity was assayed at room temperature in a 200-μl reaction mixture containing 75 mm Tris-HCl, pH 7.5, 4 mm MgCl2, 1 mg/ml bovine serum albumin (essentially fatty acid-free), 1 mm dithiothreitol, 8 mm NaF, 800 μm [3H]glycerol 3-phosphate, and 80 μm palmitoyl-CoA (14). The reaction was initiated by adding 10–30 μg of total membrane protein to the assay mixture after incubating the membrane protein on ice for 15 min in the presence or absence of 1 mm NEM. GPAT1 activity is calculated as the activity that is uninhibited by NEM.
Western Blot
GPAT1-FLAG and EGFP expression were determined in liver (and muscle) total particulate fractions by Western blot using a mouse monoclonal anti-FLAG antibody (Clone M2, Sigma) and a monoclonal anti-EGFP antibody (ab3277, Abcam Inc.). Phosphoenolpyruvate carboxykinase (PEPCK) protein expression was determined in rat liver samples using a rabbit polyclonal anti-PEPCK (Santa Cruz) antibody.
Tissue Triglyceride and Glycogen Content
Liver, muscle, or heart tissue (100 mg) was homogenized in water and lipids were extracted into CHCl3 (32), dried in a SpeedVac, and resuspended in 1 ml of CHCl3. A fraction of the original lipid extract (50 μl for liver and 200 μl for heart or muscle) was dried and resuspended in 100 μl of isopropyl alcohol, 1% Triton X-100 at room temperature for 1 h. The TAG content of 10–30 μl of the lipid sample was determined using an enzymatic colorimetric method (Stanbio Laboratory). Liver glycogen content was measured using an amyloglycosidase-based assay (33).
Mass Spectrometric Analysis of Liver Lipid Contents
The extraction procedures for acyl-CoA, LPA, and DAG species were performed as described previously (22). To extract acyl-CoA, ∼100 mg of liver was homogenized with a 17:0-CoA internal standard. Acyl-CoAs were purified using Oligonucleotide Purification Cartridges (Applied Biosystems) and were slowly eluted with 60% acetonitrile. For LPA measurements, ∼100 mg of liver was homogenized in chloroform/methanol (1:1, v/v) with 1 nm C17:0-lysophosphatidic acid as the internal standard. Samples were homogenized and centrifuged twice, each time with chloroform/methanol (1:1, v/v). The supernatants were combined and mixed with dH2O to obtain an aqueous phase. The aqueous phase was then mixed with dH2O and applied to conditioned Waters Oasis MAX extraction cartridges (Waters Corp.). After a washing step, LPA and phosphatidic acid species were eluted with methanol for LC/MS/MS analysis. Different LPA species were separated with an HPLC Betasil C18 Dash HTS column (Thermo Electron Corp.) using varying gradients of solutions A (95% dH2O, 5% acetonitrile, 2 mm ammonium acetate) and B (95% acetonitrile, 5% dH2O, 2 mm ammonium acetate).
For DAG, ∼100 mg of liver tissue was homogenized in ice-cold CHCl3/methanol (2:1, v/v) containing 0.01% butylated hydroxytoluene and internal standards for 1,3-dipentadecanoin and 1,2,3-triheptadecanoate. Organic and aqueous phases were separated by adding CHCl3 and H2O. After centrifugation, the organic layer was collected, dried under nitrogen flow, and reconstituted with hexane/methylene chloride/ether (89/10/1, v/v). DAG was separated from TAG with preconditioned columns (Waters SepPak Cartridge WAT020845) and eluted with hexane/ethyl acetate (85/15, v/v) under a low negative pressure.
Lipid metabolite extracts were subjected to LC/MS/MS analysis. A turbo ionspray source was interfaced with an API 3000 tandem mass spectrometer (Applied Biosystems) in conjunction with two PerkinElmer 200 Series micropumps and a 200 Series autosampler (PerkinElmer). Total acyl-CoA, LPA, phosphatidic acid, and DAG content were expressed as the sum of individual species.
Quantitative Reverse Transcriptase-PCR
RNA was extracted from 0.02 g of frozen liver tissue using the RNeasy Mini spin column kit (Qiagen Inc.) in combination with DNase digest treatment. Quantitative real-time reverse transcriptase-PCR for IL-1β, PEPCK, Glc-6-Pase, and TNF-α were performed using an ABI PRISM 7500 Sequence Detection System instrument and TaqMan® Universal PCR Master Mix (Applied Biosystems, Inc.) with Invitrogen Moloney murine leukemia virus reverse transcriptase. Reactions were performed in triplicate. Target gene expression was normalized to β-actin expression. All data were quantified using the relative standard curve method as described in Applied Biosystems User Bulletin No. 2.
NF-κB Activity
Liver (100 mg) was homogenized in 400 μl of Dignam A buffer (10 mm HEPES, pH 7.5, 1.5 mm MgCl2, 10 mm KCl, 0.5 mm dithiothreitol, and Sigma Protease Inhibitor mixture, 100 μl/10 ml buffer) in a glass Dounce homogenizer. Homogenates were left on ice for 20 min, then 40 μl of 10% Nonidet P-40 was added, and homogenates were vortexed for 15 s. Cytoplasmic extracts were collected after the homogenates were centrifuged at 4,500 × g for 3 min at 4 °C. The pellets were washed twice in Dignam A buffer. Nuclear membranes were disrupted with 100 μl of Dignam C buffer (10 mm HEPES, pH 7.5, 25% glycerol, 420 mm NaCl, 1.5 mm MgCl2, 1 mm EDTA, 0.5 mm dithiothreitol, and Sigma Protease Inhibitor mixture, 100 μl/10 ml buffer) on ice for 15 min. Nuclear extracts were collected after centrifugation at 14,000 × g for 5 min to pellet the DNA. NF-κB binding activity was determined using the TransAM™ NF-κB p65 Transcription Factor Assay ELISA kit (Active Motif). 25 μg of liver nuclear extract was used in each well.
PKCε Activity
PKCε membrane translocation assays were performed according to methods previously described (40, 50). Briefly, 50 μg of crude membrane and cytosol protein extracts were resolved by SDS-PAGE using an 8% gel and electrotransferred onto polyvinylidene difluoride. Membranes were immunoblotted with a rabbit anti-peptide antibody against PKCε (Santa Cruz Biotechnology), diluted 1:100 in rinsing solution. PKCε translocation was expressed as the ratio of arbitrary units of membrane bands over cytosol bands. Protein bands were quantified using a Bio-Rad Chemidoc SRX and Quantity One Software (Bio-Rad).
Statistics
Data were analyzed by Student's t test or Kruskal-Wallis analysis of variance with Dunn multiple comparison post-test. Data are shown as mean ± S.E.
Results
Liver-specific Overexpression of GPAT1
To examine the effects of GPAT1 overexpression on hepatic lipid metabolism, chow-fed Wistar rats were studied 5–7 days after treatment with 1.0–2.0 × 10¹² particles/ml of Ad-GPAT1 or Ad-EGFP virus. The recombinant adenovirus employed direct expression of a FLAG-tagged version of GPAT, allowing specific detection of the overexpressed protein in virus-transduced tissues. Rats treated with Ad-GPAT1 had 2.7-fold higher liver NEM-resistant GPAT1 activity than rats treated with Ad-EGFP virus (Fig. 2A). No increase in NEM-resistant GPAT1 activity was detected in epididymal fat from Ad-GPAT1-treated rats (Ad-EGFP, 0.36 ± 0.1, and Ad-GPAT1, 0.41 ± 0.1 nmol/min/mg protein; n = 6). GPAT1-FLAG expression was detected in liver but not in skeletal muscle or heart from Ad-GPAT1-treated rats and no GPAT1-FLAG was detected in liver from Ad-EGFP-treated rats (Fig. 2B). EGFP expression was detected in liver by Western blot in all Ad-EGFP-treated rats (data not shown). Plasma alanine aminotransferase levels were within the normal range in both Ad-GPAT1- and Ad-EGFP-treated rats, and alanine aminotransferase values did not differ between groups, indicating that viral treatments did not cause significant cytotoxic effects (Table 1).
FIGURE 2. GPAT1 activity and expression in rat liver.
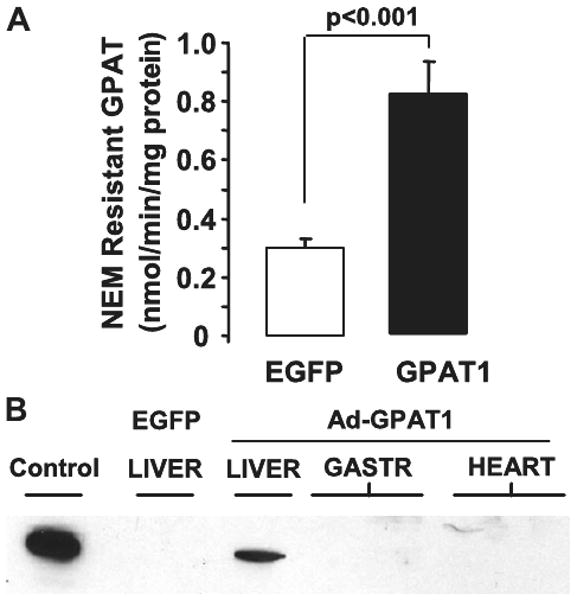
Rats were treated with 1.0–2.0 × 10¹² particles/ml of Ad-GPAT1 or Ad-EGFP virus for 5–7 days (Ad-EGFP, n = 9; Ad-GPAT1, n = 11). A, GPAT1 enzyme activity was determined in total liver membranes after inhibiting endoplasmic reticulum GPAT with NEM. Results are expressed as mean ± S.E. B, anti-FLAG Western blot of total membranes from primary hepatocytes infected with Ad-GPAT1 (Control), from liver of a rat infected with Ad-EGFP (EGFP), and from liver, gastrocnemius muscle (2 lanes), and heart (2 lanes) of rats infected with Ad-GPAT.
TABLE 1. Physiologic and plasma measurements.
Rats were treated with 1.0–2.0 × 10¹² particles/ml of Ad-GPAT1 or Ad-EGFP virus for 5–7 days and fasted for 4 h before samples were collected. Results are expressed as mean ± S.E.
| EGFP | GPAT | |
|---|---|---|
| Physiologic parameters after 4 h fast | ||
| Body weight (g) | 342 ± 8 | 329 ± 6 |
| Food intake/day | 26.5 ± 1.7 | 24.1 ± 1.2 |
| Liver weight (g) | 15.8 ± .05 | 16.5 ± 0.7 |
| Liver weight (% of body wt) | 4.6 ± 0.1 | 5.0 ± 0.1 |
| Liver glycogen (μg/mg protein) | 23 ± 2 | 17 ± 3a |
| Epididymal fat weight (g) | 3.6 ± 0.2 | 3.3 ± 0.1 |
| Epididymal fat weight (% of body wt) | 1.0 ± 0.1 | 1.0 ± 0.1 |
| Plasma parameters after 4 h fast | ||
| Alanine aminotransferase (units/liter) | 67 ± 19 | 47 ± 7 |
| Triacylglycerol (mg/dl) | 179 ± 28 | 472 ± 97a |
| Cholesterol (mg/dl) | 91 ± 7 | 103 ± 7 |
| Fatty acid (μm) | 120 ± 0.0 | 190 ± 30b |
| β-Hydroxybutyrate (mg/dl) | 2.0 ± 0.2 | 2.1 ± 0.1 |
| Blood glucose (mg/dL)c | 128 ± 4 | 118 ± 3b |
| Insulin (ng/ml) | 4.5 ± 0.4 | 3.4 ± 0.5 |
| Insulin/glucose ratio | 0.035 ± 0.004 | 0.029 ± 0.004 |
| Leptin (ng/ml) | 3.4 ± 0.6 | 2.4 ± 0.5 |
| TNF-α (pg/ml) | 77 ± 14 | 50 ± 14 |
| IL-6 (pg/ml) | 27 ± 11 | 38 ± 9 |
| IL-1β (pg/ml) | 15 ± 4 | 24 ± 4 |
p < 0.01; 4-h fast (Ad-EGFP, n = 9; Ad-GPAT, n = 11).
p < 0.05.
After an overnight fast, the glucose values were 127.4 ± 4.5 (Ad-EGFP, n = 8) and 126.2 ± 4.7 (Ad-GPAT1, n = 8), and the insulin values were 0.76 ± 0.19 (Ad-EGFP, n = 8) and 0.93 ± 0.1 (Ad-GPAT, n = 8).
Hepatic Overexpression of GPAT1 Causes Hepatic Steatosis, Hypertriglyceridemia, and Muscle TAG Accumulation
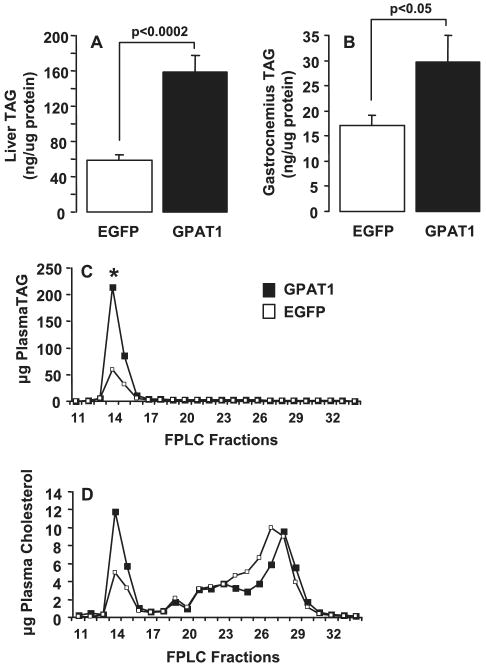
Overexpression of GPAT1 increased hepatic TAG content 2.7-fold (Fig. 3A). Thus, GPAT1 appeared to increase hepatic glycerolipid synthesis. The hepatic steatosis observed in Ad-GPAT1-treated rats was accompanied by a 2.6-fold increase in total plasma TAG concentration (Table 1). TAG content in plasma VLDL fractions was 4-fold higher in Ad-GPAT1-treated rats (Fig. 3C). Although total plasma cholesterol content did not change with Ad-GPAT1 treatment (Table 1), VLDL cholesterol was 2.5-fold higher in Ad-GPAT1-treated rats, whereas the LDL cholesterol concentration was slightly lower (Fig. 3D). These data suggested that GPAT1 directs the synthesis of a TAG pool that is available for both cytosolic storage and secretion in VLDL. To determine whether the increase in plasma TAG in Ad-GPAT-1-treated rats was due to an increase in secretion of VLDL particles or to an increase in TAG incorporation into VLDL particles, VLDL apoB100 and apoB48 levels were determined by SDS-PAGE analysis of VLDL lipoprotein fractions. No differences in apoB100 or apoB48 protein levels were observed (data not shown), suggesting that the increase in VLDL TAG was due to an increased amount of TAG incorporated into each particle rather than an increase in the number of VLDL particles secreted. These results are similar to those observed in mice treated with Ad-GPAT1, which had increased TAG secretion with no increases in plasma apoB concentration (37).
FIGURE 3. Liver, skeletal muscle, and VLDL TAG content was increased in Ad-GPAT1-treated rats.
Rats were treated with 1.0–2.0 × 10¹² particles/ml of Ad-GPAT1 or Ad-EGFP virus for 5–7 days and fasted for 4 h before tissue collection. Ad-EGFP, n = 9. and Ad-GPAT1, n = 11, for liver and gastrocnemius. Results are expressed as mean ± S.E. A, liver TAG. B, gastrocnemius muscle TAG. Plasma lipoprotein fractions were separated by fast protein liquid chromatography. Triglyceride and cholesterol are reported as averages (EGFP, n = 4; GPAT, n = 6). C, VLDL TAG (fraction 14; * p < 0.05). D, VLDL cholesterol (fraction 14; p < 0.06).
In addition to increased TAG content in liver and plasma, gastrocnemius muscle in Ad-GPAT1-treated rats contained more TAG (Fig. 3B), and soleus muscle (EGFP 94.6 ± 37.6; GPAT 185.7 ± 54.0 ng/μg of protein, p = 0.25) and heart muscle (EGFP 14.5 ± 1.4; GPAT 21.2 ± 2.4 ng/μg protein, p = 0.07) also had a trend toward higher TAG content in Ad-GPAT1-treated rats. Elevated plasma TAG and fatty acid concentrations may have contributed to this peripheral TAG accumulation (Table 1). The high circulating plasma TAG concentration did not appear to affect adipose tissue, as body weight and fat pad weights of Ad-GPAT1 and Ad-EGFP-treated rats did not differ (Table 1). Additionally, there were no differences in food intake or plasma leptin concentrations between groups, suggesting that hepatic GPAT1 overexpression did not alter satiety or adipokine production (Table 1).
Ad-GPAT1-treated Rats Were Insulin Resistant
Because hepatic steatosis, hypertriglyceridemia, and peripheral TAG accumulation often accompany insulin resistance, we proposed that Ad-GPAT1-treated rats would be less insulin sensitive than Ad-EGFP-treated rats. Although insulin to glucose ratios between the two groups did not differ, Ad-GPAT1-treated rats had a lower liver glycogen content after a 4-h fast, suggesting that Ad-GPAT1-treated rats might have hepatic insulin resistance (Table 1). To measure insulin sensitivity, we performed hyperinsulinemic-euglycemic clamp studies. Ad-GPAT1-treated rats maintained euglycemia with a 40% lower rate of glucose infusion during clamp experiments compared with Ad-EGFP-treated rats (Fig. 4A), confirming whole body insulin resistance.
FIGURE 4. Ad-GPAT1-treated rats were insulin resistant.
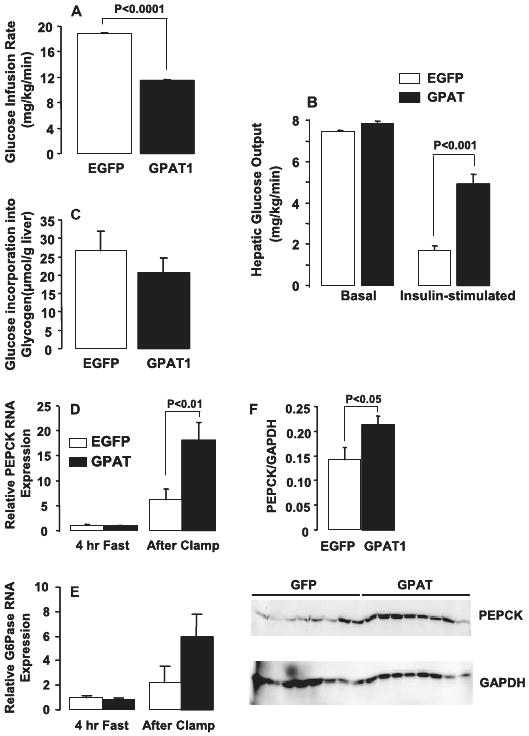
Rats were treated with 1.0–2.0 × 10¹² particles/ml of Ad-GPAT1 or Ad-EGFP virus for 7 days and food-deprived for 24 h before hyperinsulinemic-euglycemic clamp experiments (Ad-EGFP, n = 8; Ad-GPAT1, n = 8). A, glucose infusion rate. B, basal and insulin-stimulated hepatic glucose output. C, glucose incorporation into liver glycogen (p = 0.36). D, PEPCK and, E, Glc-6-Pase mRNA expression were measured in liver from Ad-GPAT1-treated rats fasted for 4 h or fasted for 24 h followed by hyperinsulinemic-euglycemic clamps for 3 h. PEPCK mRNA expression after clamp (n = 6). Glc-6-Pase mRNA expression after clamp (p = 0.33) (n = 6). F, PEPCK protein expression after clamp (n = 8).
Basal hepatic glucose output was slightly elevated in Ad-GPAT1-treated rats (Fig. 4B). During the clamp procedure, insulin suppressed hepatic glucose output 77% in Ad-EGFP-treated rats, but only 37% in Ad-GPAT-treated rats, indicating that the livers of Ad-GPAT1-treated rats were insulin resistant (Fig. 4B). Although the amount of glucose incorporated into liver glycogen was 22% lower in Ad-GPAT1-treated rats, the difference was not significant (Fig. 4C). To confirm that the increase in glucose production was due to increased hepatic gluconeogenesis, we examined hepatic PEPCK and glucose-6-phosphatase (Glc-6-Pase) expression after the clamp procedure. Liver PEPCK mRNA and protein levels were 3- and 1.6-fold higher, respectively, in Ad-GPAT1-treated rats (Fig. 4, D and F). Although hepatic Glc-6-Pase mRNA expression was 2.7-fold higher in Ad-GPAT1-treated rats after the clamp, the difference was not significant (Fig. 4E).
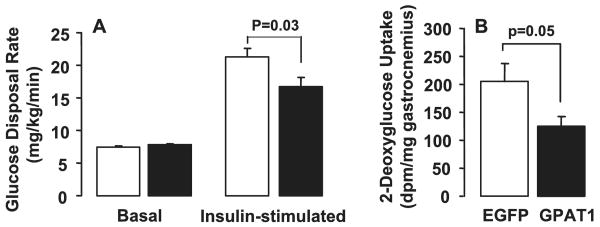
Basal glucose disposal rates were similar in Ad-GPAT1- and Ad-EGFP-treated rats (Fig. 5A). During the clamp, insulin elevated the glucose disposal rate 3-fold in Ad-EGFP-treated rats, but only 2-fold in Ad-GPAT1-treated rats, indicating that hepatic overexpression of GPAT1 reduced peripheral insulin sensitivity. Hepatic overexpression of GPAT1 also lowered 2-deoxyglucose uptake into gastrocnemius muscle by 40%, suggesting reduced uptake of glucose by skeletal muscle (Fig. 5, A and B). The 175% increase in gastrocnemius TAG content observed in Ad-GPAT1-treated rats may have contributed to altered insulin sensitivity (Fig. 3B). In other muscles examined, the differences in 2-deoxyglucose uptake did not reach significance, but uptake into Ad-GPAT soleus muscle was reduced 30% (EGFP, 809 ± 121; GPAT, 563 ± 84, p = 0.12), and glucose incorporation into Ad-GPAT vastus lateralis muscle glycogen was reduced 58% (EGFP, 27.4 ± 8.1; GPAT, 11.6 ± 1.7, p = 0.07). These data, taken together, with the marked reduction in gastrocnemius uptake of glucose, suggest that hepatic overexpression of GPAT1 reduces glucose metabolism and insulin sensitivity in skeletal muscle.
FIGURE 5. Skeletal muscle glucose metabolism was impaired in Ad-GPAT1-treated rats.
Rats were food deprived for 24 h before hyperinsulinemic-euglycemic clamp experiments. A, basal and insulin-stimulated hepatic glucose disposal rates. B, 2-deoxyglucose uptake in gastrocnemius muscle. Ad-EGFP, n = 8; Ad-GPAT1, n = 8.
Elevated Hepatic DAG Contributes to Hepatic Insulin Resistance through Activation of PKCε
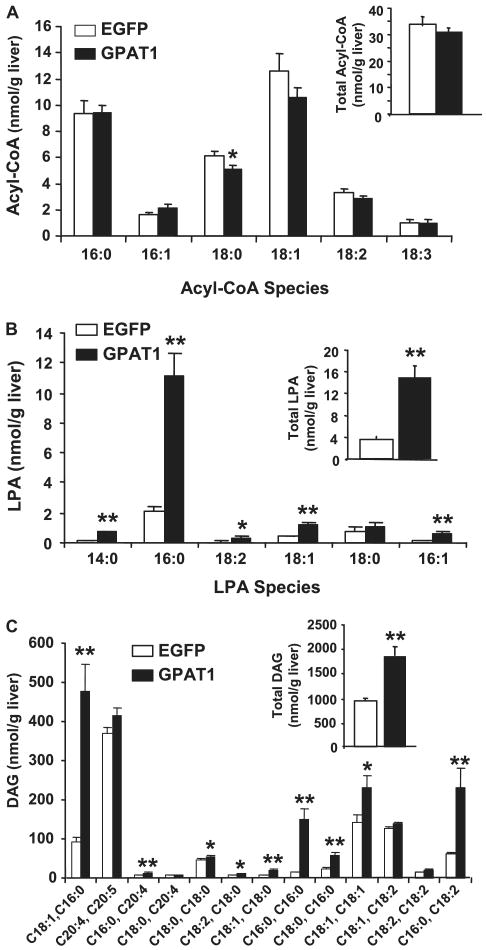
Hepatic steatosis is often present in animals with insulin resistance, but the link between increased hepatic TAG accumulation and reduced hepatic insulin sensitivity is not completely understood. It has been hypothesized that lipid metabolites accumulate in the liver in conjunction with increased TAG synthesis and act in signaling pathways to disrupt insulin responses. For example, DAG and acyl-CoA accumulation accompany insulin resistance in muscle and liver (23–29). GPAT1−/− mice fed a high-fat safflower oil diet for 3 weeks were protected from diet-induced insulin resistance and had an increased hepatic content of acyl-CoA, decreased content of DAG, and less activation of PKCε (22). To determine whether overexpression of GPAT1 would lead to the opposite changes in hepatic lipid intermediates, we measured the content of LPA, DAG, and acyl-CoA in livers from Ad-GPAT1- and Ad-EGFP-treated rats. Total hepatic LPA content was elevated 4-fold in Ad-GPAT1-treated rats, 16:0-LPA was elevated 5-fold, and other hepatic LPA species (14:0-, 18:1-, and 16:1-LPA species) were elevated to a lesser extent compared with Ad-EGFP-treated rats (Fig. 6A). Total hepatic acyl-CoA content, however, did not differ between Ad-GPAT1 and Ad-EGFP-treated rats, although the hepatic content of 18:0-CoA was lower (Fig. 6B). Hepatic DAG content was elevated 2-fold in Ad-GPAT1-treated rats (Fig. 6C). The most prominent elevations were in DAG species that contained palmitate (16:0–18:1, 16:0–16:0, and 16:0–18:2), but several DAG species containing oleate and stearate were also elevated compared with Ad-EGFP-treated rats (Fig. 6C). Despite elevated amounts of DAG species containing 18:1, hepatic stearoyl-CoA desaturase-1 expression was similar in Ad-GPAT1- and Ad-EGFP-treated rats (Table 2).
FIGURE 6. Hepatic lipid metabolites were altered in Ad-GPAT1-treated rats.
Rats were treated with 1.0–2.0 × 10¹² particles/ml Ad-GPAT1 or Ad-EGFP for 5–7 days and food deprived 4 h before tissues were collected. Liver lipid metabolites were measured by mass spectrometry. A, total acyl-CoA content (inset) and acyl-CoA species (18:0-CoA, *, p < 0.03). B, total LPA content (inset) (**, p < 0.001) and LPA species (*, p < 0.01; **, p < 0.001). C, total DAG (inset) (**, p < 0.001) and DAG species (*, p < 0.05) (**, p < 0.001). Ad-EGFP, n = 9; Ad-GPAT1, n = 11.
TABLE 2. Hepatic gene expression.
Rats were treated with 1.0–2.0 × 10¹² particles/ml of Ad-GPAT1 or Ad-EGFP virus for 5–7 days and fasted for 4 h before livers were collected. Results were expressed as mean ± S.E.
| Gene expression after 4 h fast | EGFP (n = 5) | GPAT (n = 5) |
|---|---|---|
| SCD-1a | 1.0 ± 0.2 | 0.8 ± 0.1 |
| TNF-α | 1.0 ± 0.2 | 0.9 ± 0.2 |
| IL-1β | 1.0 ± 0.2 | 1.0 ± 0.3 |
Stearoyl-CoA desaturase-1.
In liver from insulin-resistant rodents DAG accumulation has been associated with increased PKCε activity and defects in insulin stimulation of IRS-2 tyrosine phosphorylation (27). Because high-fat fed GPAT1−/− mice had lower hepatic PKCε activity (22), we measured PKCε activity in liver from Ad-GPAT1 and Ad-EGFP-treated rats to determine whether elevated DAG could be causing insulin resistance in Ad-GPAT1-treated rats through this mechanism. Membrane-associated activated PKCε was 30% higher in liver from Ad-GPAT1-treated rats (Fig. 7), suggesting that PKCε activation could have contributed to the insulin resistance observed in Ad-GPAT1-treated rats.
FIGURE 7. Hepatic PKCε activity was elevated in Ad-GPAT1-treated rats.
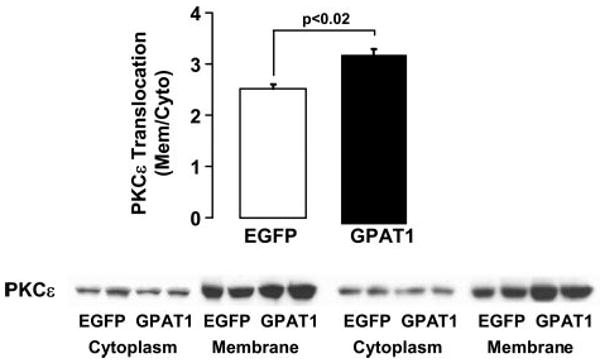
Rats were treated with 1.0–2.0 × 10¹² particles/ml Ad-GPAT1 or Ad-EGFP for 5–7 days and fasted for 4 h before tissues were collected. Liver cytosolic and membrane fractions were isolated, and the amount of PKCε in each fraction was determined by Western blot. Ad-EGFP, n = 4; Ad-GPAT1, n = 4.
Hepatic Inflammation Did Not Contribute to Insulin Resistance in Ad-GPAT1-treated Rats
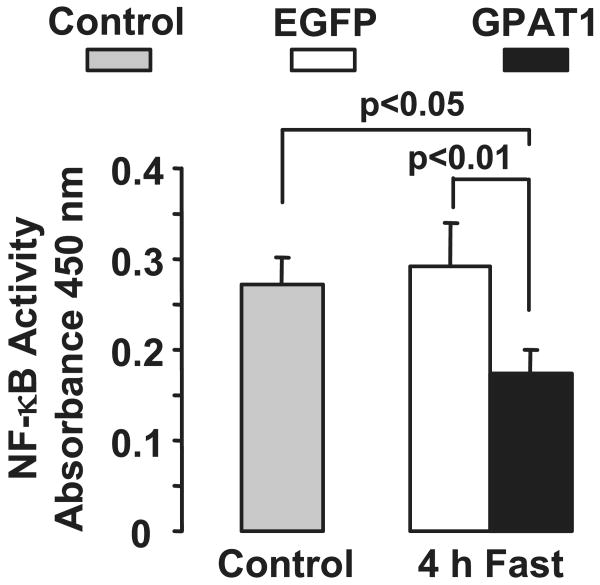
Because recent studies of insulin resistance have focused on the role of the immune system in the development of hepatic insulin resistance, we measured plasma cytokine levels and hepatic NF-κB activity. Plasma IL-1β, IL-6, and TNFα concentrations did not differ between Ad-GPAT1-treated and Ad-EGFP-treated rats (Table 1), and hepatic expression of TNF-α and IL-β did not differ between groups (Table 2). Additionally, hepatic NF-κB activity was 50% lower in Ad-GPAT1-treated rats compared with Ad-EGFP-treated rats and untreated controls, indicating that hepatic overexpression of GPAT1 caused insulin resistance in the absence of increased hepatic inflammation (Fig. 8).
FIGURE 8. NF-κB activity was lower in Ad-GPAT1-treated rats.
Rats were treated with 1.0–2.0 × 10¹² particles/ml Ad-GPAT1 or Ad-EGFP for 5–7 days. Tissues were collected after a 4-h fast and NF-κB activity was measured in rat liver nuclear extracts with an enzyme-linked immunosorbent assay kit. Control (non-viral), n = 4; after a 4-h fast, Ad-EGFP, n = 19; Ad-GPAT1. n = 21. Results are presented as mean ± S.E.
Discussion
The major finding of this study was that overexpressing GPAT1 in liver caused hepatic steatosis and hepatic insulin resistance in the absence of obesity or high-fat feeding. Surprisingly, TAG also accumulated in gastrocnemius muscle, in concert with development of insulin resistance in that tissue, possibly secondary to the increase in circulating VLDL-TAG and free fatty acid. GPAT is the committed step in glycerolipid synthesis, and GPAT1, normally up-regulated by sterol response element-binding protein-1c under conditions in which lipogenesis is enhanced, appears to control the amount of TAG synthesized, even when food intake or composition is not altered.
Hyperinsulinemic-euglycemic clamp studies confirmed that insulin resistance had developed in Ad-GPAT1-treated rats within 5–7 days of adenovirus treatment. In the Ad-GPAT1-treated rats, 40% less glucose was required to maintain euglycemia than in the control rats, and hepatic glucose output was 2.7-fold higher during the clamp, consistent with severely reduced hepatic insulin sensitivity. The increased gluconeogenesis in Ad-GPAT1-treated rats was associated with elevated PEPCK mRNA and protein expression. Although hepatic glycogen content was significantly lower in Ad-GPAT1-treated rats after a 4-h fast, hepatic glycogen synthesis was not suppressed during the clamp. These results suggest that GPAT1 overexpression impaired insulin suppression of gluconeogenesis but had little effect on insulin-stimulated glycogen synthesis.
In addition to causing profound insulin resistance in liver, GPAT1 overexpression in liver also resulted in a lower insulin-stimulated systemic glucose disposal rate and less uptake of glucose into gastrocnemius muscle. These data are consistent with a decreased rate of muscle glucose metabolism and suggest that hepatic GPAT1 overexpression increased peripheral insulin resistance. Although the uptake of 2-deoxyglucose was not statistically different in two other muscles, it is possible that hepatic overexpression of GPAT1 for a longer period than 7 days might lead to more severe peripheral insulin resistance. Peripheral insulin resistance was associated with increases in the TAG content of skeletal and heart muscle. Because Ad-GPAT1 was not expressed in these tissues, it is likely that the increase in intramuscular TAG content resulted from the elevated plasma VLDL-TAG and fatty acid available for muscle uptake and storage. Elevated plasma lipids can lead to TAG accumulation and insulin resistance in skeletal muscle (7, 34–36). Ad-GPAT1-treated rats ate the same amount of food, gained the same amount of weight as Ad-EGFP-treated controls, and did not show differences in epididymal fat pad mass or plasma leptin concentrations. Thus, alterations in body fat mass did not contribute to the systemic insulin resistance observed in Ad-GPAT1-treated rats.
What caused hepatic insulin resistance when GPAT1 was overexpressed? The frequent association of insulin resistance with TAG accumulation in liver and other tissues suggests that TAG or a related lipid metabolite antagonizes pathways of insulin signaling. Consistent with this idea, experimental lowering of liver TAG content in other rodent models results in amelioration of hepatic and peripheral insulin resistance (22, 31). Hepatic overexpression of GPAT1 increased liver TAG content 2.7-fold, and dramatically increased the intracellular content of immediate and downstream products of GPAT1, LPA, and DAG. In primary rat hepatocytes treated with Ad-GPAT1 and in livers from mice treated with Ad-GPAT1, we and others reported an increase in fatty acid incorporation into DAG and an increase in DAG content (19, 20, 37). In the present study, the enrichment of 16:0 species in both LPA and DAG reflects the preferred 16:0-CoA substrate of GPAT1 (12) and strongly suggests that both metabolites were derived from de novo synthesis rather than from the hydrolysis of membrane phospholipids.
LPA is well recognized as a ligand for G-protein-coupled LPA receptors that stimulate cell growth (38), and extracellular LPA, acting via LPA receptors on adipocytes, inactivates glycogen synthase kinase 3 in a phosphatidylinositol 3-kinase independent manner (39). Thus, extracellular LPA signaling could enhance glycogen synthesis independent of insulin signaling, but we observed a decrease rather than an increase in hepatic glycogen content in Ad-GPAT-treated animals in the current study. Moreover, there are no known inhibitory effects of extracellular or intracellular LPA on insulin signaling pathways. DAG accumulation, however, and its concomitant activation of PKC isoforms has been implicated in the development of insulin resistance in skeletal muscle and liver (40, 41), and the activation of PKCε and PKCδ has been implicated in hepatic insulin resistance (27, 42, 43). Furthermore, mice deficient in GPAT1 have a lower hepatic DAG content than wild type controls and are protected via a PKCε-mediated mechanism from high-fat diet-induced insulin resistance (22). In the current study, PKCε activity was 30% higher in the livers of Ad-GPAT1-treated rats compared with control livers. PKCε interacts with the insulin receptor and prevents tyrosine phosphorylation of IRS-2, thereby blocking insulin signaling upstream of IRS-2 (43). High-fat feeding of wild type mice disrupts insulin stimulation of IRS-2-associated phosphatidylinositol 3-kinase activity, but this pathway was maintained in GPAT1−/− mice, as was insulin-stimulated suppression of hepatic gluconeogenesis (22). Thus, the failure of insulin to suppress hepatic PEPCK gene expression and gluconeogenesis in Ad-GPAT1-treated rats may be due to PKCε-mediated inhibition of IRS-2-associated phosphatidylinositol 3-kinase activity.
SCD1 catalyzes the desaturation of 18:0 to 18:1, and reduced expression of SCD1, which was observed in GPAT1−/− mice (37, 44), is associated with decreased hepatic TAG synthesis (45, 46). In diet-induced obesity, SCD1 expression may be required for the development of hepatic insulin resistance (47). Although low compared with the 16:0 species, 18:1 species of LPA and DAG were 40% higher in Ad-GPAT1-treated rats, similar to a report of Ad-GPAT overexpression in mice in which SCD1 mRNA expression increased 10-fold (37). In our study, however, no difference was observed in stearoyl-CoA desaturase 1 mRNA expression in Ad-GPAT1 and Ad-EGFP rats, indicating that stearoyl-CoA desaturase 1 had not influenced insulin resistance.
Although overexpression of GPAT1 in primary hepatocytes did not increase the amount of [14C]fatty acid that was incorporated into media TAG (19, 20), the amount of TAG in plasma did increase when GPAT1 was overexpressed in mice or rats. In mice treated with Ad-GPAT1, the rate of TAG secretion increased 86% (37), and, similarly, we found that in Ad-GPAT1-treated rats plasma TAG was 2.6-fold higher than in controls, and that there was a large increase of TAG in the VLDL fraction. These data suggest that the pool of TAG synthesized by GPAT1 is available both for storage and for incorporation into VLDL. Because the amount of apoB in Ad-GPAT-treated mouse plasma (37) or in VLDL from Ad-GPAT-treated rats did not differ from controls, it is likely that GPAT1 overexpression increased the amount of TAG incorporated into VLDL but not the number of VLDL particles secreted. Although total plasma cholesterol content was not elevated in Ad-GPAT1-treated rats, plasma cholesterol was redistributed away from HDL and into the VLDL fraction.
Several recent studies have implicated hepatic NF-κB activity, hepatocellular inflammatory pathways, and elevated hepatic expression of IL-1β, TNF-α, and IL-6 in the development of hepatic insulin resistance (48, 49). However, compared with Ad-EGFP-treated rats, hepatic NF-κB activity was not elevated in Ad-GPAT1-treated rats, and neither hepatic expression of IL-1β and TNF-α nor plasma cytokine concentrations differed. These data show that, at least over the short time frame of the current study (7 days), the fatty liver induced by GPAT1 overexpression did not cause hepatic inflammation and inflammatory cytokines did not contribute to insulin resistance in this model.
The accumulation of glycerolipid metabolites has been implicated in the pathogenesis of hepatic insulin resistance, but a causal relationship has not been clearly established. Interpretation of most animal models of hepatic steatosis and insulin resistance is complicated by underlying obesity, genetically induced over feeding, lipodystrophy, or alterations in adipokine production. In our study, GPAT1 overexpression enhanced de novo glycerolipid synthesis in rat liver and caused hepatic steatosis, hypertriglyceridemia, and both hepatic and peripheral insulin resistance in the absence of obesity, high-fat feeding, or elevated inflammatory markers. These data support the idea that liver lipid metabolism itself can play a central role in the development of both hepatic and systemic insulin resistance. Hepatic insulin resistance was associated with an elevated hepatic content of LPA, DAG, and TAG, as well as increased PKCε activation, whereas peripheral insulin resistance was associated with excess TAG storage in muscle. Further study of the regulation of hepatic de novo glycerolipid synthesis and of the role of glycerolipid intermediates as intracellular signaling molecules promises a better understanding of the mechanisms involved in lipid-mediated hepatic insulin resistance. Enzymes in the pathway of glycerolipid biosynthesis may prove to be therapeutic targets for hepatic insulin resistance and type 2 diabetes.
Footnotes
This work was supported in part by National Institutes of Health Grants DK56598 (to R. A. C.), DK-58398 (to C. B. N.), DK60667 (to M. S.), DK-40936 (to G. I. S.), U24 DK59635, and P30 DK34987, and by an award from the American Heart Association, Mid-Atlantic Affiliate (to C. A. N.).
The abbreviations used are: GPAT, glycerol-3-phosphate acyltransferase; DAG, diacylglycerol; EGFP, enhanced green fluorescent protein; Glc-6-Pase, glucose-6-phosphatase; LPA, lysophosphatidic acid; NEM, N-ethylmaleimide; PEPCK, phosphoenolpyruvate carboxykinase; PKCε, protein kinase Cε; TAG, triacylglycerol; VLDL, very low density lipoprotein; IL, interleukin; TNFα, tumor necrosis factor α; LC, liquid chromatography; MS, mass spectrometry; Ad-GPAT1, adenoviral-GPAT1; IRS-2, insulin receptor substrate-2.
References
- 1.Marchesini G, Bugianesi E, Forlani G, Lenzi M, Manini R, Naale S, Banni E, Villanova N, Melchionda N, Rizzetto M. Hepatology. 2002;37:917–923. doi: 10.1053/jhep.2003.50161. [DOI] [PubMed] [Google Scholar]
- 2.Reusch J. Am J Cardiol. 2002;90(suppl):19G–26G. doi: 10.1016/s0002-9149(02)02555-9. [DOI] [PubMed] [Google Scholar]
- 3.Chitturi S, Abeygunasekera S, Farrell GC, Holmes-Walker J, Hui JM, Fung C, Karim R, Lin R, Smarasinghe D, Liddle C, Weltman M, George J. Hepatology. 2001;35:373–379. doi: 10.1053/jhep.2002.30692. [DOI] [PubMed] [Google Scholar]
- 4.Younossi ZM, Diehl AM, Ong JP. Hepatology. 2002;35:746–752. doi: 10.1053/jhep.2002.32483. [DOI] [PubMed] [Google Scholar]
- 5.Den Boer M, Voshol PJ, Kuipers F, Havekes LM, Romijin JA. Arterioscler Thromb Vasc Biol. 2004;24:644–649. doi: 10.1161/01.ATV.0000116217.57583.6e. [DOI] [PubMed] [Google Scholar]
- 6.Turinsky J, O'Sullivan DM, Bayly BP. J Biol Chem. 1990;265:16880–16885. [PubMed] [Google Scholar]
- 7.Haluzik M, Colombo C, Gavrilova O, Chua S, Wold N, Chen M, Stannard B, Dietz KR, Le Roith D, Reitman ML. Endocrinology. 2004;145:3258–3264. doi: 10.1210/en.2004-0219. [DOI] [PubMed] [Google Scholar]
- 8.Kim JK, Fillmore JJ, Chen Y, Yu C, Moore IK, Pypaert M, Lutz EP, Kako Y, Belez-Carrasco W, Goldberg IJ, Breslow JL, Shulman GI. Proc Natl Acad Sci U S A. 2001;98:7522–7527. doi: 10.1073/pnas.121164498. [DOI] [PMC free article] [PubMed] [Google Scholar]
- 9.Goudriaan JR, Dahlmans VE, Teusink B, Ouwens DM, Febbraio M, Maassen JA, Romijn JA, Havekes LM, Voshol PJ. J Lipid Res. 2003;44:2270–2277. doi: 10.1194/jlr.M300143-JLR200. [DOI] [PubMed] [Google Scholar]
- 10.Onishi Y, Honda M, Ogihara T, Sakoda H, Anai M, Fujishiro M, Ono H, Shojima N, Fukushima Y, Inkukai K, Katagiri H, Kikuchi M, Oka Y, Asano T. Biochem Biophys Res Commun. 2003;303:788–794. doi: 10.1016/s0006-291x(03)00407-8. [DOI] [PubMed] [Google Scholar]
- 11.Ide T, Tsunoda M, Mochizuki T, Murakami K. Med Sci Monit. 2004;10:BR388–BR395. [PubMed] [Google Scholar]
- 12.Coleman RA, Lee DP. Prog Lipid Res. 2004;43:134–176. doi: 10.1016/s0163-7827(03)00051-1. [DOI] [PubMed] [Google Scholar]
- 13.Bhat BG, Wang P, Kim JH, Black TM, Lewin TM, Fiedorek TF, Coleman RA. Biochim Biophys Acta. 1999;1439:415–423. doi: 10.1016/s1388-1981(99)00103-1. [DOI] [PubMed] [Google Scholar]
- 14.Coleman RA, Haynes EB. J Biol Chem. 1983;258:450–465. [PubMed] [Google Scholar]
- 15.Lewin TM, Schwerbrock NMJ, Lee DP, Coleman RA. J Biol Chem. 2004;279:13488–13495. doi: 10.1074/jbc.M314032200. [DOI] [PubMed] [Google Scholar]
- 16.Jerkins AA, Liu WR, Lee S, Sul HS. J Biol Chem. 1995;270:1416–1421. doi: 10.1074/jbc.270.3.1416. [DOI] [PubMed] [Google Scholar]
- 17.Shin DH, Paulauskis JD, Moustaid N, Sul HS. J Biol Chem. 1991;266:23834–23839. [PubMed] [Google Scholar]
- 18.Ericsson J, Jackson SM, Kim JB, Spiegelman BM, Edwards PA. J Biol Chem. 1997;272:7298–7305. doi: 10.1074/jbc.272.11.7298. [DOI] [PubMed] [Google Scholar]
- 19.Lindén D, William-Olsson L, Rhedin M, Asztély AK, Clapham JC, Schreyer S. J Lipid Res. 2004;45:1279–1288. doi: 10.1194/jlr.M400010-JLR200. [DOI] [PubMed] [Google Scholar]
- 20.Lewin TM, Wang S, Nagle CA, Van Horn CG, Coleman RA. Am J Physiol. 2005;288:E835–E844. doi: 10.1152/ajpendo.00300.2004. [DOI] [PubMed] [Google Scholar]
- 21.Hammond LE, Gallagher PA, Wang S, Posey-Marcos E, Hiller S, Kluckman K, Maeda N, Coleman RA. Mol Cell Biol. 2002;22:8204–8214. doi: 10.1128/MCB.22.23.8204-8214.2002. [DOI] [PMC free article] [PubMed] [Google Scholar]
- 22.Neschen S, Morino K, Hammond LE, Zhang D, Liu ZX, Romanelli AJ, Cline GW, Pongratz RL, Zhang XM, Choi CS, Coleman RA, Shulman GI. Cell Metab. 2005;2:55–65. doi: 10.1016/j.cmet.2005.06.006. [DOI] [PubMed] [Google Scholar]
- 23.Griffin ME, Marcucci MJ, Cline GW, Bell K, Barucci N, Lee DP, Goodyear LJ, Kraegen EW, White MF, Shulman GI. Diabetes. 1999;48:1270–1274. doi: 10.2337/diabetes.48.6.1270. [DOI] [PubMed] [Google Scholar]
- 24.Jucker BM, Cline GW, Barucci N, Shulman GI. Diabetes. 1999;48:134–140. doi: 10.2337/diabetes.48.1.134. [DOI] [PubMed] [Google Scholar]
- 25.Kraegen EW, Cooney GJ, Ye JM, Thompson AL, Furler SM. Exp Clin Endocrinol Diabetes. 2001;109:S189–S201. doi: 10.1055/s-2001-18581. [DOI] [PubMed] [Google Scholar]
- 26.Neschen S, Moore IK, Regittnig W, Yu CL, Wang Y, Pypaert M, Petersen KF, Shulman GI. Am J Physiol. 2002;282:E395–E401. doi: 10.1152/ajpendo.00414.2001. [DOI] [PMC free article] [PubMed] [Google Scholar]
- 27.Samuel VT, Liu ZX, Qu X, Elder BD, Bliz S, Befroy D, Romanelli AJ, Shulman GI. J Biol Chem. 2004;279:32345–32353. doi: 10.1074/jbc.M313478200. [DOI] [PubMed] [Google Scholar]
- 28.Shulman GI. J Clin Investig. 2000;106:171–176. doi: 10.1172/JCI10583. [DOI] [PMC free article] [PubMed] [Google Scholar]
- 29.Yu C, Chen Y, Cline GW, Zhang D, Zong H, Wang Y, Bergeron R, Kim JK, Cushman SW, Cooney GJ, Ascheson B, White MF, Draegen EW, Shulman GI. J Biol Chem. 2002;277:50230–50236. doi: 10.1074/jbc.M200958200. [DOI] [PubMed] [Google Scholar]
- 30.Becker TC, Noel RJ, Coats WS, Gomez-Foix AM, Alam T, Gerard RD, Newgard CB. Methods Cell Biol. 2004;43:161–189. doi: 10.1016/s0091-679x(08)60603-2. [DOI] [PubMed] [Google Scholar]
- 31.An J, Muoio DM, Shiota M, Fujimoto Y, Cline GW, Shulman GI, Koves TR, Stevens R, Millington DS, Newgard CB. Nat Med. 2004;10:268–274. doi: 10.1038/nm995. [DOI] [PubMed] [Google Scholar]
- 32.Bligh EG, Dyer WJ. Can J Biochem Physiol. 1959;37:911–917. doi: 10.1139/o59-099. [DOI] [PubMed] [Google Scholar]
- 33.Newgard CB, Moorse SV, Foster DW, McGarry JD. J Biol Chem. 1984;259:6958–6963. [PubMed] [Google Scholar]
- 34.Petersen KF, Shulman GI. Am J Cardiol. 2002;90:11G–18G. doi: 10.1016/s0002-9149(02)02554-7. [DOI] [PubMed] [Google Scholar]
- 35.Pedrini MT, Kranebitter M, Niederwanger A, Kaser S, Engl J, Debbage P, Huber LA, Patsch JR. Diabetologia. 2005;48:756–766. doi: 10.1007/s00125-005-1684-8. [DOI] [PubMed] [Google Scholar]
- 36.Hegarty BD, Furl SM, Ye J, Cooney GJ, Kraegen EW. Acta Physiol Scand. 2003;178:373–383. doi: 10.1046/j.1365-201X.2003.01162.x. [DOI] [PubMed] [Google Scholar]
- 37.Lindén D, William-Olsson L, Ahnmark A, Ekroos K, Hallberg C, Sjogren HP, Becker B, Svensson L, Clapham JC, Oscarsson J, Schreyer S. FASEB J. 2006;20:434–443. doi: 10.1096/fj.05-4568com. [DOI] [PubMed] [Google Scholar]
- 38.Moolenaar WH. Exp Cell Res. 1999;253:230–238. doi: 10.1006/excr.1999.4702. [DOI] [PubMed] [Google Scholar]
- 39.Fang X, Yu S, Tanyi JL, Lu Y, Woodgett JR, Mills GB. Mol Cell Biol. 2002;22:2099–2110. doi: 10.1128/MCB.22.7.2099-2110.2002. [DOI] [PMC free article] [PubMed] [Google Scholar]
- 40.Qu X, Seale JP, Donnelly R. J Endocrinol. 1999;162:207–214. doi: 10.1677/joe.0.1620207. [DOI] [PubMed] [Google Scholar]
- 41.Itani SI, Ruderman NB, Schmieder F, Boden G. Diabetes. 2002;51:2005–2011. doi: 10.2337/diabetes.51.7.2005. [DOI] [PubMed] [Google Scholar]
- 42.Lam TK, Yoshii H, Haber A, Bogdanovic E, Lam L, Fantus G, Giacca A. Am J Physiol. 2002;283:E682–E691. doi: 10.1152/ajpendo.00038.2002. [DOI] [PubMed] [Google Scholar]
- 43.Samuel VT, Liu ZX, Wang A, Beddow SA, Geisler JG, Kahn M, Zhang XM, Monia BP, Bhanot S, Shulman GI. J Clin Investig. 2007;117:739–745. doi: 10.1172/JCI30400. [DOI] [PMC free article] [PubMed] [Google Scholar]
- 44.Hammond LE, Neschen S, Romanelli AJ, Cline GW, Ilkayeva OR, Shulman GI, Muoio DM, Coleman RA. J Biol Chem. 2005;280:25629–25636. doi: 10.1074/jbc.M503181200. [DOI] [PubMed] [Google Scholar]
- 45.Ntambi JM, Miyazaki M, Stoehr JP, Lan H, Kendziorski CM, Yandell BS, Song Y, Cohen P, Friedman JM, Attie AD. Proc Natl Acad Sci U S A. 2002;99:11482–11486. doi: 10.1073/pnas.132384699. [DOI] [PMC free article] [PubMed] [Google Scholar]
- 46.Man WC, Miyazaki M, Chu K, Ntambi J. J Lipid Res. 2006;47:1928–1939. doi: 10.1194/jlr.M600172-JLR200. [DOI] [PubMed] [Google Scholar]
- 47.Guieterrez-Juarez R, Pocai A, Mulas C, Ono H, Bhanot S, Monia BP, Rossetti L. J Clin Investig. 2006;116:1686–1695. doi: 10.1172/JCI26991. [DOI] [PMC free article] [PubMed] [Google Scholar]
- 48.Arkan MC, Hevener AL, Greten FR, Maeda S, Li ZW, Long JM, Wynshaw-Boris A, Poli G, Olefsky JM, Karin M. Nat Med. 2005;11:191–198. doi: 10.1038/nm1185. [DOI] [PubMed] [Google Scholar]
- 49.Cai D, Yuan M, Frantz DF, Melendez PA, Hansen L, Lee J, Shoelson SE. Nat Med. 2005;11:183–190. doi: 10.1038/nm1166. [DOI] [PMC free article] [PubMed] [Google Scholar]
- 50.Donnelly R, Reed MJ, Azhar S, Reaven GM. Endocrinology. 1994;135:874–878. doi: 10.1210/endo.135.6.7988419. [DOI] [PubMed] [Google Scholar]
- 51.Cao J, Li JL, Li D, Tobin JF, Gimeno RE. Proc Natl Acad Sci U S A. 2006;103:19695–19700. doi: 10.1073/pnas.0609140103. [DOI] [PMC free article] [PubMed] [Google Scholar]


