Abstract
Increased fibrinogen concentration and erythrocyte aggregation are significant risk factors during various cardiovascular diseases and cerebrovascular disorders. Currently, fibrinogen-induced erythrocyte aggregation is thought to be caused by a non-specific binding mechanism. However, the published data on changes in erythrocyte aggregation during hypertension point to the possible existence of other mechanism(s). Therefore, we tested the hypothesis that specific binding of fibrinogen is involved in erythrocyte aggregation. It was found that Oregon Green 488-labeled human fibrinogen specifically binds rat erythrocyte membranes with a Kd of 1.3 μM. Further experiments showed that the peptide Arg-Gly-Asp-Ser blocked both fibrinogen-induced aggregation of intact erythrocytes and specific binding of fibrinogen to the erythrocyte membranes. These results suggest that in addition to non-specific binding, a specific binding mechanism is also involved in fibrinogen-induced erythrocyte aggregation.
Keywords: Red blood cell, Fibrinogen, Specific binding, Erythrocyte aggregation
1. Introduction
The prevailing hypothesis for the mechanism of erythrocyte aggregation is that it results from an increase in plasma adhesion proteins, particularly fibrinogen [1,2]. Currently, fibrinogen-induced red blood cell (RBC) aggregation is thought to be caused by non-specific protein binding to erythrocyte membranes [3-5]. However, in contrast to the generally accepted assumption that erythrocytes do not have receptors for adhesion proteins, specific receptors for ceruloplasmin have been found on the erythrocyte membrane surface [6]. In the present study, we report the existence of a specific binding mechanism between fibrinogen and erythrocytes from normal rats. In addition, we demonstrate that this binding is inhibited by the integrin receptor antagonist Arg-Gly-Asp-Ser (RGDS).
2. Materials and methods
2.1. Animals and erythrocyte preparations
Twelve week old male Sprague–Dawley (SD) rats were anesthetized with sodium pentobarbital (50 mg/kg, intraperitoneal) and 6–8 ml of blood was withdrawn by venipuncture of the vena cava using a sodium citrate anti-coagulant (final concentration 10.9 mM). The blood was first centrifuged at 180 × g for 15 min at room temperature to avoid contamination of the sample with platelets. After centrifugation, platelet rich plasma and a buffy coat were removed. Erythrocytes were washed three times with phosphate-buffered saline (PBS) (pH = 7.4; 285 mOsm) containing 5 mM glucose, by centrifugation at 2500 × g for 3 min. After each wash the buffy coat was removed and discarded. Then the cells were used to assess RBC aggregation (see below).
To obtain erythrocyte ghosts, after the last wash the RBC pellet was mixed with nine volumes of ice-cold lysis buffer (5 mM sodium phosphate) and stirred for 15 min at 0°C [7]. Subsequently, the unsealed erythrocyte ghosts were pelleted by centrifugation at 37 000 × g for 10 min at 0°C. After the centrifugation the ghosts were washed with ice-cold lysis buffer until residual hemoglobin was not visible. The RBC ghosts were suspended in about 0.5 volume of PBS and were kept frozen at −80°C until use.
Resealed, right-side-out erythrocytes were obtained according to a method described elsewhere [8]. Briefly, after two washings, erythrocyte ghosts were mixed dropwise with resealing solution (10 mM sodium phosphate, 100 mM NaCl, 4 mM MgSO4, 0.01 mM CaCl2, pH = 7.4) with vigorous stirring. The cells were immediately incubated at 37°C for 1 h. After the incubation resealed erythrocytes were collected by centrifugation at 25 000 × g for 10 min. To remove resealing solution the resealed cells were washed three times with PBS by centrifugation at 25 000 × g for 10 min at 4°C.
2.2. Specific binding of fibrinogen to erythrocyte membrane
We developed a simple, yet very reliable fluorometric method for evaluation of specific fibrinogen binding. The rat (SD, n = 6) erythrocyte ghosts were incubated for 30 min at room temperature with different concentrations (0.07, 0.15, 0.29, 0.44, 0.59 and 0.74 μM) of Oregon Green 488-conjugated human plasma fibrinogen (OG-Fb; 7.4 μM stock solution; Molecular Probes, Eugene, OR, USA) alone and with the same concentrations of labeled fibrinogen in the presence of a 100-fold excess of non-labeled pure human plasma fibrinogen (FIB-3; Enzyme Research Laboratories, South Bend, IN, USA). As a control, a third group was used where erythrocyte ghosts were incubated in non-labeled fibrinogen at the same concentrations as in group 2 but with OG-Fb omitted. All the samples were prepared in triplicates. After incubation the cell ghosts were washed in PBS by centrifugation at 4000 × g for 5 min and suspended in 1% sodium dodecyl sulfate in PBS solution for fluorescence measurements. In a separate series of experiments, following the fibrinogen binding procedure and subsequent washing, resealed erythrocytes were suspended in PBS alone and the fluorescence measurements were performed. To estimate the number of fibrinogen binding sites, the cells were counted in a hemocytometer using a phase-contrast microscope (Zeiss Axiovert 10, Germany). It should be noted that since citrate, which was only used as an anti-coagulant, chelates Ca2+, in all of the binding experiments of the present study we added a physiological concentration of Ca2+ (1 mM) to the samples (unless otherwise noted).
Fluorescence of OG-Fb bound to erythrocyte membranes was measured on a Perkin Elmer Luminescence Spectrometer LS-50B (Wesley, MA, USA) at an excitation wavelength of 496 nm and emission at 524 nm. The bound fibrinogen concentration was determined using a standard curve of OG-Fb fluorescence. Specific binding at each OG-Fb concentration was determined from the difference between total binding (absence of unlabeled fibrinogen) and non-specific binding (100-fold excess of unlabeled fibrinogen) [9]. Autofluorescence at 524 nm was less than 1% of the total fluorescence. A dissociation constant, Kd, was calculated using a single binding site model included in Slide-Write software (Advanced Graphics Software, Inc., Carlsbad, CA, USA).
Measurements of fibrinogen concentration and total protein contents in erythrocyte ghosts and resealed RBCs were performed using the Pierce (Rockford, IL, USA) bicinchonic acid kit with bovine serum albumin as a standard.
2.3. Inhibition of RBC aggregation and fibrinogen specific binding by RGDS peptide
To test the hypothesis that fibrinogen may bind specifically to integrin-type receptors on the surface of erythrocytes, we determined the effect of the integrin antagonist RGDS peptide on fibrinogen-induced erythrocyte aggregation and fibrinogen specific binding. The aggregation of washed erythrocytes from normal SD rats (n = 3) induced by human fibrinogen (11 μM) was evaluated in the absence (control) or presence of various concentrations (0.5, 1, 1.5 and 3 mM) of RGDS peptide using the method for evaluation of erythrocyte aggregation described below. In addition, the effect of RGDS peptide on fibrinogen specific binding was assessed using the fluorescence binding method described above. In the binding study we used 0.59 μM of OG-Fb in the absence (control) and presence of 0.3, 1 and 2.5 mM RGDS peptide. As a control, the effect of 2.5 mM of Arg-Gly-Glu-Ser (RGES) peptide on fibrinogen specific binding was analyzed.
2.4. Erythrocyte aggregation
Erythrocyte aggregation was assessed by a modified method, which was described previously [10]. Briefly, one part of washed erythrocytes was suspended in 200 parts of fibrinogen-PBS solution, mixed gently and placed in a hemocytometer. Formation of RBC aggregates under static conditions was recorded on videotape for off-line analysis. An image analysis program (Matrox Inspector-3, Matrox Imaging, Dorval, Canada) was used to determine the degree of erythrocyte aggregation in the samples. This variable was presented as the erythrocyte aggregation index, which represents the ratio of total area of aggregates to total area of RBCs in the given area of sample observation [10].
To evaluate the effect of RGDS peptide on fibrinogen-induced erythrocyte aggregation, the washed erythrocytes were suspended in fibrinogen–PBS solution with a ratio of one part of erythrocytes to 200 parts of the solution. Human plasma fibrinogen was diluted in PBS solution to the concentration of 6 mg/ml and RGDS peptide was added at 0.5, 1, 1.5 or 3 mM concentrations. RBC aggregation at each concentration of fibrinogen was analyzed as noted above. We did not find a difference in fibrinogen-induced erythrocyte aggregation when human fibrinogen was replaced with rat plasma fibrinogen (Sigma, St. Louis, MO, USA) (data are not presented).
2.5. Statistical analysis
Values given in the text and figures are the means ± S.E.M. Differences between the experimental data were evaluated by one-way analysis of variance. Statistical significance was assumed at a value of P < 0.05.
3. Results and discussion
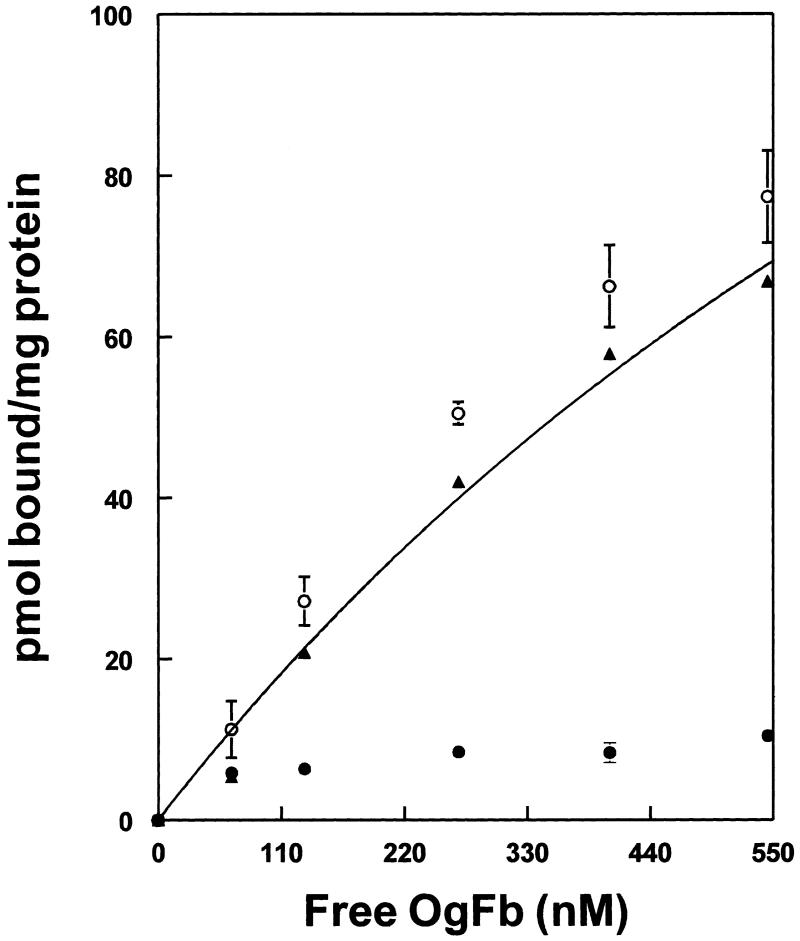
In the present study, fibrinogen specific binding was determined from the difference between total binding of OG-Fb and non-specific binding in the presence of a 100-fold excess of unlabeled Fb (Fig. 1). Fitting the data to a single binding site model yielded a Kd of 1.3 μM and maximum binding of 234 ρmol/mg erythrocyte membrane protein. We did not find a significant difference between the fibrinogen specific binding to erythrocyte ghosts (18.9 ± 4.8% of total binding) and resealed RBCs (18 ± 2.7% of total binding) at 0.78 μM fibrinogen and a similar total protein content in the samples of erythrocyte ghosts (0.74 ± 0.003 μg/ml) and resealed RBCs (0.77 ± 0.01 Wg/ml). This clearly shows that fibrinogen specific binding occurs on the outside surface of the erythrocytes. In addition, this similarity in binding allowed us to use either erythrocyte ghosts or resealed, right-side-out RBCs for subsequent experiments. Using the same method for fibrinogen binding to resealed RBCs we were able to estimate that rat erythrocytes have about 1932 ± 104 sites for fibrinogen specific binding. The higher (at least 10-fold greater) affinity of fibrinogen/platelet interaction [11] argues against the contribution of platelets to fibrinogen binding in our samples. These results suggest that at a fibrinogen concentration of about 5 μM, which is a normal concentration of fibrinogen in whole blood [12], approximately 80% of binding sites are already occupied by fibrinogen. Therefore, during the pathologies accompanied with an increase in fibrinogen concentration, erythrocyte aggregation occurs by a combination of specific and non-specific binding mechanisms. A study of fibrinogen binding to human intact erythrocytes revealed a similar affinity (Kd = 1.4 μM) (data are not presented). The existence of fibrinogen specific binding to intact human erythrocytes and rat erythrocyte ghosts and resealed RBCs ghosts is another confirmation that fibrinogen specific binding occurs on the outside surface of the RBC.
Fig. 1.
Binding of human plasma fibrinogen to rat erythrocyte membrane. Total (○), non-specific (●) and specific (▲) binding (n = 3). Curve shows fitting to a single site with a Kd of 1.3 μM, and 234 ρmol fibrinogen bound/mg erythrocyte protein at saturation.
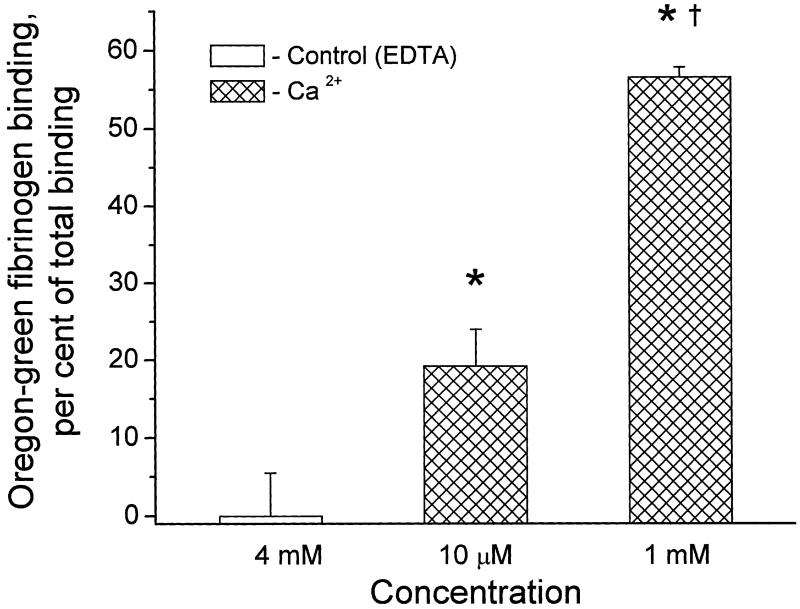
As a first step in the characterization of fibrinogen specific binding, we tested if this binding was Ca2+-dependent. Fibrinogen specific binding to resealed RBCs was studied at a given concentration (0.78 μM) of OG-Fb in the presence of 4 mM ethylenediaminetetraacetic acid (EDTA) or after addition of either 10 μM or 1 mM CaCl2 (Fig. 2). The complete loss of fibrinogen specific binding caused by the cation chelator EDTA, as well as Ca2+ dose-dependent increases of the fibrinogen specific binding, suggest the possible involvement of an integrin-type receptor in fibrinogen erythrocyte interaction [13].
Fig. 2.
Increase in fibrinogen specific binding to rat resealed erythrocytes with increasing Ca2+ concentration (n = 3). *P < 0.05 for comparison with the control group, where Ca2+ is chelated by EDTA. †P < 0.05 for comparison with the lower Ca2+ concentration group.
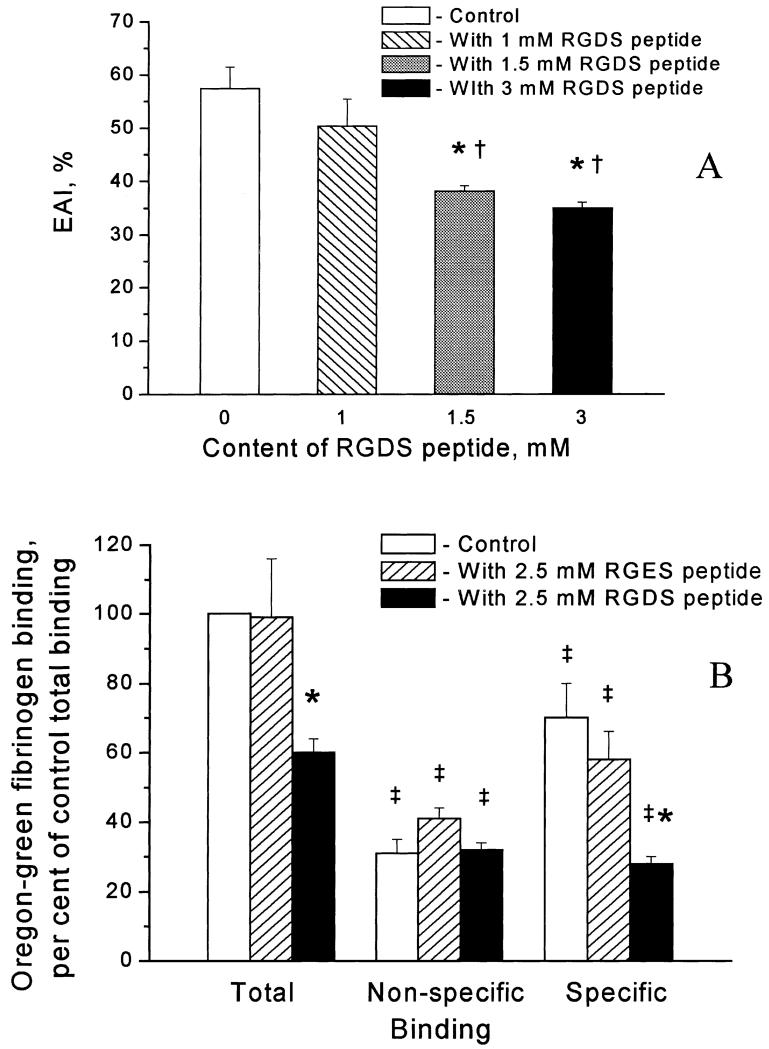
To further characterize the fibrinogen specific binding to erythrocytes, we tested the integrin antagonist RGDS peptide. Fibrinogen-induced erythrocyte aggregation did not change in the presence of RGDS peptide at 0.5 mM (data are not presented) or at a concentration of 1 mM (Fig. 3A). However, at higher RGDS peptide concentrations (1.5 and 3 mM), fibrinogen-induced erythrocyte aggregation was significantly decreased (by 34 ± 4% and 39 ± 4% respectively) (Fig. 3A).
Fig. 3.
Inhibition of fibrinogen-induced erythrocyte aggregation (n = 3) (A), and fibrinogen specific binding to erythrocyte membrane by RGDS peptide (n = 3) (B). The samples are in triplicate in each group. The ordinate in A presents the erythrocyte aggregation index (EAI) expressed as a percentage and in B indicates binding normalized to the total binding observed in the absence of the added peptide. *P < 0.05 for comparison with control within the group. †P < 0.05 for comparison with a concentration of RGDS of 1 mM. ‡P < 0.05 for comparison with total binding within the group.
To test if RGDS peptide has an effect on specific binding of fibrinogen to erythrocyte membrane proteins, we used various concentrations of RGDS peptide in the specific binding experiments. A concentration of 2.5 mM RGDS caused significant (60 ± 3%) inhibition of fibrinogen specific binding (Fig. 3B), while at concentrations of 1 mM and 0.3 mM, RGDS peptide did not significantly affect this binding (data are not presented). Fibrinogen specific binding was affected insignificantly (17 ± 9% inhibition) by 2.5 mM RGES peptide (Fig. 3B).
These results imply that an integrin-like receptor may be involved in both fibrinogen-induced aggregation of intact erythrocytes (Fig. 3A) and fibrinogen specific binding to erythrocyte membranes (Fig. 3B). There were several reports showing the existence of various (integrin or non-integrin) glycoproteins that are involved in adhesion of erythrocytes to endothelial cells [14-16]. The existence of integrin αIIbβ3 and non-integrin glycoprotein Ib on erythrocytes, which was reported by one group of scientists [16], was completely contradicted by the results of another group [17]. The presence of integrin α4β1 (VLA-4, i.e. CD49d/CD29) has been reported on the surface of reticulocytes but not on erythrocytes from sickle cell patients [17,18]. A non-integrin glycoprotein, CD47 (integrin-associated protein), has been found to serve as a marker of self on erythrocytes by binding the signal regulator protein α by an integrin-independent mechanism [19]. In addition, a low level of non-integrin glycoprotein IV (CD36) on the surface of normal erythrocytes has been found to be involved in adhesion of malaria-infected cells, suggesting that CD36 mediates an as yet unidentified physiological process in healthy humans [20]. Taken together, these data and our results suggest the possible existence of an unidentified integrintype receptor protein on the surface of RBCs. The fact that fibrinogen binding in our study is inhibited by RGDS only at high concentrations (1.5 and 3 mM, Fig. 3A; and 2.5 mM, Fig. 3B) suggests that the RBC membrane receptor has a low affinity for RGDS compared with the well characterized fibrinogen binding to other integrins [13]. Therefore, we do not exclude the possibility of fibrinogen specific binding to a non-integrin-type glycoprotein through an RGD-mediated mechanism. Identification of this receptor is a subject for future studies.
In conclusion, the novelty of the present study is that in addition to non-specific binding, we now show the existence of fibrinogen specific binding to the erythrocyte membrane surface. Presently, due to the complexity of the non-specific binding mechanism, there are no specific erythrocyte anti-aggregatory drugs available in clinical practice. The existence of a specific binding mechanism in fibrinogen-induced erythrocyte aggregation suggests the possibility of a drug therapy resulting in a significant decrease of erythrocyte aggregation during different pathologies (e.g. hypertension, diabetes and various cerebrovascular disorders).
Abbreviations
- EAI
Erythrocyte Aggregation Index
- EDTA
ethylenediaminetetraacetic acid
- OG-Fb
Oregon Green 488-conjugated human plasma fibrinogen
- PBS
phosphate-buffered saline
- RBC
red blood cell
- RGDS
Arg-Gly-Asp-Ser
- RGES
Arg-Gly-Glu-Ser
- SD
Sprague–Dawley
References
- [1].Letcher RL, Chien S, Pickering TG, Laragh JH. Hypertension. 1983;5:757–762. doi: 10.1161/01.hyp.5.5.757. [DOI] [PubMed] [Google Scholar]
- [2].Weng X, Cloutier G, Beaulieu R, Roederer GO. Am. J. Physiol. 1996;271:H2346–H2352. doi: 10.1152/ajpheart.1996.271.6.H2346. [DOI] [PubMed] [Google Scholar]
- [3].Chien S. In: The Red Blood Cell. Surgenor DM, editor. Vol. 2. Academic Press; New York: 1975. pp. 1031–1133. Chapter 26. [Google Scholar]
- [4].Chien S, Jan KM. Microvasc. Res. 1973;5:155–166. doi: 10.1016/0026-2862(73)90068-x. [DOI] [PubMed] [Google Scholar]
- [5].Chien S, Jan KM. J. Supramol. Struct. 1973;1:385–409. doi: 10.1002/jss.400010418. [DOI] [PubMed] [Google Scholar]
- [6].Barnes G, Frieden E. Biochem. Biophys. Res. Commun. 1984;125:157–162. doi: 10.1016/s0006-291x(84)80348-4. [DOI] [PubMed] [Google Scholar]
- [7].Klonk S, Deuticke B. Biochim. Biophys. Acta. 1992;1106:143–150. doi: 10.1016/0005-2736(92)90232-b. [DOI] [PubMed] [Google Scholar]
- [8].Deziel MR, Girotti AW. J. Biol. Chem. 1980;255:8192–8198. [PubMed] [Google Scholar]
- [9].Zhang Y, Dean WL, Gray RD. J. Biol. Chem. 1997;272:1444–1447. doi: 10.1074/jbc.272.3.1444. [DOI] [PubMed] [Google Scholar]
- [10].Lominadze D, Joshua IG, Schuschke DA. Am. J. Hypertens. 1998;11:784–789. doi: 10.1016/s0895-7061(98)00056-9. [DOI] [PubMed] [Google Scholar]
- [11].Herrick S, Blanc-Brude O, Gray A, Laurent G. Int. J. Biochem. Cell Biol. 1999;31:741–746. doi: 10.1016/s1357-2725(99)00032-1. [DOI] [PubMed] [Google Scholar]
- [12].Hicks RCJ, Golledge J, Mir-Hasseine R, Powel JT. Nature. 1996;379:818–820. doi: 10.1038/379818a0. [DOI] [PubMed] [Google Scholar]
- [13].Plow EF, Haas TA, Zhang L, Loftus J, Smith JW. J. Biol. Chem. 2000;275:21785–21788. doi: 10.1074/jbc.R000003200. [DOI] [PubMed] [Google Scholar]
- [14].Sugihara K, Sugihara T, Mohandas N, Hebbel RP. Blood. 1992;80:2634–2642. [PubMed] [Google Scholar]
- [15].Manodori AB. Microvasc. Res. 2001;61:263–274. doi: 10.1006/mvre.2000.2317. [DOI] [PubMed] [Google Scholar]
- [16].Wick TM, Moake JL, Udden MM, McIntire LV. Am. J. Hematol. 1993;42:284–292. doi: 10.1002/ajh.2830420308. [DOI] [PubMed] [Google Scholar]
- [17].Joneckis CC, Ackley RL, Orringer EP, Wayner EA, Parise LV. Blood. 1993;82:3548–3555. [PubMed] [Google Scholar]
- [18].Joneckis CC, Shock DD, Cunningham ML, Orringer EP, Parise LV. Blood. 1996;87:4862–4870. [PubMed] [Google Scholar]
- [19].Oldenborg P-A, Zheleznyak A, Fang Y-F, Lagenaur CF, Gresham HD, Lindberg FP. Science. 2000;288:2051–2054. doi: 10.1126/science.288.5473.2051. [DOI] [PubMed] [Google Scholar]
- [20].van Schravendijk MR, Handunnetti SM, Barnwell JW, Howard RJ. Blood. 1992;80:2105–2114. [PubMed] [Google Scholar]


