

Abstract
Interferon (IFN) signature genes have been shown to be expressed highly in peripheral blood of patients with systemic lupus erythematosus (SLE), especially in the presence of active disease. However, the expression of this gene signature in individuals with incomplete forms of lupus and the pathogenic relationship between IFN signature genes and autoantibody production have not been explored fully. In the present study, we examined the gene expression and autoantibody profiles of patients diagnosed with incomplete lupus erythematosus (ILE) to determine correlations of the gene expression signature with autoantibody production. Gene expression analysis was carried out on the 24K Illumina Human Refseq-8 arrays using blood samples from 84 subjects, including patients with SLE (n = 27) or ILE (n = 24), first-degree relatives (FDR) of these patients (n = 22) and non-autoimmune control (NC) individuals (n = 11). Autoantibody expression was measured using standard immunoassays and autoantigen proteomic arrays. Up-regulation of a set of 63 IFN signature genes was seen in 83% of SLE patients and 50% of ILE patients. High levels of IFN gene expression in ILE and SLE showed significant correlations with the expression of a subset of IgG autoantibodies, including chromatin, dsDNA, dsRNA, U1snRNP, Ro/SSA, La/SSB, topoisomerase I and Scl 70, while low IFN levels were correlated with immunoglobulin (Ig)M autoreactivity. These studies suggest that in patients with ILE the IFN gene expression signature may identify a subset of these individuals who are at risk for disease progression. Furthermore, high levels of alpha IFN may promote autoantibody class-switch from IgM to the more pathogenic IgG class.
Keywords: autoantibodies, autoimmune disease, gene expression profiling, IFN-α, SLE
Introduction
Systemic lupus erythematosus (SLE) is a heterogeneous, multi-system autoimmune disease that is associated with organ failure in a significant proportion of afflicted patients. Despite the improved availability of effective therapies, resistance to treatment and premature mortality remain major concerns [1]. The overall prevalence of lupus in the United States is estimated at 0·1%, but in some segments of the population, such as African American and Hispanic females, prevalence may be 2·5-fold greater [2]. Establishing a diagnosis of SLE is complex. Classification criteria that distinguish SLE from other autoimmune disorders were established 25 years ago [3,4]. Using these 11 criteria, the presence of four or more items has high sensitivity and specificity for SLE. However, in clinical practice it is well recognized that lupus-like syndromes occur in patients who have fewer than four of the defined criteria. These patients have been described as having incomplete lupus syndromes (ILE) [5–7]. Some of these individuals have a well-defined set of clinical features, such as anti-phospholipid syndrome, while others are characterized less readily [7]. The ILE population is probably more heterogeneous than SLE itself, and it most probably includes some individuals in whom disease is arrested in the incomplete form with reduced risk of organ damage, as well as others who will progress to develop organ-damaging SLE [8]. In some studies, 10–50% of patients with ILE develop SLE within 5 years [5,9]. We have considered that focusing upon ILE as a category that includes individuals who are evolving towards SLE may permit feasible approaches to stratification of risk and identification of those who have the greatest probability of disease progression.
The goals of the present study were to characterize patterns of gene expression in peripheral blood cells of patients with ILE and to evaluate these patterns within the contexts of demographic features and autoantibody profiles. Additional objectives were to compare these ILE profiles to those of SLE patients, a disease group in which gene expression has been studied extensively, as well as to first-degree relatives (FDRs) of lupus patients. Genes that were found to be expressed differentially in ILE included a set of interferon (IFN)-inducible specificities that have been described previously to be up-regulated in patients with SLE [10,11]. The ILE subgroup could be divided further into subsets that shared similarities with either SLE or with clinically unaffected individuals. These ILE subgroups showed distinct demographic and autoantibody features. Further characterization of pathways that are dysregulated in ILE and in early stages of lupus should provide insights into events that trigger disease and lead to development of prevention strategies.
Materials and methods
Patients
Studies were carried out in a total of 84 individuals in four categories (Table 1) as follows:
Table 1.
Demographic and clinical characteristics of the four study groups: systemic lupus erythematosus (SLE), incomplete lupus (ILE), first-degree relatives (FDR), non-autoimmune controls (NC).
| NC | FDR | ILE | SLE | P-value‡ | |
|---|---|---|---|---|---|
| Number | 11 | 22 | 24 | 27 | – |
| % Female | 92 | 85 | 93 | 91 | 0.79 |
| % African American | 23 | 20 | 17 | 43 | 0.60 |
| % Hispanic | 15 | 10 | 17 | 23 | 0.76 |
| Age (years)* | 43 ± 5 | 46 ± 4 | 47 ± 3 | 39 ± 3 | 0.29 |
| ANA (EU)*† | 14 ± 3 | 37 ± 11 | 105 ± 18 | 113 ± 12 | <0.0001 |
| dsDNA (EU)* | n.d. | 132 ± 46 | 156 ± 44 | 317 ± 99 | 0.0113 |
Values for age and antibodies are expressed as mean and standard error of the mean.
Anti-nuclear antibody (ANA) and extractable nuclear autoantibodies (ENA) values are expressed as enzyme-linked immunosorbent assay units (EU).
P-values were calculated comparing the groups using χ2 (female, African American, Hispanic), one-way analysis of variance (age, ANA), t-test (criteria) or Kruskal–Wallis (dsDNA) test, as appropriate. n.d., not done.
Twenty-seven patients had SLE and satisfied four or more of the American College of Rheumatology classification criteria [3,4]. The median number of lupus criteria in the SLE patients was 5·0 (range 4–8).
Twenty-four patients had ILE, defined as having at least one but fewer than four of the criteria for SLE. The median number of lupus criteria in the ILE subjects was 2·0 (range 1–3). Of the six individuals with one criterion, only one had an isolated anti-nuclear antibody (ANA) with no other risk factors. The other five individuals each had one or more of the following additional risk factors: a first-degree relative with lupus, positivity for Ro (SSA), La (SSB) or rheumatoid factor autoantibodies, elevation of erythrocyte sedimentation rate, anti-phospholipid syndrome or a history of inflammatory arthritis.
Twenty-two individuals were unaffected FDRs of SLE patients. Four of the FDRs had low positive ANAs [20–30 enzyme-linked immunosorbent assay (ELISA) units (EU)] and an additional five FDRs had ANAs that were greater than 30 EU, but none of these individuals had any clinical findings, so they were not classified as ILE.
Eleven non-autoimmune control (NC) subjects were healthy individuals or patients with other unrelated conditions, such as osteoarthritis.
No other criteria were required for enrolment. Subjects could have other co-morbid conditions, be on any forms of treatment and have any disease duration. The population was predominantly female (90%; Table 1), consistent with the gender bias of human autoimmune diseases. Almost half the subjects (43%) were either African American (26%) or Hispanic (17%). The average age [±standard error of the mean (s.e.m.)] was 44 ± 2 years. These demographic variables were not significantly different in the four study groups (Table 1), although there was a trend for more of the ILE patients to be non-Hispanic Caucasians. All subjects were consented for entry into the Dallas Regional Autoimmune Disease Registry. The UT Southwestern Institutional Review Board has approved research carried out under the auspices of this registry.
Patient assessment and blood sampling
Medical records were reviewed to determine clinical features, laboratory findings and numbers of SLE criteria present at any time during the disease course, using the American College of Rheumatology diagnostic criteria. Study participants had 5 ml of blood drawn into PaxGene™ tubes (Qiagen Inc., Valencia, CA, USA) for isolation of RNA. Tubes were kept at room temperature for at least 2 h and frozen at −80°C within 24 h. Autoantibodies were measured in serum samples collected at the same visit. ANA and dsDNA levels were measured using commercially available ELISA kits (Inova Diagnostics Inc., San Diego, CA, USA) as described previously [12]. The Quanta Plex SLE Profile 8 (Inova Diagnostics Inc.) was used to measure eight additional autoantibodies (Ro, La, Sm, RNP, Jo-1, chromatin, Scl-70 and Rib-P) using a Luminex-based assay [12]. Measurements of dsDNA and the panel of eight other autoantibodies were carried out only in individuals with ANA values >20 ELISA units.
Protein array analysis
Autoantibodies were measured on an autoantigen proteomic array that has been described previously [13]. The array includes 70 autoantigens and four control proteins; 1 µl of serum samples were diluted 1 : 100 and added to the arrays in duplicate. Detection was with Cy3-labelled anti-human immunoglobulin (Ig)G and Cy5-labelled anti-human IgM (Jackson ImmunoResearch, West Grove, PA, USA). A Genepix 4000B scanner with laser wavelengths 532 (for Cy3) and 635 (for Cy5) was used to generate images for analysis. Images were analysed using Genepix Pro 6·0 software to generate a GenePix Results (GPR) file. Net fluorescence intensities (NFI) were normalized using anti-human IgG or IgM spotted onto each array. Values obtained from duplicate spots were averaged. Fluorescence intensities that were higher than the row means were designated with red colour, those below the mean were coloured green and those with signals close to the mean were left black. Missing data were denoted with grey.
RNA preparation and gene expression analysis
Total RNA was prepared from the Paxgene tubes using Gentra RNA purification kits (Gentra Systems, Minneapolis, MN, USA). RNA yields from 5 ml of blood collected in two Paxgene tubes ranged from 2 to 15 µg. Purity and concentration were verified using an Agilent 2100 bioanalyser. Preparation of labelled cDNA was carried out using the TotalPrep RNA Amplification kit (Ambion, Austin, TX, USA). Gene expression profiling was measured using the Illumina Human Refseq-8 Beadarray chips following the manufacturer's instructions (Illumina Inc., San Diego, CA, USA). Array data were quantum normalized and background subtracted using Illumina BeadStudio software version 3 (Illumina Inc.). Further statistical analysis was performed using Partek Genomic Suite version 6 (Partek Inc., Gladstone, MI, USA), and the heat maps were generated using Cluster and Treeview software package (http://rana.lbl.gov/EisenSoftware.htm).
Quantitative polymerase chain reaction (Q-PCR) confirmation of microarray data
Gene expression array results were confirmed for selected genes by quantitative reverse transcription–polymerase chain reaction (Q-RT-PCR) using validated TaqMan assays (Applied Biosystems, Carlsbad, CA, USA) as described previously [14], and Hs01014002_m1 for signal trandsduction and activator of transcription-1 (STAT1), Hs01013123_m1 for STAT2, Hs00369813_m1 for viperin (Cig5), Hs00242571_m1 for G1P3 and Hs01014809_g1 for IFN regulatory factor 7 (IRF7). Hs00155468_m1 for IFN-induced protein with tetratricopeptide repeats 4 (IFIT4), Hs00158942_m1 for lymphocyte antigen 6 complex, locus E (Ly6E), Hs00895598_m1 for myovirus resistance 1 (MX1), Hs00196324_m1 for 2′-5′ oligoadenylate synthetase 3 (OAS3), Hs00271467_m1 for IFI27. Transcription of eukaryotic 18S rRNA (assay ID Hs99999901_s1) was used as an internal control. Six samples from each patient group were used for the validation assay.
Statistical analysis
Gene expression levels were compared in subject groups using a two-tailed unpaired Student's t-test. Subsets of SLE and ILE patients were defined according to expression levels of IFN-inducible genes, as described in the Results section. Clinical, demographic and laboratory features in these defined subgroups were then compared using a t-test or the Kruskal–Wallis test for those data that were not distributed normally; discontinuous variables such as gender, race and ethnicity were compared using Fisher's exact test. Continuous variables were compared using Pearson's correlation coefficient. P-values of <0·05 were considered significant.
Results
Gene expression profiles in peripheral blood from four sample groups, SLE, ILE, FDR and NC, were compared to each other to determine the number of differentially expressed genes between these groups. Using P-value < 0·001 as filtering criteria, a total of 1151 gene transcripts were identified, including 29 between FDR and NC, 148 between ILE and NC, 473 between SLE and NC, 54 between ILE and FDR, 341 between SLE and FDR and 106 between SLE and ILE (Fig. 1a). Among these 1151 transcripts, 801 are unique genes. Hierarchical clustering of these 801 gene transcripts revealed several gene clusters that were related to different sample groups (Fig. 1b, left panel). Some of the interesting gene clusters that were identified from the differentially expressed genes included IFN signature genes, tumour necrosis factor (TNF)-α signature genes, genes involved in innate immune responses, B/T lymphocyte activation and proliferation and some transcription factors (data not shown). One of these subclusters of 116 genes was identified visually to be expressed highly in most SLE patients and about half of ILE patients, but was low in all NC and FDR samples, and further analyses were focused upon this set of genes. Interestingly, 63 transcripts (representing 60 unique genes) in this cluster were identified from the literature and from gene annotation information as Type I IFN signature genes (Fig. 1b, right panel). The average expression values for the 60 IFN signature genes in each sample group are listed in Table 2. In general, the expression levels of these IFN signature genes showed a progressive increase that paralleled disease burden, namely, low in NC and FDR, higher in ILE and highest in SLE. The expression levels of 10 of these IFN signature genes (STAT1, STAT2, Cig5, G1P3, IRF7, IFIT4, Ly6E, MX1, OAS3 and IFI27) were confirmed further by real-time PCR using TaqMan assays (Fig. 1c). Again, the same gradation in gene expression (SLE > ILE > FDR > NC) was noted.
Fig. 1.
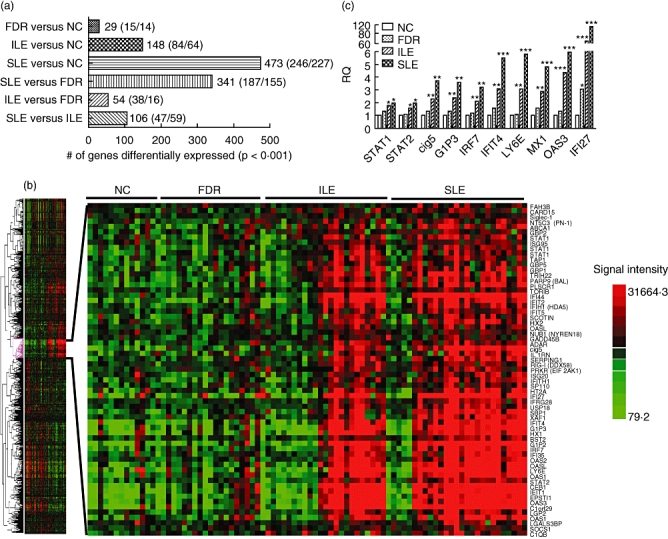
(a) Number of genes (up/down) dysregulated significantly between each subject group (P < 0·001 using t-tests). A total of 1151 genes, including 801 unique specificities, were identified to be dysregulated significantly in six pairwise comparisons. (b) Heat map of the 801 differentially expressed genes analysed using a one-way clustering algorithm. A subcluster of 116 genes was identified to be up-regulated in most systemic lupus erythematosus (SLE) and half the incomplete lupus erythematosus (ILE) samples. The expanded view shows the 63 interferon (IFN) signature genes from this subcluster. (c) The differential expression of 10 IFN signature genes [signal transduction and activator of transcription-1 (STAT1), STAT2, viperin (Cig5), IFN-α-inducible protein 3 (G1P3), IFN regulatory factor 7 (IRF7), IFN-induced protein with tetratricopeptide repeats 4 (IFIT4), lymphocyte antigen 6 complex, locus E (Ly6E), myovirus resistance 1 (MX1), 2′-5′ oligoadenylate synthetase 3 (OAS3) and IFI27) was confirmed by real-time polymerase chain reaction (PCR) (Taqman) in the indicated sample groups. Each bar represents mean value from six samples. *P < 0·05; **P < 0·01; ***P < 0·001, compared to the non-autoimmune control (NC) group.
Table 2.
The expression value of 63 interferon (IFN) signature transcripts in each group.
| Name | NC | FDR | ILE | SLE | Name | NC | FDR | ILE | SLE |
|---|---|---|---|---|---|---|---|---|---|
| TOR1B | 128.8 | 118.0 | 149.4 | 156.7 | C1orf29 | 172.8 | 247.7 | 920.0 | 1 691.1 |
| FAM3B | 97.5 | 99.2 | 101.3 | 120.5 | OAS3 | 178.9 | 227.5 | 522.0 | 701.5 |
| USP18 | 113.2 | 112.7 | 148.3 | 211.4 | OAS1 | 196.6 | 233.1 | 337.4 | 555.1 |
| Siglec-1 | 116.7 | 108.8 | 128.1 | 130.0 | GBP5 | 357.6 | 453.3 | 615.0 | 645.4 |
| IFIT5 | 137.9 | 150.3 | 187.0 | 220.9 | IFIT2 | 486.0 | 617.3 | 1328.5 | 1 833.2 |
| IFRG28 | 128.8 | 128.1 | 166.5 | 208.4 | IFIT1 | 209.3 | 319.7 | 859.7 | 1 169.5 |
| PRKR (EIF2AK1) | 117.6 | 123.8 | 162.0 | 174.4 | IL1RN | 518.7 | 598.9 | 754.7 | 990.2 |
| OASL | 121.0 | 135.7 | 157.5 | 174.5 | OAS1 | 274.1 | 315.2 | 551.9 | 916.2 |
| LGALS3BP | 151.3 | 132.6 | 144.5 | 173.7 | OASL | 233.7 | 278.8 | 569.9 | 801.2 |
| IFIH1 (MDA5) | 196.7 | 205.9 | 304.5 | 364.0 | ZBP1 | 421.0 | 449.3 | 689.5 | 1 084.3 |
| C1QB | 132.7 | 150.8 | 206.4 | 206.7 | CEB1 | 262.4 | 397.3 | 934.7 | 1 342.1 |
| GBP1 | 178.4 | 239.4 | 343.3 | 387.2 | BST2 | 427.8 | 407.4 | 483.4 | 645.8 |
| IFI44 | 147.8 | 151.6 | 349.1 | 630.2 | IFI27 | 654.1 | 229.2 | 2200.6 | 7 750.5 |
| GBP2 | 173.4 | 194.4 | 209.4 | 236.0 | EPSTI1 | 359.9 | 510.2 | 1338.7 | 2 048.0 |
| CARD15 | 197.1 | 205.3 | 248.4 | 266.2 | IFI35 | 459.2 | 456.9 | 683.5 | 852.8 |
| SOCS1 | 149.1 | 168.9 | 183.7 | 200.0 | TAP1 | 876.3 | 862.9 | 1273.0 | 1 325.3 |
| XAF1 | 134.0 | 153.4 | 195.5 | 310.4 | SP110 | 850.8 | 918.1 | 1055.7 | 1 281.5 |
| OAS2 | 133.5 | 131.2 | 209.2 | 288.7 | STAT1 | 654.4 | 745.9 | 1032.0 | 1 074.9 |
| ABCA1 | 244.6 | 259.4 | 347.1 | 477.8 | IFIT4 | 439.3 | 491.2 | 980.9 | 1 608.0 |
| PLSCR1 | 226.3 | 257.3 | 484.0 | 594.6 | Cig5 | 565.6 | 763.4 | 1198.1 | 1 802.2 |
| ISG95 | 217.3 | 190.3 | 221.8 | 252.5 | STAT2 | 889.3 | 979.2 | 1276.7 | 1 622.5 |
| RIG-I (DDX58) | 189.1 | 201.6 | 256.4 | 273.0 | MX2 | 696.6 | 620.2 | 918.2 | 1 109.6 |
| LGP2 | 202.4 | 178.1 | 238.8 | 301.7 | IRF7 | 956.1 | 1080.1 | 1752.8 | 2 782.2 |
| GADD45B | 258.2 | 249.9 | 305.0 | 320.9 | SCOTIN | 1315.1 | 1426.6 | 1730.9 | 2 093.2 |
| PARP9 (BAL) | 302.4 | 300.2 | 461.6 | 563.3 | MT2A | 1404.3 | 1841.4 | 2378.6 | 3 276.2 |
| NT5C3 (PN -1) | 355.1 | 365.7 | 444.3 | 491.0 | MX1 | 882.8 | 945.7 | 1871.0 | 3 084.8 |
| STAT1 | 455.3 | 431.7 | 598.9 | 747.3 | ADAR | 1755.6 | 2231.8 | 2941.5 | 3 129.6 |
| TRIM22 | 473.7 | 433.8 | 766.7 | 1002.0 | G1P2 | 778.5 | 957.3 | 2702.9 | 5 773.1 |
| SERPING1 | 171.0 | 191.0 | 289.4 | 351.0 | STAT1 | 1628.1 | 1668.9 | 2367.1 | 2 697.7 |
| NUB1 (NYREN18) | 375.1 | 338.3 | 386.7 | 427.3 | ISG20 | 2756.1 | 2355.2 | 2805.1 | 3 618.0 |
| LY6E | 1061.0 | 997.9 | 2779.7 | 5 108.7 | |||||
| G1P3 | 2399.7 | 2975.0 | 5397.0 | 8 358.2 | |||||
| IFITM1 | 7889.0 | 7262.3 | 9902.1 | 13 047.3 |
NC, non-autoimmune controls; FDR, first-degree relatives of SLE; ILE, incomplete lupus; SLE, systemic lupus erythematosus.
In order to evaluate the correlation of IFN signature gene expression with disease criteria and ANA level, we calculated the average expression value of the 60 IFN signature genes for each subject and designated this value as the IFN Gene Index (IGI). Using the mean IGI for the NC group plus 2 standard deviations as cut-off value (939·7), all samples were categorized either as IFN-high (IGI > 939·7) or IFN-low (IGI < 939·7). As shown in Fig. 2a, all samples in NC and FDR groups were IFN-low (619·6 ± 160·1 and 650·4 ± 129·5, P > 0·1). For ILE and SLE groups this analysis produced two subsets, the IFN-low subsets, designated ILE1 and SLE1, including 12 of 24 ILE patients (50%) and five of 27 SLE patients (17%), and the IFN-high subsets, designated ILE2 and SLE2, including the remaining 12 of the 24 ILE patients (50%) and 22 of 27 SLE patients (83%). The IGI value of ILE1 and SLE1 samples (629·6 ± 111·5 and 597 ± 75·5, respectively) are close to that of NC and FDR groups (P > 0·1). However, the IGI in ILE2 and SLE2 (1486·6 ± 409·2 and 1736 ± 590·3, respectively) were significantly higher than the IGI of all other groups (P < 0·001). Pearson's correlation analysis showed that the IGI value in each of the ILE and SLE samples was correlated significantly with the number of SLE criteria satisfied (R = 0·57; P < 0·0001) (Fig. 2b) and with levels of ANA measured in serum (R = 0·58; P < 0·0001) (Fig. 2c). No significant correlations were observed between IGI and individual SLE criteria (data not shown). Patients in the two IFN-high groups were more likely to be Hispanic, African American or Native American, with 61% of individuals in the two high groups falling into one of these categories; by contrast only 28% of individuals in the ILE1 + SLE1 groups were in one of these racial or ethnic groups (P = 0·0399). Review of clinical data in the ILE2 group indicated that some of these patients had overlapping conditions including features of Sjögren's syndrome, anti-phospholipid syndrome and limited scleroderma, as well as arthritis; none had nephritis or central nervous system (CNS) disease.
Fig. 2.
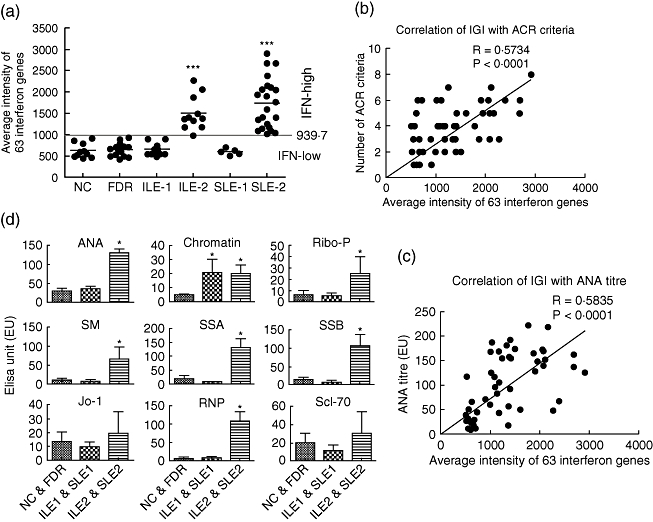
The interferon (IFN) gene index (IGI) was calculated by averaging the 63 IFN signature genes in each sample (a). Using the mean IGI plus 2 standard deviations of the non-autoimmune control (NC) group as cut-off (939·7), samples were categorized as IFN-high (IGI > 929·7) or IFN-low (IGI < 939·7). All samples in the NC and first-degree relatives (FDR) groups were IFN-low. Half of 24 ILE (50%) were IFN-low (designated ILE1) and the other half were IFN-high (ILE2). For the systemic lupus erythematosus (SLE) group, 17% (five of 27) were IFN-low (SLE1) and 83% (22 of 27) were IFN-high (SLE2). The correlations of IGI with number of disease criteria (b) and anti-nuclear antibody (ANA) titre (c) in ILE and SLE samples were calculated using Prism 5·0 software. (d) ANA and extractable nuclear autoantibodies (ENA) measured using immunoassays in three sample groups, normal (NC and FDR, n = 11), IFN-low (ILE1 and SLE1, n = 11) and IFN-high (ILE2 and SLE2 (n = 33). A non-parametric t-test (Mann–Whitney) was used to calculate the differences between each group. All autoantibodies showed similar levels of expression in the normal and IFN-low patient groups (P > 0·05), except for the antibody to chromatin, which was increased in IGI low (P < 0·05). All nine measured autoantibodies were increased in the IGI-high patient group compared with normal control and seven of them [ANA, ribosomal phosphoprotein P0 (Ribo-P0), Smith (SM), Sjögren's syndrome antigen A (SSA), SSB, ribonucleic protein (RNP)] were increased significantly (P < 0·05).
The serum autoantibody profile in the above subject groups was next defined using ELISA (for ANA) and a Luminex-based multiplex assay (for ENA) (Fig. 2d). ANA levels in ILE1 and SLE1 groups are similar to those of the NC and FDR groups (38·3 ± 30·9 and 31·2 ± 22·7 versus 20·3 ± 17·4 and 34·7 ± 47, P > 0·05), and are significantly higher in the ILE2 and SLE2 groups (125·6 ± 64·7 and 132·4 ± 46·6, P < 0·01). Similar to the ANA, five of the eight autoantibodies on the ENA panel were significantly higher in the IFN-high groups (ILE2 and SLE2) compared to the IFN-low groups (ILE1 and SLE1) (P < 0·05). Of note, the prevalence of RNP positivity in the high IFN groups (ILE2 + SLE2) was 48%, which was significantly higher than the corresponding prevalence of 5% in the low IFN groups (ILE1 + SLE1; P = 0·0018). A tendency for Ro positivity to be higher in the high IFN groups was not statistically significant (33% versus 11%; P = 0·10). Antibodies to Jo-1 and Scl-70 also showed higher mean values in the ILE2 and SLE2 groups, but the values were not statistically significantly different from the NC and FDR groups or the ILE1 and SLE1 groups (P > 0·05). In contrast, the anti-chromatin antibody levels showed a significant increase in both the ILE1 and SLE1 groups and the ILE2 and SLE2 groups, compared to NC and FDR (P < 0·05).
An autoantigen proteome array was then used to measure a larger number of IgG and IgM autoantibodies in the serum samples from 43 ILE and SLE patients, including 11 ILE1, five SLE1, eight ILE2 and 19 SLE2, as well as in seven NC and nine FDR. Unsupervised hierarchical cluster analysis was performed to distinguish the similarity among different samples based on their autoantibody expression profiles. The cluster analysis on IgG autoantibodies separated all samples into four subject clusters (Fig. 3a, cluster tree shown above heat map). Subject cluster 1, which showed low-level expression of most IgG autoantibodies, contains 19 samples that were all from IFN-low groups (six NC, six FDR, five ILE1 and two SLE1), and subject cluster 2, which showed higher expression of about half the IgG autoantibodies, also contains samples mostly from control and IFN-low groups (one NC, three FDR, four ILE1, three SLE1 and one SLE2). In contrast, subject clusters 3 and 4, which showed higher expression for most of the IgG autoantibodies, contain samples exclusively from IFN-high groups (ILE2 and SLE2) (Fig. 3a). The cluster analysis also separated the 49 IgG autoantibodies into five different clusters (Fig. 3a, cluster tree shown to the left of the heat map). IgG cluster 1 contains 10 autoantibodies including fibrinogen IV, thyroglobulin, haemocyanin, proteoglycan, matrigel, laminin, heparan HSPG, hyaluronic acid, heparan sulphate and centromere protein A (CENP-A); cluster 2 contains 11 autoantibodies including total histone, histones H1, H2B, H3, H4, PM/Scl100, PCNA, C1q, gliadin, heparin and fibrinogen S; cluster 3 contains seven IgG autoantibodies including U1snRNP-A, U1snRNP-BB’, U1snRNP-68, H2A, β2 glycoprotein I, Scl70 and TPO, cluster 4 contains 12 IgG autoantibodies including dsDNA, ssDNA, dsRNA, chromatin, glomerular extract, Ro/SSA, La/SSB, ribosomal phosphoprotein P0, myosin, β2 microglobulin and cardolipin and cluster 5 contains nine IgG autoantibodies, including collagen I, collagen II, collagen III, collagen IV, elastin, cytochrome C, glomerular basement membrane, CENP-B and LC1. The five IgG autoantibody clusters were analysed further by comparing the average expression values for all autoantibodies in each cluster between the IFN-high (ILE2 + SLE2) and IFN-low (ILE1 + SLE1) groups as well as control samples (NC + FDR). Compared to controls, the IFN-low group showed significant increases in clusters 1 and 3 (P = 0·025 and 0·03, respectively), and the IFN-high group showed significant increases in clusters 2, 3 and 4 (P = 0·001, 0·0004 and 0·0001, respectively) (Fig. 3b–f). However, the comparison between IFN-low and IFN-high groups also revealed that the IgG autoantibodies in clusters 3 and 4 were elevated significantly in IFN-high compared to IFN-low samples (P = 0·0245 and P < 0·0001) (Fig. 3d,e). There was no significant difference between the IFN-high and IFN-low groups for clusters 1, 2 and 5 (Fig. 3b,c,f). For IgG autoantibody clusters 3 and 4, we also compared the expression differences between the ILE and SLE samples in the IFN-low and IFN-high groups and found no significant difference for IgG autoantibody expression between ILE1 and SLE1 or ILE2 and SLE2 in either clusters 3 or 4 (P > 0·05). Pearson's correlation analysis showed that the autoantibodies in IgG clusters 3 and 4 were correlated highly with the corresponding IGI levels in the ILE and SLE samples (R = 0·43, P = 0·0006 in cluster 3; R = 0·49, P < 0·0001 in cluster 4).
Fig. 3.
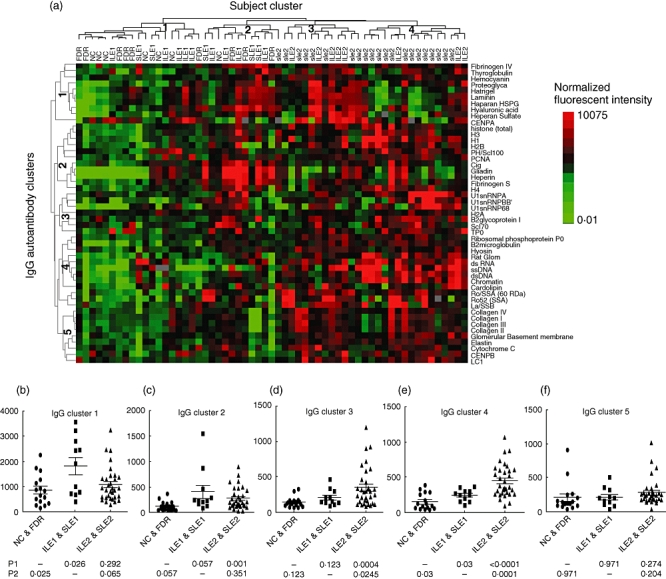
(a) Hierarchical cluster analysis of 49 immuoglobulin (Ig)G autoantibody profiles in 59 samples [seven non-autoimmune control (NC), nine first-degree relatives (FDR), nine incomplete lupus erythematosus (ILE1), five systemic lupus erythematosus (SLE1), eight ILE2 and 21 SLE2] measured on the autoantigen array. The normalized signal intensity of each antibody was analysed using Cluster/Treeview software. Each row represents one autoantibody specificity and each column represents an individual subject. The expression of each antibody in all subjects was mean-centred. Red represents expression values higher than the row mean, green represents expression values lower than the row mean, black represents values close to the row mean and grey represents missing data. All measured samples were clustered into four subject groups (19 samples in cluster 1, 12 in cluster 2, 12 in cluster 3 and 16 in cluster 4, as shown at the top of the heat map) and all autoantibodies were clustered into five IgG autoantibody clusters, with 10 autoantibodies in cluster 1, 11 in cluster 2, seven in cluster 3, 12 in cluster 4 and nine in cluster 5, shown to the left of the heat map. Cluster 1 contains 10 autoantibodies including fibrinogen IV, thyroglobulin, haemocyanin, proteoglycan, matrigel, laminin, heparan sulphate proteoglycan (HSPG), hyaluronic acid, heparan sulphate and centromere protein A (CENP-A); cluster 2 contains 11 autoantibodies including total histone, histones H1, H2B, H3, H4, PM/Scl100, proliferating cell nuclear antigen (PCNA), C1q, gliadin, heparin and fibrinogen S; cluster 3 contains seven autoantibodies including U1snRNP-A, U1snRNP-BB’, U1snRNP-68, H2A, β2 glycoprotein I, Scl70 and TPO, cluster 4 contains 12 autoantibodies including dsDNA, ssDNA, dsRNA, chromatin, glomerular extract, Sjögren's syndrome antigen A (Ro/SSA), La/SSB, ribosomal phosphoprotein P0, myosin, β2 microglobulin and cardolipin, and cluster 5 contains nine autoantibodies including collagen I, collagen II, collagen III, collagen IV, elastin, cytochrome C, glomerular basement membrane, CENP-B and LC1 (b–f). The average expression value of the IgG autoantibodies in each of the five clusters was calculated for each sample and the difference between the three sample groups [non-autoimmune control (NC) and first-degree relatives (FDR), ILE1 and SLE1, ILE2 and SLE2, representing control, interferon (IFN)-low and IFN-high, respectively] was compared using a non-parametric t-test (Mann–Whitney). P1 represents P-value compared with the control group and P2 represents P-value compared with the IFN-low group. Pearson correlation analysis showed that clusters 3 and 4 were correlated positively with IGI value in ILE and SLE samples (R = 0·43, P = 0·0006 in cluster 3; R = 0·49, P < 0·0001 in cluster 4) (data not shown).
Hierarchical clustering of IgM autoantibodies in the same set of samples generated two major subject clusters but only one major autoantibody cluster (Fig. 4a), indicating that most IgM autoantibodies showed a similar expression pattern across all samples. Among the two subject clusters, samples in cluster 1 showed much lower expression for most of the IgM autoantibodies than the samples in cluster 2 (Fig. 1a). Interestingly, the IgM subject cluster 1 contains predominantly samples from the IFN-high group (19 from ILE2 and SLE2 and two from ILE1 and SLE1, six from NC and FDR), while cluster 2 contains mostly IFN-low samples (12 from ILE1 and SLE1) and controls (10 from NC and FDR), as well as some samples from the IFN-high group (10 from ILE2 and SLE2). Overall, we noticed that most of the samples with higher IgM autoantibody expression belong to ILE1 and SLE1 groups (Fig. 4a, shown in red). Further analysis of the expression levels for the 49 IgM autoantibodies in the IFN-low (ILE1 and SLE1), IFN-high (ILE2 and SLE2) and control (NC and FDR) groups showed that the overall IgM autoantibody level is reduced significantly in IFN-high samples compared with both the IFN-low samples (58·1 ± 44 versus 136·8 ± 109, P = 0·0006) and healthy controls (58·1 ± 44 versus 89 ± 24·1, P = 0·004), but the difference between IFN-low and controls is not significant (P = 0·16) (Fig. 4B). The expression of IgM autoantibodies was correlated negatively with IFN signature gene expression (R = −0·3, P < 0·03).
Fig. 4.
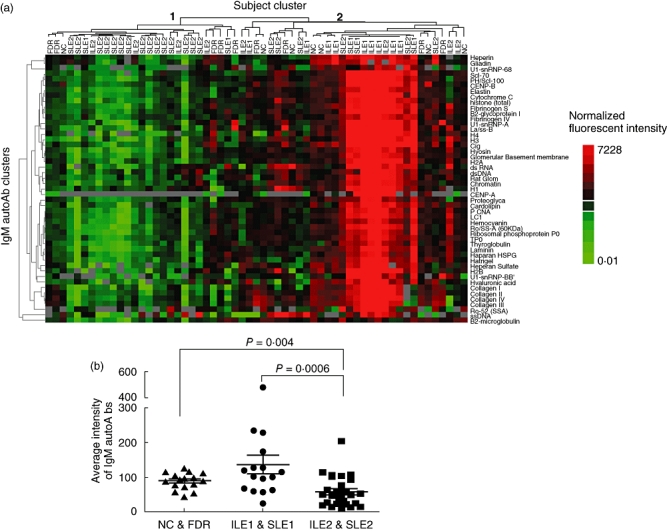
Clustering of 49 immunoglobulin (Ig)M autoantibodies in 59 samples (the same sample set as for IgG autoantibody analysis). Hierarchical cluster analysis was carried out for IgM autoantibodies, as described (Fig. 3). Two major subject clusters were generated (Fig. 4a, cluster tree shown above heat map). Subject cluster 1 contains 27 samples (19 from interferon (IFN)-high group, two from IFN-low and six from healthy controls) and subject cluster 2 contains 32 samples (12 IFN-low, 10 IFN-high and 10 healthy controls). In general, cluster 1 samples showed lower IgM autoantibody levels compared to cluster 2 samples. (b) The average signal intensity of all IgM autoantibodies was calculated for each sample and the overall IgM autoantibody expression level was compared between IFN-low [incomplete lupus erythematosus (ILE1) and systemic lupus erythematosus (SLE)], IFN-high (ILE2 and SLE2) and healthy controls [non-autoimmune control (NC) and first-degree relatives (FDR)] sample groups. The overall IgM autoantibody expression in the IFN-high group was reduced significantly compared with the IFN-low (P = 0·0006) and healthy controls (P = 0·004) groups (b). IgM autoantibody expression is correlated negatively with IGI value in ILE and SLE sample by Pearson's correlation analysis (R = −0·3, P < 0·03) (data not shown).
Discussion
The identification of patients with SLE in early stages of the disease has become an area of intense interest. Detection of incipient disease, prior to the onset of irreversible organ damage, will require the development of risk profiles and biomarkers that are reliably predictive of clinical course. Some elements of the risk profile for lupus are already recognized. One of these is the fact that autoantibodies are present in the serum of patients many years before the diagnosis of SLE is clinically apparent [15]. These data suggest that the initial insult revolves around abnormal B cell tolerance of self-antigens and that autoantibody markers in the blood have potential to aid in early diagnosis. A second known element is that FDRs of patients with autoimmune disease have enhanced risk of disease and show patterns of gene expression similar to that of patients, supporting a role for inherited traits [16–18]. However, additional quantifiable factors are needed to assess SLE risk more accurately in an individual patient, similar to the way in which multi-faceted profiles are used in clinical practice to predict the risk of cardiovascular events [19]. Our approach has been to study patients with ILE because individuals with this diagnosis are already known to have an increased risk of developing SLE. We have shown previously that autoantibody profiling of ILE patients has potential utility in determining clinically significant subsets with prognostic implications [13,20].
The current study focuses upon the interaction of gene expression and autoantibody profiles measured in peripheral blood as readily accessible and quantifiable measures of autoimmunity. The results show a gradient of change in the number of dysregulated genes that correlates with clinical abnormalities. Further examination of gene expression patterns in ILE indicates that a subset of these patients shows up-regulation of genes stimulated by Type I IFNs, a pattern that has been documented extensively to occur in a large proportion of SLE patients, especially those with increased severity and activity of the disease [10,11,21]. The present findings indicate that approximately half of ILE patients share this gene expression profile. Furthermore, in both ILE and SLE patients, ANA levels and IgG autoreactivity are associated with the high IFN state. These findings are consistent with previous reports in which a relationship between the IFN signature and autoantibodies was shown [21,22].
In order to identify which IgG autoantibody specificities were related more closely with IFN signature gene expression, we profiled a broad range of IgG autoantibodies using a proteome array approach. The 49 IgG autoantibodies were separated into five clusters based on their expression similarity across all samples and we noticed that the antibodies with similar specificities tend to cluster together, such as histones in cluster 2, U1snRNPs in cluster 3, nuclear antigens in cluster 4 and collagens in cluster 5 (Fig. 3a). Among the five IgG autoantibody clusters, only clusters 3 and 4 showed significantly increased expression in the IFN-high sample group compared to both IFN-low and control groups, and the levels of IgG autoantibodies in these two clusters were correlated positively with the level of IFN gene expression in ILE and SLE patients. It is not surprising that most of the autoantibodies in these two clusters are directed against DNA and RNA-binding proteins, such as chromatin, dsDNA, ssDNA, dsRNA, U1snRNP, Ro/SSA, La/SSB, ribosomal phosphoprotein P0 and Scl-70 (topoisomerase 1), consistent with the ELISA result (Fig. 2d) and with previous studies [21–23]. It is not yet clear whether the elevation of IgG autoantibodies in IFN-high ILE and SLE patients is induced by increased expression of IFN, or vice versa. However, several studies have demonstrated that in SLE and several other systemic autoimmune diseases, DNA- and RNA-protein complexes released by apoptotic or necrotic cells form immune complexes with autoantibodies, and these may serve as endogenous IFN inducers [24–27]. One recent study demonstrated that systemic sclerosis sera containing autoantibodies against topoisomerase I induced high levels of IFN-α expression by normal peripheral blood mononuclear cells (PBMCs) in vitro[28].
We also found that low levels of IFN in both SLE and ILE are correlated with IgM autoantibodies, which are generally less pathogenic [29]. Our previous studies showed that IgM autoantibodies were over-expressed in a subset of ILE patients [13]. The current data confirm further that the ILE patients over-expressing IgM are more likely to belong to the IFN-low group. The finding that IFN expression is correlated inversely with IgM autoantibodies and correlated positively with IgG autoantibodies suggests that this cytokine modulates class-switch from IgM to IgG. Consistent with this suggestion is the observation that deficiency of IFN-α signalling by selective knock-out of the IFN α/β receptor in murine lymphocytes impairs isotype-switching [30]. Because the preclinical phase of autoimmune disease is characterized by the presence of increasing autoantibody complexity, one possible scenario is that episodic expression of Type I IFN, as might be triggered by viral infections, for example, could stimulate in a susceptible host the development of autoantibodies which accumulate in quantity and in pathogenic features over time until a critical threshold is reached or an independent event triggers on this background the onset of the clinical syndrome.
A long-term goal of our studies in SLE is to develop prognostic biomarkers that predict the future probable course of disease in at-risk individuals, such as those with detectable autoantibodies or with a strong family history of autoimmune disease. The present results suggest that over-expression of IFN-stimulated genes may be one component of the risk profile that might be detectable in the blood at early stages of disease. Interventions to block the activity of this cytokine are currently undergoing clinical testing, and it would be of interest to determine whether quenching of the IFN signature in the early stages of disease could arrest the subsequent development of organ damaging complications.
Conclusions
A subset of patients with ILE shows patterns of IFN-induced gene expression that are similar to those observed in patients with active SLE. Longitudinal studies to determine whether these individuals are at higher risk for disease progression are in progress. Development of quantitative SLE risk profiles derived from this approach would make feasible detection and treatment of early or preclinical disease.
Acknowledgments
Special thanks are due to Sukumar Narasimhulu, Azza Mutwally Badr and Michelle Christadoss for assistance with DRADR sample collection, processing and analysis. Thanks also to Laurie Davis PhD, for helpful discussions. This study was supported by NIAMS/NIH P50AR055503. Q. Z. L. designed and carried out the microarray and protein array studies and analyses, J. Z., Y. L. and B. Z. performed the array experiments and collected array data for analysis, V. K. B. co-ordinated patient sample collection, F. C. J. performed the autoantibody assays, D. R. K. organized the study database and patient recruitment, E. K. W. and C. M. guided study design and data interpretation. Q. Z. L. and N. J. O. collected and analysed the data. N. J. O. and Q. Z. L. organized the data for publication and co-ordinated preparation of the manuscript. All authors read and approved the final version.
Disclosure
N. Olsen has an equity interest in ArthroChip LLC, which is developing novel diagnostics for autoimmune diseases.
References
- 1.Goldblatt F, Isenberg DA. New therapies for systemic lupus erythematosus. Clin Exp Immunol. 2005;140:205–12. doi: 10.1111/j.1365-2249.2005.02795.x. [DOI] [PMC free article] [PubMed] [Google Scholar]
- 2.Chakravarty EF, Bush TM, Manzi S, Clarke AE, Ward MM. Prevalence of adult systemic lupus erythematosus in California and Pennsylvania in 2000: estimates obtained using hospitalization data. Arthritis Rheum. 2007;56:2092–4. doi: 10.1002/art.22641. [DOI] [PMC free article] [PubMed] [Google Scholar]
- 3.Tan EM, Cohen AS, Fries JF, et al. The 1982 revised criteria for the classification of systemic lupus erythematosus. Arthritis Rheum. 1982;25:1271–7. doi: 10.1002/art.1780251101. [DOI] [PubMed] [Google Scholar]
- 4.Hochberg MC. Updating the American College of Rheumatology revised criteria for the classification of systemic lupus erythematosus. Arthritis Rheum. 1997;40:1725. doi: 10.1002/art.1780400928. [DOI] [PubMed] [Google Scholar]
- 5.Vila LM, Mayor AM, Valentin AH, Garcia-Soberal M, Vila S. Clinical outcome and predictors of disease evolution in patients with incomplete lupus erythematosus. Lupus. 2000;9:110–5. doi: 10.1191/096120300678828073. [DOI] [PubMed] [Google Scholar]
- 6.Swaak AJ, Van De BH, Smeenk RJ, et al. Incomplete lupus erythematosus: results of a multicentre study under the supervision of the EULAR Standing Committee on International Clinical Studies Including Therapeutic Trials (ESCISIT) Rheumatology (Oxf) 2001;40:89–94. doi: 10.1093/rheumatology/40.1.89. [DOI] [PubMed] [Google Scholar]
- 7.Gomez-Puerta JA, Martin H, Amigo MC, et al. Long-term follow-up in 128 patients with primary antiphospholipid syndrome: do they develop lupus? Medicine (Balt) 2005;84:225–30. doi: 10.1097/01.md.0000172074.53583.ea. [DOI] [PubMed] [Google Scholar]
- 8.Fabio G, Carrabba M, Hu C, Floriani M, Besana C. Dramatic development of severe SLE in a patient with an incomplete disease. Rheumatol Int. 2005;25:543–7. doi: 10.1007/s00296-004-0550-1. [DOI] [PubMed] [Google Scholar]
- 9.Stahl HC, Nived O, Sturfelt G. Outcome of incomplete systemic lupus erythematosus after 10 years. Lupus. 2004;13:85–8. doi: 10.1191/0961203304lu477oa. [DOI] [PubMed] [Google Scholar]
- 10.Baechler EC, Batliwalla FM, Karypis G, et al. Interferon-inducible gene expression signature in peripheral blood cells of patients with severe lupus. Proc Natl Acad Sci USA. 2003;100:2610–5. doi: 10.1073/pnas.0337679100. [DOI] [PMC free article] [PubMed] [Google Scholar]
- 11.Bennett L, Palucka AK, Arce E, et al. Interferon and granulopoiesis signatures in systemic lupus erythematosus blood. J Exp Med. 2003;197:711–23. doi: 10.1084/jem.20021553. [DOI] [PMC free article] [PubMed] [Google Scholar]
- 12.Wandstrat AE, Carr-Johnson F, Branch V, et al. Autoantibody profiling to identify individuals at risk for systemic lupus erythematosus. J Autoimmunity. 2006;27:153–60. doi: 10.1016/j.jaut.2006.09.001. [DOI] [PubMed] [Google Scholar]
- 13.Li Q-Z, Zhou J, Wandstrat AE, et al. Protein array profiles for insights into systemic lupus erythematosus and incomplete lupus syndromes. Clin Exp Immunol. 2007;147:60–70. doi: 10.1111/j.1365-2249.2006.03251.x. [DOI] [PMC free article] [PubMed] [Google Scholar]
- 14.Fossey SC, Vnencak-Jones CL, Olsen NJ, et al. Identification of molecular biomarkers for multiple sclerosis. J Mol Diagn. 2007;9:197–204. doi: 10.2353/jmoldx.2007.060147. [DOI] [PMC free article] [PubMed] [Google Scholar]
- 15.Arbuckle MR, McClain MT, Rubertone MV, et al. Development of autoantibodies before the clinical onset of systemic lupus erythematosus. N Engl J Med. 2003;349:1526–33. doi: 10.1056/NEJMoa021933. [DOI] [PubMed] [Google Scholar]
- 16.Wakeland EK, Liu K, Graham RR, Behrens TW. Delineating the genetic basis of systemic lupus erythematosus. Immunity. 2001;15:397–408. doi: 10.1016/s1074-7613(01)00201-1. [DOI] [PubMed] [Google Scholar]
- 17.Giles I, Isenberg D. Lupus in the family – analysis of a cohort followed from 1978–1999. Lupus. 2001;10:38–44. doi: 10.1191/096120301676871229. [DOI] [PubMed] [Google Scholar]
- 18.Maas K, Chen H, Shyr Y, Olsen NJ, Aune T. Shared gene expression profiles in individuals with autoimmune disease and unaffected first-degree relatives of individuals with autoimmune disease. Hum Mol Genet. 2005;14:1305–14. doi: 10.1093/hmg/ddi141. [DOI] [PubMed] [Google Scholar]
- 19.Anderson KM, Odell PM, Wilson PW, Kannel WB. Cardiovascular disease risk profiles. Am Heart J. 1991;121:293–8. doi: 10.1016/0002-8703(91)90861-b. [DOI] [PubMed] [Google Scholar]
- 20.Li QZ, Xie C, Wu T, et al. Identification of autoantibody clusters that best predict lupus disease activity using glomerular proteome arrays. J Clin Invest. 2005;115:3428–39. doi: 10.1172/JCI23587. [DOI] [PMC free article] [PubMed] [Google Scholar]
- 21.Kirou KA, Lee C, George S, Louca K, Peterson MG, Crow MK. Activation of the interferon-alpha pathway identifies a subgroup of systemic lupus erythematosus patients with distinct serologic features and active disease. Arthritis Rheum. 2005;52:1491–503. doi: 10.1002/art.21031. [DOI] [PubMed] [Google Scholar]
- 22.Nikpour M, Dempsey AA, Urowitz MB, Gladman DD, Barnes DA. Association of a gene expression profile from whole blood with disease activity in systemic lupus erythaematosus. Ann Rheum Dis. 2008;67:1069–75. doi: 10.1136/ard.2007.074765. [DOI] [PubMed] [Google Scholar]
- 23.Bengtsson A, Sturfelt G, Truedsson L, et al. Activation of type I interferon system in systemic lupus erythematosus correlates with disease activity but not antiretroviral antibodies. Lupus. 2000;9:664–71. doi: 10.1191/096120300674499064. [DOI] [PubMed] [Google Scholar]
- 24.Bave U, Vallin H, Alm GV, Ronnblom L. Activation of natural interferon-α- producing cells by apoptotic U937 cells combined with lupus IgG and its regulation by cytokines. J Autoimmun. 2001;17:71–80. doi: 10.1006/jaut.2001.0519. [DOI] [PubMed] [Google Scholar]
- 25.Bave U, Nordmark G, Lovgren T, et al. Activation of the type I interferon system in primary Sjögren's syndrome: a possible etiopathogenic mechanism. Arthritis Rheum. 2005;52:1185–95. doi: 10.1002/art.20998. [DOI] [PubMed] [Google Scholar]
- 26.Lovgren T, Eloranta ML, Bave U, Alm GV, Ronnblom L. Induction of interferon-α production in plasmacytoid dendritic cells by immune complexes containing nucleic acid released by necrotic or late apoptotic cells and lupus IgG. Arthritis Rheum. 2004;50:1861–72. doi: 10.1002/art.20254. [DOI] [PubMed] [Google Scholar]
- 27.Eloranta ML, Helmers SB, Ulfgren AK, Ronnblom L, Alm GV, Lundberg IE. A possible mechanism for endogenous activation of the type I interferon system in myositis patients with anti-Jo-1 or anti-Ro 52/anti-Ro 60 autoantibodies. Arthritis Rheum. 2007;56:3112. doi: 10.1002/art.22860. [DOI] [PubMed] [Google Scholar]
- 28.Kim D, Peck A, Santer D, et al. Induction of interferon-alpha by scleroderma sera containing autoantibodies to topoisomerase I: association of higher interferon-alpha activity with lung fibrosis. Arthritis Rheum. 2008;58:2163–73. doi: 10.1002/art.23486. [DOI] [PubMed] [Google Scholar]
- 29.Krippner H, Merle S, Jorgens K, Pirlet K. Antibodies to dsDNA and ssDNA in the immunoglobulin classes IgG and IgM: prognostic value in the course of SLE. Z Rheumatol. 1984;43:265–71. [PubMed] [Google Scholar]
- 30.Le BA, Thompson C, Kamphuis E, et al. Cutting edge: enhancement of antibody responses through direct stimulation of B and T cells by type I IFN. J Immunol. 2006;176:2074–8. doi: 10.4049/jimmunol.176.4.2074. [DOI] [PubMed] [Google Scholar]