

Abstract
The influenza A virus nonstructural protein NS1 is a multifunctional dimeric protein that acts as a potent inhibitor of the host cellular antiviral state. The C-terminal effector domain of NS1 binds host proteins, including CPSF30, and is a target for the development of new antiviral drugs. Here we present crystallographic structures of two mutant effector domains, W187Y and W187A, of influenza A/Udorn/72 virus. Unlike wild type, the mutants behave exclusively as monomers in solution based on gel filtration data and light scattering. The W187Y mutant is able to bind CPSF30 with a binding affinity close to the wild type protein; that is, it retains a receptor site for aromatic ligands nearly identical to the wild type. Therefore, this monomeric mutant protein could serve as a drug target for a high throughput inhibitor screening assays, since its binding pocket is unoccupied in solution and potentially more accessible to small molecule ligands.
Keywords: NS1 effector domain, influenza protein, drug target, protein engineering
1. INTRODUCTION
Influenza A viruses are virulent pathogens that cause acute respiratory disease, typically in seasonal epidemics, resulting in the death of hundreds of thousands people annually. A highly virulent H5N1 subtype of avian influenza A viruses is currently circulating among birds after first appearing in 1997 [1-3]. It has been predicted that an outbreak of avian influenza could kill between 5 million and 150 million people should H5N1 mutate or resort into a strain capable of efficient human-to-human transmission [1]. The current H1N1 flu outbreak has already caused tens of thousands of infections and hundreds of death in 74 countries.
The most effective way to prevent influenza infection is vaccination with killed or attenuated virus. However, antiviral drugs provide additional protection in the time of a rapidly spreading pandemic and may be the only effective tool against novel flu strains before effective vaccines can be developed and produced in quantity. The current antivirals were developed to target either the M2 ion channel protein (Amantadine/Rimantadine) or the neuraminidase surface protein (Oseltamivir/Zamanivir). The highly virulent H5N1 strain was reported to be resistant to both amantadine and rimantadine [4]. During the 2007-2008 flu season, 11% of H1N1 virus was found to be Oseltamivir resistant [5]. Therefore, an urgent need has emerged to define influenza targets for the development of new antiviral agents [1-3].
Influenza A virus is classified within the family of Orthomyxoviridae which is characterized by its negative-sense, single-stranded RNA genome. The influenza A virus contains eight genomic segments; segment 8 encodes the only nonstructural protein, NS1. It is a multifunctional dimeric protein that acts as a potent inhibitor of the host cellular antiviral state; its action allows the virus to escape the innate immune surveillance system [6-7]. NS1 has a strain-specific length of 230-237 residues, with a molecular weight around 26 kDa. NS1 has two distinct functional domains: an N-terminal 73 amino acid RNA-binding domain (RBD), and the C-terminal effector domain (ED).
The C-terminal effector domain was found to interact with several host cell proteins [7-11]. Among these is the binding to the second and third zinc fingers (F2F3) of the cleavage and polyadenylation specificity factor, CPSF30 [11-12]. This interaction inhibits the maturation and export of host cellular antiviral mRNAs, including that for interferon β (INF β) [13-15]. Consistent with this, mutational inactivation of the CPSF30 binding site on NS1A results in increased host cell INF β expression, and 1000 fold attenuation of viral replication [15]. Most significantly, an engineered MDCK cell line that constitutively expresses epitope-tagged F2F3 in the nucleus selectively inhibited the influenza virus A replication without affecting cellular pre-mRNA processing [11]. These results indicate that the CPSF30 binding site of NS1A protein can be targeted for the development of new antiviral drugs against influenza A virus.
The X-ray structure of the NS1A effector domain (residues 79-205) from influenza A/Udorn/72(A/Udorn) virus was solved recently [16]. It shares a similar folding to EDs from influenza A/PR8/34(PR8) and avian influenza virus A/Duck/Albany/76 [17-18]. Like the N-terminal RNA binding domain, the effector domain forms a dimer in solution. The crystallized dimers are stabilized by the pseudo-symmetrical insertion of the Trp187 indole ring into the CPSF30 binding pocket of its dimeric partner.
In order to expedite drug screening of this potential drug target, efforts have been made to engineer a mutant of the effector domain that retains the wild type binding affinity toward CPSF30, but remains monomeric in solution. In that way, the CPSF30 binding pocket will be unblocked, and exposed to potential inhibitors. Here, we report the crystal structures of the W187Y and W187A mutant NS1A-EDs (residue 79-205) from influenza A/Udorn/72(A/Udorn) virus strain. Both proteins exist as monomers in solution, and are capable of binding CPSF30. The W187Y mutant shows almost wild type binding affinity toward CPSF30, and could serve as a drug target for the development of new antiviral drugs against influenza A virus.
2. MATERIALS AND METHODS
2.1 Purification and expression of wild type and mutant proteins
The wild type effector domain (residue 79-205) of Udorn NS1A was constructed as previously described [16]. The mutations were introduced in plasmid pET46 by site-directed mutagenesis, according to the Stratagene protocol (Stratagene). Around 50 ng of plasmid and 150 ng of each primer were combined with reaction buffer (20 mM Tris–HCl (pH 7.5), 8 mM MgCl2, 7.5 mM DTT, 50 μg/ml of bovine serum albumin (BSA)), 150 μM dNTP mix, 1 units of KOD Hot Start DNA Polymerase (Novagen), and deionized water to final volume of 50 μl. Primer sequences for W187A mutant were CATCGGAGGACTTGAAGCGAATGATAACACAGTTC and GAACTGTGTTATCATTCGCTTCAAGTCCTCCGATG; primer sequences for W187Y mutant were CATCGGAGGACTTGAATATAATGATAACACAGTTC and GAACTGTGTTATCATTATATTCAAGTCCTCCGATG. The sequence of the desired mutation was confirmed by DNA sequencing at the ICMB core facilities. The 87 amino acids corresponding to residue 34-121 of CPSF30 were PCR amplified with primers GACGACGACAAGATGGACAAGTCGGGCGCTGC and GAGGAGAAGCCCGGTTTAGATCTTGGACTCGGGG. The product was cloned into pET46 Ek/LIC (Novagen). Both wild type and mutant proteins were expressed and purified as previously described [16].
2.2 Crystallization
Both crystals of the W187A and W187Y mutant NS1-ED were grown in the same condition at 277 K using the sitting-drop method. 5 μl protein solution (10 mg/ml in 50 mM HEPES pH 8.0, 0.1 M NaCl) was mixed with 5 μl reservoir solution and equilibrated against a reservoir containing 800 μl 0.3 M magnesium formate and 0.1 M Bis-Tris (pH 5.5). This condition was found using the Hampton Research Index HT Screen kit.
2.3 Data collection and processing
Crystals of the effector domain of Udorn NS1A were cryoprotected by dipping in an artificial mother liquor containing 30% PEG4000. Crystals, mounted in a cryoloop (Hampton Research), were flash frozen by dipping in liquid nitrogen and placed in the cold stream on the goniostat. Diffraction data were collected at 100 K on a MAR345 image plate detector (Marresearch) with X-rays generated by a Rigaku Micromax007 rotating anode generator (Rigaku, The Woodlands, TX) operated at 40 mV, 30 mA. Diffraction data were integrated and scaled using HKL2000 [19].
2.4 Structure determination and refinement
The initial molecular replacement model for the primitive cell crystal was obtained using the wild type NS1-ED protein as a model [16]; the search was conducted using the program MOLREP [20]. Subsequent density modification and refinement were carried using CNS [21] and Refmac [22]. Individual atomic isotropic temperature factors were refined. Molecular visualization and rebuilding were done using COOT [23]. Water was identified using COOT based on an Fo-Fc difference map. Five percent of the diffraction data were set aside throughout refinement for cross-validation [24]. PROCHECK was used to make the Ramachandran plots [25]. Model pictures were made using PYMOL (Delano Scientific, San Carlos, CA).
2.5 Analytical gel filtration
The multimeric state of the mutant protein was studies by analytical gel filtration. The experiments were performed on a Superdex 75 column on the AKTA system (GE Healthcares) in a buffer containing 10 mM HEPES (pH7.5) and 300 mM NaCl. The concentration of protein was 200 μM, assuming monomeric structure, before injection into the FPLC system. Eluted fractions were run on 12% SDS-PAGE and analyzed by coomassie staining.
2.6 Isothermal titration calorimetry (ITC)
A MicroCal VP-ITC calorimeter was used to measure the binding affinity of CPSF30 (F1F3; residue 34-121) to NS1 effector domain protein (wild type and mutants). Stock solutions of CPSF30 (F1F3) and NS1-ED were prepared by dialysis of the purified proteins against a buffer containing 10 mM Na-HEPES (pH 7.5), 20 mM KCl, and were degassed before loading into the calorimeter. The sample cell (1.4ml) contained 15 μM CPSF30 (F1F3), which was titrated with 290 μM NS1-ED (wild type and mutants), with a stirring speed of 300 rpm. The injections after saturation were used to determine the background signal. Data analysis was carried out by nonlinear least-squares fitting to a single site binding model as defined in the Origin software package (OriginLab, Northampton, MA).
2.7 Light scattering (LS)
Multiangle light scattering experiments were performed as previously described [26] with the following modifications: the buffer was 50 mM HEPES (pH 7.5) with 100 mM NaCl; the protein concentration was 300 μM for all samples. A Dawn model EOS multiangle light scattering photometer (Wyatt Technology, Santa Barbara, CA) with a wavelength of 690 nm was used in all experiments. A TSK-GEL G3000PWXL size exclusion column (Tosoh Bioscience, Montgomeryville, PA) at a flow rate of 0.4 ml/min was used. Bovine serum albumin (Sigma A 1900) at 2.5 mg/ml was used for normalization of the light scattering detectors of the EOS. The data were analyzed with Astra software version 4.90.08 supplied by Wyatt.
3. RESULTS AND DISCUSSION
3.1 X-ray structure determination
Both recombinant, His tagged, effector domain mutants (W187A and W187Y) can be expressed in good yield from Escherichia coli (∼10 mg/ liter of cell culture). A screen of crystallization conditions showed that both W187A and W187Y mutants form diffraction quality crystals in the same condition. Both types are orthorhombic with space group P212121. The cell constants for the W187A mutant are a = 47.78, b = 48.19, c =154.59Å. The W187Y mutant has a slightly larger unit cell, a = 48.0, b = 60.24, and c = 132.66 Å. There are two molecules in the asymmetric unit of each, giving a Vm value of 2.78 Å3/Da for W187A mutant, and 3.0 Å3/Da for W187Y mutant. X-ray data and refinement statistics for the two structures are shown in Table 1. A section of the final 2Fo-Fc electron density map used for model construction is shown in Figure 1.
Table 1.
Data collection and model refinement statistics
| Data Collection | W187A | W187Y |
|---|---|---|
| Wavelength (Å) | 1.5418 | 1.5418 |
| Space group | P212121 | P212121 |
| Cell dimensions | ||
| a, b, c (Å) | 47.78, 48.19, 154.69 | 47.99, 60.24, 132.66 |
| Resolution (Å) (last shell) | 30 – 2.1 (2.21-2.29) | 30 – 2.21 (2.21-2.29) |
| Rmerge (%) (last shell) | 3.7 (9.8) | 4.8 (24.2) |
| <I/σI> (last shell) | 79.0 (23.9) | 51.4 (6.2) |
| Completeness (last shell) | 99.3 (92.8) | 99.0 (90.5) |
| Redundancy | 13.4 | 10.0 |
| Refinement | ||
| No. reflections | 17384 | 18310 |
| Rworking (last shell) | 0.187 (0.202) | 0.221 (0.292) |
| Rfree (last shell) | 0.233 (0.285) | 0.257 (0.311) |
| Average B factor for protein atom (Å2) | 29.4 | 37.9 |
| R.m.s deviation from ideality | ||
| Bond lengths (Å) | 0.010 | 0.008 |
| Bond angles (°) | 1.138 | 1.003 |
Figure 1.
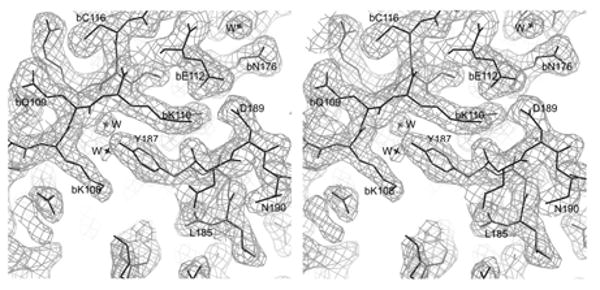
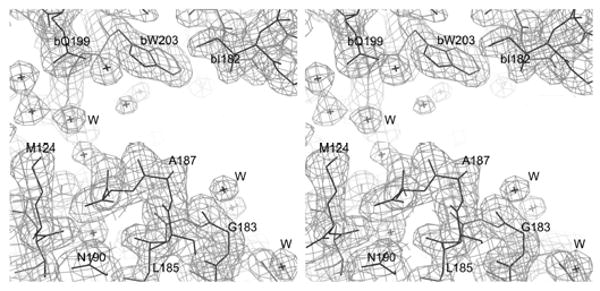
Electron density for the (a) W187A and (b) W187Y mutant of NS1A effector domain. (a) This is a section of a 2F0-Fc map contoured at 1σ to show the exposed CPSF30 binding pocket. (b) This is a section of a 2F0-Fc map contoured at 1σ to show the interface of the ED dimer due to crystallographic packing.
Following refinement, a Ramachandran plot of the W187A crystal showed 89.2% of residues to be in the most favorable region and 10.3% in the additionally allowed space. The refined structure includes 230 solvent molecules. The W87Y crystal had a Ramachandran plot with 87.6% of residues in the most favorable region and 12.4% in additionally allowed space. That refined structure includes 83 solvent molecules.
3.2 Structure of NS1A effector domain mutants
The structures of the mutant NS1-ED each show an α-helix β-crescent fold essentially identical to that of wild type protein [16]. Briefly, five of the six β-strands of each molecule form an antiparallel β-sheet surrounding a long central α-helix, and making an extensive network of hydrophobic interactions with it. Like the wild type protein, both mutants contain two molecules in the crystallographic asymmetric unit; the two molecules are essentially identical with one another. The rms deviation of the independent Cα chains is 0.18 Å for the W187A mutant, and 0.29 Å for the W187Y mutants.
A superposition of the mutant EDs with wild type ED (Figure 2) gives an rms distance between 123 Cα atoms of 0.16 Å and 0.39 Å for W187A mutant and W187Y mutant respectively. The only significant differences are between the W187Y mutant and wild type structures. They lie at the N-terminus and in one loop region. In the W187Y mutant, the Cα atom of the N-terminal A86 is shifted toward the antiparallel β-sheet ∼8 Å; residues 136-140 are shifted up to ∼2.5 Å toward the N-terminus that backbone nitrogen of F138 is within hydrogen bond distance of the sulfur atom of S87. These small differences are far from the receptor site and probably arise from packing differences due to slight variations in crystallization conditions.
Figure 2.
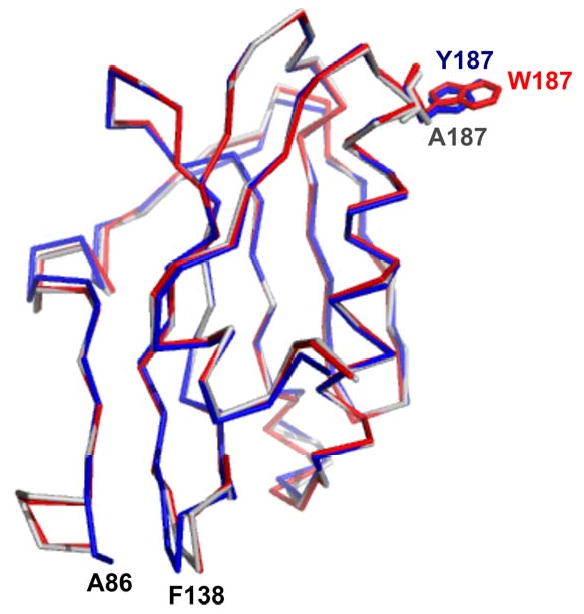
Superposition of wild type effector domain with W187Y and W187A mutant effector domains. The Cα trace of wild type effector domain is shown in red bonds, the Cα trace of W187Y mutant effector domain is shown in blue bonds, and that of W187A mutant effector domain is shown in grey bonds. The side chain of W187, Y187 and A187 are highlighted by presentation in stick mode.
The wild type ED structure had two molecules per asymmetric unit. It has been shown that the non crystallographic dimer was stabilized by the insertion of the W187 side chain of one monomer into the hydrophobic receptor pocket on its neighbor [16-18]. The receptor pocket is formed largely from the side chains of residues I117, I119, V180, Q109, Q121, K 108 and K110, and the backbone loop formed by G183 and G184. This shallow pocket is functionally used to bind nonpolar groups from target proteins like CPSF30. The W187Y mutant forms a non-crystallographic dimer very similar to that of the wild type protein. This is shown in Figure 3a, where we see the mutant Tyr side chain binding in a fashion similar to the wild type Trp. Figure 4 shows a detailed comparison of the Trp and Tyr positions. The phenol group of the mutant protein Tyr187 lies in exactly the same plane as the indole ring of wild typeTrp187. The hydroxyl end of phenol group shifts 10° toward the edge of the hydrophobic pocket of its dimer partner as compared to the orientation of indole ring. In contrast to the packing of the W187Y mutant, the non-crystallographic dimer of the W187A mutant is very different, as shown in Figure 3b. It is clear that the NS1 monomer, as marked by the central helix, has rotated roughly 90°. The mutant Ala side chain projects into the solvent while the CPSF30 receptor side is open and available to bind small ligands. Solution studies were undertaken to assess the strength of the W187Y dimerization.
Figure 3.

The crystallographic dimer interface for (a) W187Y and (b) W187A mutant NS1-effector domain. A space filling model of crystallographic monomer A contains a distinct, largely hydrophobic pocket that has evolved to bind aromatic residues from the F2F3 domain of CPSF30; the residues lining that receptor pocket are shown in red. This pocket is filled by the Y187 of crystallographic monomer B of W187Y mutant. The pocket is unoccupied and exposed to solvent in the W187A mutant.
Figure 4.
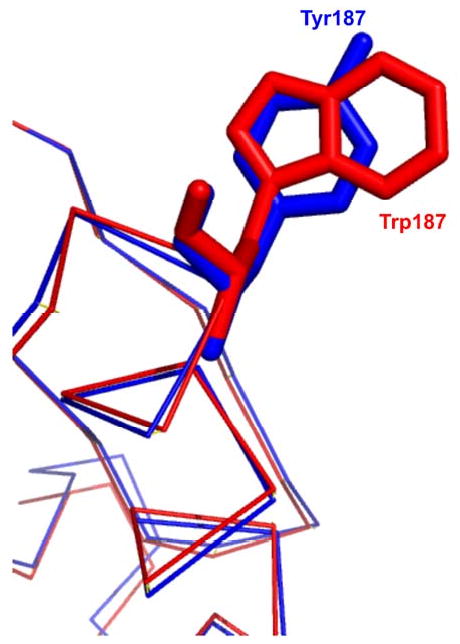
A detailed view of Trp 187 and Tyr 187 in the superposition of wild type effector domain with W187Y mutant effector domain.
3.3 Solution Studies
The multimeric state of the NS1-ED mutants was measured in solution by gel filtration. As shown in Figure 5, the wild type elutes as a dimer whereas both W187A and W187Y mutant proteins eluted in a volume equivalent to a monomer. SDS-PAGE analysis showed that the denatured wild type and both mutant proteins exhibited identical mobility, consistent with the monomer (data not shown). These results are consistent with data from the NS1-ED of avian influenza virus A/Duck/Albany/76. In that case, tryptophan 187 was found to be essential for the effector domain dimerization; the wild type protein eluted from a column as a dimer and a W187A mutant as a monomer [18]. Interestingly, the light scattering studies of our wild type NS1-ED reveal that the protein exits largely as a monomer in solution at a concentration of 300 μM. As shown in Figure 6, the calculated mass for the wild type NS1-ED is 18 kDa, which is slightly higher than the molecular weight of a monomeric NS1-ED (16 kDa). This result suggests the gel filtration result may not reflect the true oligomeric state of wild type NS1-ED in solution. In contrast, the calculated mass for both mutant NS1-ED is exactly 16 kDa, the size of the monomeric protein. This suggests that the wild type protein is partially dimerized compared to the mutants.
Figure 5.
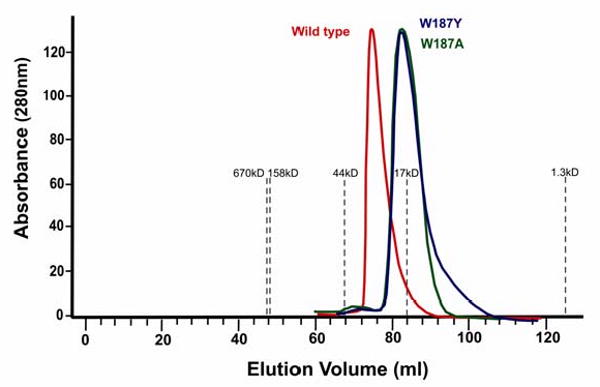
HPLC profiles of wild type and mutant NS1A-ED. The wild type elution profile is shown as a red line, the W187A mutant is shown in green, and the W187Y mutant is shown in blue. Absorbance was measured at 280 nm, and the gray dashed lines indicate the position of protein standards. From left to right, they are: thyroglobulin (670kD), bovine gamma globulin (158kD), chicken ovalbumin (44 kD), equine myoglobin (17kD) and Vitamin B12 (1.35kD).
Figure 6.
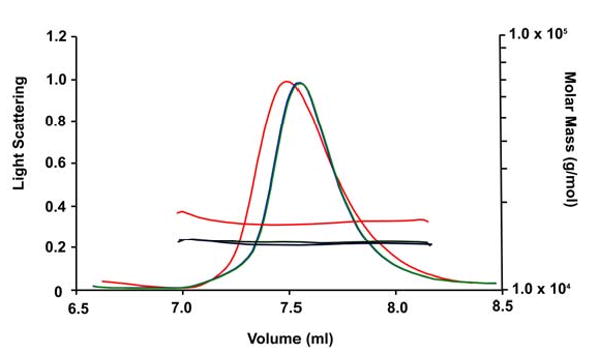
Light scattering measurement of wild type and mutant NS1A-ED. Light scattering signals, and conversion to molar mass distributions as a function of elution volume are shown for each sample. The wild type elution profile is shown as a red line, the W187A mutant is shown in green, and the W187Y mutant is shown in blue.
Although both mutants of NS1-ED behave as monomers in solution, we saw the asymmetric unit in both crystals has two molecules. The W187Y mutant dimer is similar to the wild type NS1-ED. That is, the main interaction for this non-crystallographic dimer formation appears to be the pseudo-symmetrical insertion of Tyr187 phenol group into the hydrophobic CPSF30-binding pocket of its dimer partner. Tyrosine is 30 % less hydrophobic than tryptophan based on the hydrophobicity index of amino acid measured at pH7.0 [27] and has less surface area to make van der Waals contact in the pocket. It is reasonable to assume that this interaction is weaker than that for the wild type protein, again, consistent with our observation that the mutant behaves as a monomer in solution. The dimerization in the crystal must reflect very subtle crystal packing forces. The W187A mutant is unable to bury the side chain of position 187 in a neighboring molecule. Unable to form this particular interaction, it does form what is apparently a novel, but adventitious, interaction in the crystal. This pairing probably has no significance for the protein structure under physiological conditions, where it exits as a monomer.
3.4 The W187Y mutant could serve as a drug screening target
The cleavage and polyadenylation specificity factor (CPSF30) is involved in the cleavage of 3′ signal regions of newly synthesized pre-message RNA during eucaryotic gene transcription. This cleavage is critical for the subsequent addition of polyadenine tails by polyadenine polymerase, an essential step for the 3′ end processing of cellular pre-mRNA [13-15]. The binding of NS1 to CPSF30 inhibits its action and is an important aspect of the viral mechanism to inhibit the host cell innate immunity response to infection [8]. As a consequence, NS1-ED is a potential antiviral drug design target; identifying strong ligands to its receptor site would retard the virus's ability to limit host defenses. Indeed, virus expressing a mutation that disrupts the ED receptor site are attenuated 1000 fold in replication [15]. However, high throughput screening of drug candidates for the NS1-ED may be hindered by thetendency of the wild typeprotein to dimerize, which blocks the potential ligand binding site.
CPSF30 contains five C3H zinc finger repeats, but the second and third fingers (F2F3) are sufficient for efficient binding to NS1A [11, 28]. To test if the two mutant NS1A-EDs (W187A and W187Y) are able to bind CPSF30, we carried out a GST pull down assay as described by others [11]. Both mutants were able to bind CPSF30 (data not shown). We then used isothermal titration calorimetry to quantitatively analyze the binding affinity toward CPSF30 of the wild type and the two mutants. In each case the effector domain was titrated into to the 87 amino acid target protein, that is residue 34-121 of CPSF30. This peptide represents the first three Zinc finger repeats (F1F3). As shown in Figure 7, the stoichiometry of NS1-ED binding to CPSF30 (F1F3) appears to be 1:1. This is consistent with what was observed in the X-ray structure of the ED-F2F3 complex, in which one molecule of F2F3 was bound to one molecule of NS1-ED [29]. The integrated titration curves were fit to a single site binding model, and gave a Kd of 0.07 μM for the wild type effector domain, 3 μM for the W187A mutant, and 0.4 μM for the W187Y mutant. The corresponding enthalpy and entropy change of the binding are -7.7 kcal/mol and 9.3 cal/mol for the wild type effector domain, -8.2 kcal/mol and -2.4 cal/mol for the W187A mutant, -9.0 kcal/mol and -1.5 cal/mol for the W187Y mutant.
Figure 7.
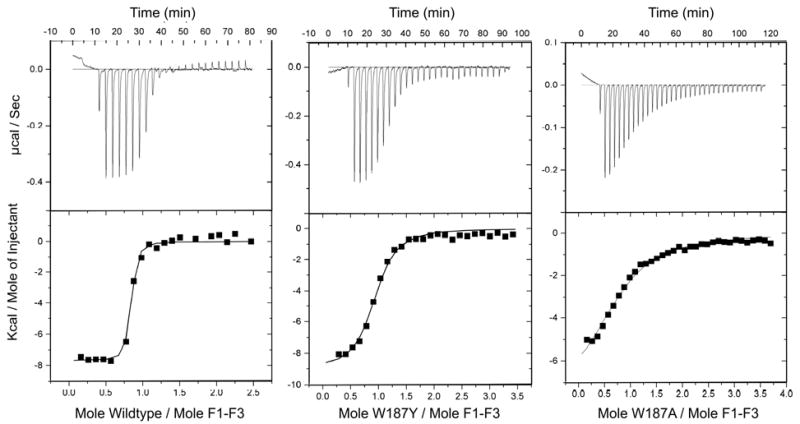
Calorimetry data for titration of NS1-ED (a) wild type, (b) W187A and (c) W187Y into CPSF30 (F1F3). The upper panel shows the heat change observed with titration. The lower panel plots the integration of the peaks using the Origin software package.
The NS1-ED complexed with F2F3 of CPSF30 is reported to be a hetrotetramer consisting of two molecules of each protein [28]. It is possible that the wild type NS1-ED/F1F3 complexation equilibrium is coupled to the self-association equilibrium of NS1-ED, and results in the difference in binding affinities of the wild type and mutant NS1-EDs for F1F3. Unlike gel filtraton data, our light scattering results show that the wild type NS1-ED behaves largely as a monomer at the concentration of protein used in ITC experiments and so the impact of coupled equilibrium may be limited. Converting Trp 187 to Tyr reduces binding affinity about six-fold, while converting it to Ala reduces binding by forty fold. Conversion of Trp 187 to Tyr disrupts homodimer formation at least 100 fold, but only retards formation of a complex with F1F3 four fold.
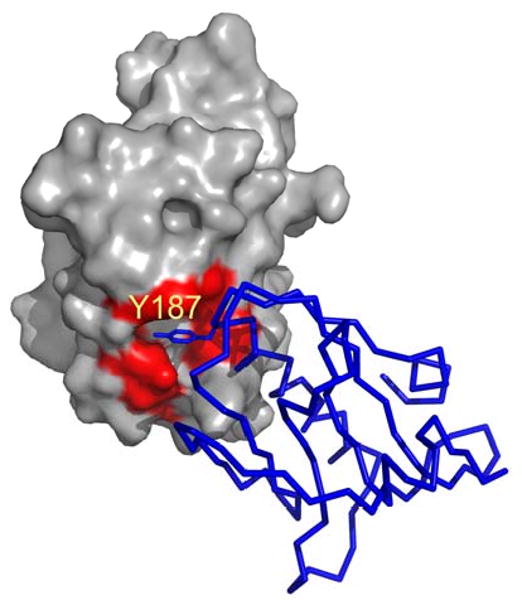
This observation raises a question about the role of the Trp 187 side chain in CPSF30 binding and in potential ligand/inhibitor binding. Figure 8 shows part of the interface of the ED with the F2F3 unit of CPSF30 [29]. We see that the shallow receptor pocket, defined above and shown in red in the figure, accommodates three aromatic rings, Y97, F98, and F102 from CPSF30. This pocket is a reasonable target for inhibitor screening, that is for small ligands that could bind here and retard ED binding to target proteins like CPSF30. W187 of ED is shown in blue in the figure; it forms part of one side of the pocket and makes some interaction with the aromatic groups, but is not a major part of the receptor pocket. The Tyr side chain of the W187Y mutant should work well to define the receptor pocket during the screening of small molecule ligands.
Figure 8.
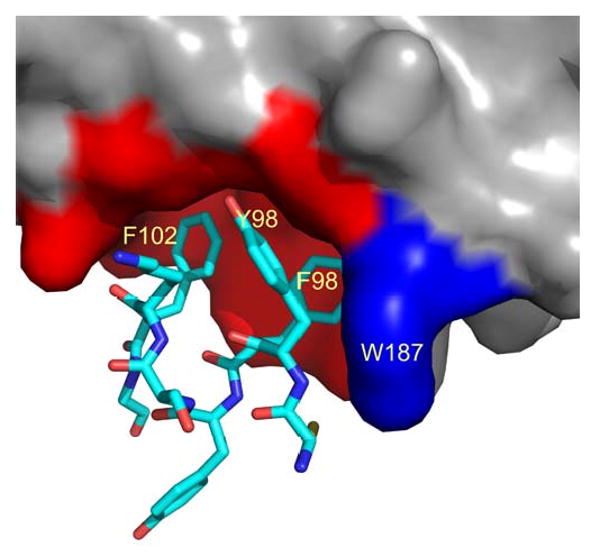
Structure of the interface between NS1-ED and F2F3 of CPSF30. The PDB code is 2RHK. The surface of ED is shown in grey but the receptor pocket (I117, I119,Q121, V180, K108, K110, G183, and G184) is colored red. W187 is shown in blue. Residues 96-103 from F2F3 are shown as sticks.
This shallow receptor pocket is only part of the binding interactions between ED and the whole CPSF30 protein. If all of the F2F3 domain were shown in Figure 8, one would see that W187 fits into a pocket in that peptide, which we will call pocket F; among other interactions, the indole ring of W187 makes a perpendicular interaction with F112 of pocket F. In this context, our ITC results are very encouraging. They show the W187Y ED protein binds only 4 fold less tightly to F1F3 than the wild type does. This corresponds to about 0.5 Kcal/mole weaker free energy of interaction with the entire F1F3 domain of CPSF30. Such a small change may reflect the poorer binding of the phenol ring compared to the indole ring into pocket F. This in turn suggests that the interactions of the three aromatic rings of F2F3 in the ED receptor pocket are essentially identical between the wild type and the W187Y mutant.
Recently, a large scale sequence analysis of 2,620 influenza NS1 proteins from all subtypes and all hosts revealed that Trp187 is highly conserved as are the other residues that interact with CPSF30 [30]. This suggests that an inhibitor target to this F2F3 binding pocket on the NS1 effector domain would probably be effective against all influenza A virus. In conclusion, we have engineered a W187Y mutant of NS1 effector domain, which behaves as a monomer in solution but is still able to binding CPSF30 with binding affinity close to the wild type protein. This mutant could serve as a drug target for a HT screening assay since the binding pocket is completely accessible to potential inhibitors.
Coordinates of the refined models of the W187A and W187Y crystals have been deposited in the Protein Data Bank with entry codes 3KWG and 3KWI, respectively.
Acknowledgments
We thank Mitra Rana for the technical assistance in the light scattering experiment. This work was supported by NIH grants AI 074497 and AI 075509, by the Robert A. Welch Foundation grant F-1225, and by the College of Natural Sciences support to the Center for Structural Biology.
Footnotes
Publisher's Disclaimer: This is a PDF file of an unedited manuscript that has been accepted for publication. As a service to our customers we are providing this early version of the manuscript. The manuscript will undergo copyediting, typesetting, and review of the resulting proof before it is published in its final citable form. Please note that during the production process errors may be discovered which could affect the content, and all legal disclaimers that apply to the journal pertain.
References
- 1.Khanna M, Kumar P, Choudhary K, Kumar B, Vijayan VK. J Biosci. 2008;33:475–482. doi: 10.1007/s12038-008-0066-z. [DOI] [PMC free article] [PubMed] [Google Scholar]
- 2.Li KS, Guan Y, Wang J, Smith GJ, Xu KM, Duan L, Rahardjo AP, Puthavathana P, Buranathai C, Nguyen TD, Estoepangestie AT, Chaisingh A, Auewarakul P, Long HT, Hanh NT, Webby RJ, Poon LL, Chen H, Shortridge KF, Yuen KY, Webster RG, Peiris JS. Nature. 2004;430:209–213. doi: 10.1038/nature02746. [DOI] [PubMed] [Google Scholar]
- 3.Webby RJ, Webster RG. Science. 2003;302:1519–1522. doi: 10.1126/science.1090350. [DOI] [PubMed] [Google Scholar]
- 4.Harrod ME, Emery S, Dwyer DE. Med J Aust. 2006;185:S58–61. doi: 10.5694/j.1326-5377.2006.tb00709.x. [DOI] [PubMed] [Google Scholar]
- 5.Lowen AC, Palese P. Infect Disord Drug Targets. 2007;7:318–328. doi: 10.2174/187152607783018736. [DOI] [PubMed] [Google Scholar]
- 6.Krug RM, Yuan W, Noah DL, Latham AG. Virology. 2003;309:181–189. doi: 10.1016/s0042-6822(03)00119-3. [DOI] [PubMed] [Google Scholar]
- 7.Hale BG, Randall RE, Ortin J, Jackson D. J Gen Virol. 2008;89:2359–2376. doi: 10.1099/vir.0.2008/004606-0. [DOI] [PubMed] [Google Scholar]
- 8.Nemeroff ME, Barabino SM, Li Y, Keller W, Krug RM. Mol Cell. 1998;1:991–1000. doi: 10.1016/s1097-2765(00)80099-4. [DOI] [PubMed] [Google Scholar]
- 9.Aragon T, de la Luna S, Novoa I, Carrasco L, Ortin J, Nieto A. Mol Cell Biol. 2000;20:6259–6268. doi: 10.1128/mcb.20.17.6259-6268.2000. [DOI] [PMC free article] [PubMed] [Google Scholar]
- 10.Min JY, Li S, Sen GC, Krug RM. Virology. 2007;363:236–243. doi: 10.1016/j.virol.2007.01.038. [DOI] [PubMed] [Google Scholar]
- 11.Twu KY, Noah DL, Rao P, Kuo RL, Krug RM. J Virol. 2006;80:3957–3965. doi: 10.1128/JVI.80.8.3957-3965.2006. [DOI] [PMC free article] [PubMed] [Google Scholar]
- 12.Li Y, Chen ZY, Wang W, Baker CC, Krug RM. Rna. 2001;7:920–931. doi: 10.1017/s1355838201010226. [DOI] [PMC free article] [PubMed] [Google Scholar]
- 13.Shimizu K, Iguchi A, Gomyou R, Ono Y. Virology. 1999;254:213–219. doi: 10.1006/viro.1998.9555. [DOI] [PubMed] [Google Scholar]
- 14.Kim MJ, Latham AG, Krug RM. Proc Natl Acad Sci U S A. 2002;99:10096–10101. doi: 10.1073/pnas.152327499. [DOI] [PMC free article] [PubMed] [Google Scholar]
- 15.Noah DL, Twu KY, Krug RM. Virology. 2003;307:386–395. doi: 10.1016/s0042-6822(02)00127-7. [DOI] [PubMed] [Google Scholar]
- 16.Xia S, Monzingo AF, Robertus JD. Acta Crystallogr D Biol Crystallogr. 2009;65:11–17. doi: 10.1107/S0907444908032186. [DOI] [PMC free article] [PubMed] [Google Scholar]
- 17.Bornholdt ZA, Prasad BV. Nat Struct Mol Biol. 2006;13:559–560. doi: 10.1038/nsmb1099. [DOI] [PubMed] [Google Scholar]
- 18.Hale BG, Barclay WS, Randall RE, Russell RJ. Virology. 2008;378:1–5. doi: 10.1016/j.virol.2008.05.026. [DOI] [PubMed] [Google Scholar]
- 19.Otwinowski Z, Minor W. Methods Enzymol. 1997;27:307–326. doi: 10.1016/S0076-6879(97)76066-X. [DOI] [PubMed] [Google Scholar]
- 20.Vagin A, Teplyakov A. J Appl Cryst. 1997;30:1022–1025. [Google Scholar]
- 21.Brunger AT, Adams PD, Clore GM, DeLano WL, Gros P, Grosse-Kunstleve RW, Jiang JS, Kuszewski J, Nilges M, Pannu NS, Read RJ, Rice LM, Simonson T, Warren GL. Acta Crystallogr D Biol Crystallogr. 1998;54(Pt 5):905–921. doi: 10.1107/s0907444998003254. [DOI] [PubMed] [Google Scholar]
- 22.CCP4. Acta Cryst. 1994;D5:760–763. doi: 10.1107/S0907444994003112. [DOI] [PubMed] [Google Scholar]
- 23.Emsley P, Cowtan K. Acta Crystallogr D Biol Crystallogr. 2004;60:2126–2132. doi: 10.1107/S0907444904019158. [DOI] [PubMed] [Google Scholar]
- 24.Brunger AT. Acta Crystallogr D Biol Crystallogr. 1993;49:24–36. doi: 10.1107/S0907444992007352. [DOI] [PubMed] [Google Scholar]
- 25.Laskowski RA, MacArthur MW, Moss DS, Thornton JM. J App Cryst. 1993;26:283–291. [Google Scholar]
- 26.Callaway KA, Rainey MA, Riggs AF, Abramczyk O, Dalby KN. Biochemistry. 2006;45:13719–13733. doi: 10.1021/bi0610451. [DOI] [PubMed] [Google Scholar]
- 27.Kyte J, Doolittle RF. J Mol Biol. 1982;157:105–132. doi: 10.1016/0022-2836(82)90515-0. [DOI] [PubMed] [Google Scholar]
- 28.Barabino SM, Hubner W, Jenny A, Minvielle-Sebastia L, Keller W. Genes Dev. 1997;11:1703–1716. doi: 10.1101/gad.11.13.1703. [DOI] [PubMed] [Google Scholar]
- 29.Das K, Ma LC, Xiao R, Radvansky B, Aramini J, Zhao L, Marklund J, Kuo RL, Twu KY, Arnold E, Krug RM, Montelione GT. Proc Natl Acad Sci U S A. 2008;105:13093–13098. doi: 10.1073/pnas.0805213105. [DOI] [PMC free article] [PubMed] [Google Scholar]
- 30.Darapaneni V, Prabhaker VK, Kukol A. J Gen Virol. 2009 doi: 10.1099/vir.0.011270-0. Epub ahead of print. [DOI] [PubMed] [Google Scholar]