

Abstract
Diabetes is associated with an activated renal renin-angiotensin-aldosterone system (RAAS) and it was shown that streptozotocin (STZ)-induced diabetic rats had increased whole kidney protein levels of the epithelial sodium channel subunits (α-, β- and γ-ENaC). However, the role of the RAAS on the regional, i.e., cortical versus medullary, regulation of ENaC is unclear. Male Sprague-Dawley rats were injected with STZ (intravenous, 65 mg/kg·bw, n=12/group). After 14 days, half of them received drinking water with candesartan (2 mg/kg·bw/day), an angiotensin-II type-1 receptor (AT1R) antagonist, for one week. In the medulla, i.e., inner stripe of the outer medulla (ISOM), base and/or tip of the inner medulla, immunoblotting revealed increased protein abundances of α1 Na-K-ATPase and ENaC subunits with diabetes (200–600% of controls), which were not reversed by candesartan. In fact, candesartan increased all ENaC subunits and α1 Na-K-ATPase in the ISOM and/or base in control rats. In contrast, in the cortex, diabetes did not increase these proteins. However, candesartan reduced cortical β- and γ-ENaC regardless of diabetic state. In summary, diabetes-induced increases in ENaC were seen preferentially in the medulla. These changes appeared to be due to a mechanism clearly distinct from AT1R activation, because they were not abolished by candesartan. In fact, candesartan treatment tended to increase some of these medullary proteins, perhaps in compensation for increased NaCl load. In contrast, cortical β- and γ-ENaC were reduced by candesartan regardless of diabetic state suggesting their regulation by AT1R at this site; however this did not appear to be a site of diabetes-induced ENaC up-regulation.
Keywords: Epithelial transporters, AT1R antagonist, angiotensin II, angiotensin receptor
INTRODUCTION
Uncontrolled diabetes mellitus (DM) is associated with natriuresis and diuresis. The kidney adapts to sodium and water losses associated with DM via upregulation of both sodium and water transport proteins. In this regard, we have shown that streptozotocin (STZ)-induced type I diabetic rats have significantly increased abundances of renal epithelial sodium transporters and channels of the distal tubule, e.g., the thiazide-sensitive Na-Cl cotransporter (NCC) and the epithelial sodium channel (ENaC) subunits in whole kidney homogenates [1]. In addition, urea transporters, aquaporin 2 (AQP2), and the Na-K-2Cl cotransporter (NKCC2), major transport/channel proteins responsible for the production of concentrated urine, were found to be significantly increased in type 1 diabetic rats [2].
Diabetes is associated with increased activity of the renal renin-angiotensin-aldosterone system (RAAS). Activated RAAS is known to increase sodium reabsorption. Furthermore the increase in the levels of individual components of RAAS, such as angiotensin II and aldosterone, increase the protein expression of epithelial sodium transporters of the distal tubule in cell culture studies and also in non-diabetic animal models [3–6].
Diabetic patients are commonly treated with angiotensin II type 1 receptor (AT1R) blockers to lower their blood pressure. Thus, the interaction between the diabetic state and AT1R activity as a determinant of renal epithelial sodium reabsorption is an increasingly relevant and timely area of study. Using candesartan, an AT1R blocker, we have recently demonstrated that elevated ENaC activity in type II diabetic obese Zucker rats is due to upregulated angiotensin type 1 receptor (AT1R) activity [7].
With regard to type I diabetic rats, we have recently shown that candesartan significantly increases levels of outer medullary proteins responsible for the production of concentrated urine in STZ-diabetic rats including AQP2 and NKCC2 [8]. However, a comprehensive regional analysis of epithelial sodium channel subunits and the effect of AT1R blockade in these type I diabetic rats has not been reported. Therefore the present study was designed to determine the regional (cortical versus medullary) regulation of epithelial sodium transporters of distal tubule such as ENaC and Na-K-ATPase by type 1 diabetes and the role of activated RAAS on the regional regulation of these proteins. For this, the protein abundances of ENaC subunits (-α, -β and -γ) and α1 subunit of Na-K-ATPase were determined in different regions of the kidneys i.e., cortex, outer medulla, inner-medullary base and inner-medullary tip in STZ-induced diabetic rats treated with or without candesartan. In addition, the protein abundance of NCC was also determined in the cortex of these rats.
METHODS
Animal Model
Twenty-four male Sprague-Dawley rats, weighing 100–150g, were obtained from Charles River Laboratories (Wilmington, MA). All rats received standard rat chow containing 1% NaCl (Purina Mills, St. Louis, MO). Rats were maintained according to a protocol approved by the Emory University Institutional Animal Care and Use Committee. Twelve of the rats were made diabetic by injecting them with streptozotocin (STZ; 65 mg/kg body weight) into the tail vein and the other 12 rats were injected with vehicle (C). Hyperglycemia in the STZ-induced diabetic group was verified 24 – 48 hours after injection by blood glucose measurement in the tail blood using a Lifescan Ultra II glucometer. After 14 days, half of the rats in each group were treated with candesartan, an angiotensin II type I receptor blocker, (generous gift from Astra-Zeneca) in the drinking water (CAN; 2 mg/kg·bw/day) for 7 days. The other half (n = 6/group) were provided with plain drinking water for 7 days. The dose of CAN was similar to oral doses used by other investigators [9–11].
At the end of the studies, animals were euthanized by rapid decapitation and kidneys were collected. One kidney was dissected into inner medullary base (IM base, white portion near inner stripe of the outer medulla); inner medullary tip (IM tip, papillary tip), inner stripe of the outer medulla (reddish, OM) and cortex (tan, CTX). Each region was processed separately. For sample preparation, the dissected tissue was placed into ice-cold isolation buffer (10 mM triethano-lamine, 250 mM sucrose, pH 7.6, 1 μg/ml leupeptin, and 2 mg/ml phenylmethylsulfonyl fluoride, PMSF), homogenized; then SDS was added to a final concentration of 1%. Samples were sheared using a 25G needle and centrifuged at 12,000 × g for 5 minutes to remove insoluble particulates. Total protein in each sample was measured by a modified Lowry method (Bio-Rad DC protein assay reagent, Bio-Rad, Richmond, CA). Samples were solubilized in Laemmli sample buffer and shipped to Georgetown University for analysis.
Electrophoresis and Blotting of Membranes
Coomassie-stained “loading gels” were done to assess the quality of the protein by sharpness of the bands and to confirm equality of loading, as previously described [12, 13]. For immunoblotting, 20–30 μg protein from each sample were loaded into individual lanes of 10% polyacrylamide gels (precast; Bio-Rad, Hercules, CA). The homogenates from kidney cortex (CTXH), outer medulla (OMH), and/or inner medullary base and tip (IMH) were immunoblotted for the α1-subunit of Na-K-ATPase and the 3 subunits (α, β and γ) of the amiloride-sensitive epithelial sodium channel (ENaC) while only CTXH was blotted for the thiazide-sensitive Na-Cl co-transporter (NCC), according to previously defined protocols using our own rabbit polyclonal antibodies against NCC and ENaC subunits sequences, as previously described [12]. The antibody against the α1-subunit of Na-K-ATPase was commercially obtained from Upstate Biotechnology. Equal amounts of total protein from each region were loaded in each lane from each rat.
Statistical Analysis
Data were analyzed by two-way (body type X treatment) analysis of variance (ANOVA, Sigma Stat, Chicago, IL). Unpaired t-test was also used to determine significant differences (p < 0.05) between pairs of means. P < 0.05 was considered significant for all comparisons.
RESULTS
Data regarding the final body weight, weight gain and plasma glucose levels in these rats have already been published [8]. These STZ rats had significantly higher blood glucose levels, as determined 48 hours after injection of STZ or vehicle. Furthermore, mean final body weight was significantly lower in diabetic rats, relative to the non-diabetic and CAN did not have any significant effect on body weight or blood glucose levels [8].
REGULATION OF DISTAL SODIUM TRANSPORTER/CHANNEL PROTEINS BY DIABETES AND CANDESARTAN
α-ENaC Subunit
Regulation by Diabetes
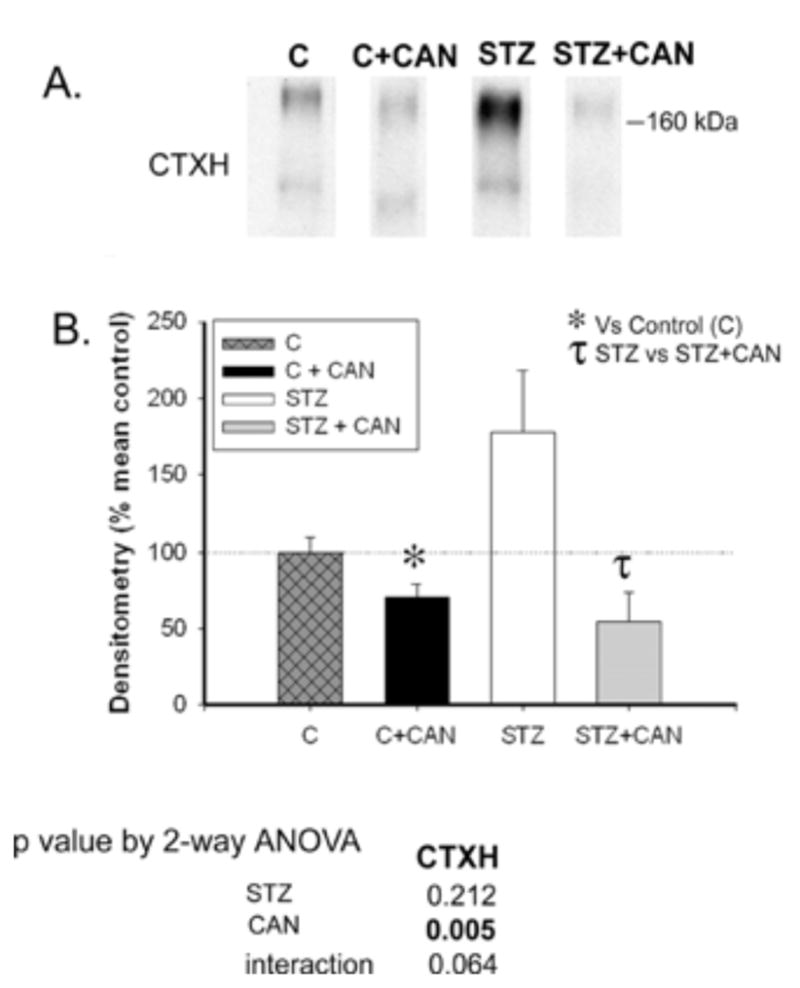
Representative western lanes are shown in panel A, and in panel B is the densitometry summary (Fig. 1). Diabetes did not affect α-ENaC protein abundance in cortex (CTXH). However, diabetic rats had significantly increased α-ENaC protein abundance in the outer medulla (OMH) and inner medullary base [IMH (B)] homogenates. There was also a strong trend for an increase in the tip [IMH (T), p = 0.07]. IMH (T) and IMH (B) were analyzed separately for ENaC and Na-K-ATPase protein, since a variety of proteins have been proven to be differentially regulated in these two portions of the CD [14–16].
Fig. 1.

Effect of diabetes and candesartan on α-ENaC protein abundance in different kidney regions. A) Representative lanes from immunoblots for the α-ENaC subunit in the cortex homogenate (CTXH), inner stripe of outer medulla homogenate (OMH), inner-medullary base homogenate (IMH (B)) and inner medullary tip homogenate (IMH (T)) from non-diabetic (C) and diabetic (STZ) rats treated with or without candesartan (CAN). B) Densitometric summary of the blots (n = 6/group). For immunoblotting, each lane was loaded with an equal amount of total protein from a different rat sample (confirmed a priori by equal Coomassie-staining of representative protein bands). *indicates mean is significantly different (p<0.05) from that of the untreated non-diabetic (C) by unpaired t-test. Results from two-way ANOVA (STZ X CAN) are given below the graph. Significant (p<0.05) factors are in BOLD.
Regulation by Candesartan
Similarly, in CTXH, candesartan did not significantly affect the protein levels of α-ENaC (Fig. 1). However, can-desartan increased the abundance of α-ENaC in the medulla [significant for OMH and IMH (B)], but only in the non-diabetic rats.
β-ENaC and γ-(85)-ENaC, i.e., 85-kDa band of γ-ENaC
Regulation by Diabetes
Similar to α-ENaC, diabetes did not affect protein abundances of the β and γ-ENaC in CTXH (Figs. 2 and 3, respectively). However, protein levels of both of these subunits were significantly increased in all three regions of medulla [OMH, IMH (B) and IMH (T)] in diabetic rats relative to non-diabetic controls (Figs. 2 and 3).
Fig. 2.

Effect of diabetes and candesartan on β-ENaC protein abundance in different kidney regions. A) Representative lanes from immunoblots for the β-ENaC subunit in the cortex homogenate (CTXH), inner stripe of outer medulla homogenate (OMH), inner medullary base homogenate (IMH (B)) and inner medullary tip homogenate (IMH (T)) from non-diabetic (C) and diabetic (STZ) rats treated with or without candesartan (CAN). B) Densitometric summary of the blots (n = 6/group). For immunoblotting, each lane was loaded with an equal amount of total protein from a different rat sample (confirmed a priori by equal Coomassie-staining of representative protein bands). *indicates mean is significantly different (p<0.05) from that of the untreated non-diabetic (C) and τ from untreated diabetic rats (STZ) by unpaired t-test. Results from two-way ANOVA (STZ X CAN) are given below the graph. Significant (p<0.05) factors are in BOLD.
Fig. 3.

Effect of diabetes and candesartan on 85kDa band of γ-ENaC protein abundance in different kidney regions. A) Representative lanes from immunoblots for the γ-ENaC subunit in the cortex homogenate (CTXH), inner stripe of outer medulla homogenate (OMH), inner-medullary base homogenate (IMH (B)) and inner medullary tip homogenate (IMH (T)) from non-diabetic (C) and diabetic (STZ) rats treated with or without candesartan (CAN). B) Densitometric summary of the blots (n = 6/group). For immunoblotting, each lane was loaded with an equal amount of total protein from a different rat sample (confirmed a priori by equal Coomassie-staining of representative protein bands). *indicates mean is significantly different (p<0.05) from that of the untreated non-diabetic (C) and τ from untreated diabetic rats (STZ) by unpaired t-test. Results from two-way ANOVA (STZ X CAN) are given below the graph. Significant (p<0.05) factors are in BOLD.
Regulation by Candesartan
In the CTXH, both β- and γ-ENaC were decreased by candesartan in diabetic, as well as non-diabetic rats (Figs. 2 and 3). In addition, candesartan significantly increased β- and γ-ENaC in the IMH (B), in non-diabetic rats, however their abundances in the OMH and IMH (T), remained statistically unchanged.
NCC
Regulation by Diabetes
Immunoblotting revealed a substantial increase in cortical NCC in non-candesartan-treated diabetic rats (178% of non-diabetic controls); however due to high variability, this difference did not reach statistical significance, relative to controls (p = 0.06, Fig. 4).
Fig. 4.
Effect of diabetes and candesartan on NCC protein abundance in different kidney regions. A) Lane from representative immunoblots for the NCC in the cortex homogenate (CTXH), inner stripe of outer medulla homogenate (OMH), inner medullary base homogenate (IMH (B)) and inner-medullary tip homogenate (IMH (T)) from non-diabetic (C) and diabetic (STZ) rats treated with or without candesartan (CAN). B) Densitometric summary of the blots (n = 6/group). For immunoblotting, each lane was loaded with an equal amount of total protein from a different rat sample (confirmed a priori by equal Coomassie-staining of representative protein bands). * indicates mean is significantly different (p<0.05) from that of the untreated non-diabetic (C) and τ from untreated diabetic rats (STZ) by unpaired t-test. Results from two-way ANOVA (STZ X CAN) are given below the graph. Significant (p<0.05) factors are in BOLD.
Regulation by Candesartan
The abundance of NCC was significantly decreased by candesartan in both diabetic and non-diabetic rats (Fig. 4).
Na-K-ATPase
Regulation by Diabetes
Diabetic rats showed significantly higher protein abundance of the α1 subunit of Na-K-ATPase, a basolateral membrane protein, in the OMH and IMH (B), while no significant change was observed in the CTXH or in the IMH (T) (Fig. 5).
Fig. 5.

Effect of diabetes and candesartan on protein abundance for α1 subunit of Na-K-ATPase in different kidney regions. A) Representative lanes from immunoblots for the Na-K-ATPase in the cortex homogenate (CTXH), inner stripe of outer medulla homogenate (OMH), inner-medullary base homogenate (IMH (B)) and inner medullary tip homogenate (IMH (T)) from non-diabetic (C) and diabetic (STZ) rats treated with or without candesartan (CAN). B) Densitometric summary of the blots (n = 6/group). For immunoblotting, each lane was loaded with an equal amount of total protein from a different rat sample (confirmed a priori by equal Coomassie-staining of representative protein bands). * indicates a mean is significantly different (p<0.05) from that of the untreated non-diabetic (C) and τ from untreated diabetic rats (STZ) by unpaired t-test. Results from two-way ANOVA (STZ X CAN) are given below the graph. Significant (p<0.05) factors are in BOLD.
Regulation by Candesartan
Treatment with candesartan significantly decreased the protein abundance of α1 subunit of Na-K-ATPase in the CTXH of diabetic rats. Similarly, for non-diabetic rats it trended in same direction (p=0.07). Candesartan led to a significant increase in OMH α1 Na-K-ATPase with a trend for an increase in the IMH (B), p = 0.015, in non-diabetic rats (Fig. 5).
DISCUSSION
In this study, we evaluated the regulation of major renal epithelial sodium transport-related proteins including ENaC subunits, NCC, and Na-K-ATPase in the type I diabetic rat. We further determined whether blockade of the AT1R with candesartan would abolish changes that resulted from STZ-induced diabetes. We demonstrated that there are striking differences in the regulation of ENaC subunit protein abundances in cortex versus medullary regions. Diabetes increased ENaC subunit expression in the medulla, but not in the cortex. Candesartan did not reduce this medullary upregulation; and in contrast it resulted in an increase in β- and γ-ENaC in the non-diabetic control rats. The thiazide-sensitive Na-Cl cotransporter, NCC, expressed in the cortex, was not statistically increased by diabetes likely due to high variability; however the mean was increased by 78%. Candesartan decreased NCC in both diabetic and non-diabetic rats. Finally, the α1 subunit of Na-K-ATPase was increased by diabetes most strongly in regions expressing thick ascending limb i.e., OMH or the early portion of the IMCD (base). These regions would be expected to have high energy demands and might be expected to be the most severely affected by diabetes-induced oxidative stress [17, 18]. Candesartan did not reverse this upregulation.
ENaC
The increase in ENaC subunits in diabetic rats is in agreement with results in whole kidney homogenate from our previous studies in type I and type II diabetes [1, 7]. In the present study, in addition to cortex and outer medulla, a comprehensive study of the regulation of ENaC was also done in the inner medullary tip (predominantly terminal IMCDs) and base (predominantly initial IMCDs), which was not examined previously. We found that all three subunits of ENaC were significantly increased by diabetes in both base and tip of the inner medulla but that candesartan regulated these subunits differentially in these two segments.
Our finding of differential regional regulation of sodium transporters by type I diabetes is in agreement with our previous finding from a long term study (12 week) of ovariec-tomized rats (supplemented with estrogen) with STZ-induced diabetes [19]. Regulation of β- and γ-ENaC found in that study was similar to the results demonstrated here (however, inner medulla was not subdivided into base and tip in the previous study). In contrast to our present finding, α– ENaC was found to be decreased in cortex and was not affected in the medulla in our previous long term study [19]. Furthermore, a recent study of long term (8 weeks) diabetic rats by Vidotti et al. [20], also showed reduced expression of α-ENaC relative to non-diabetic control rats. The reason for this disparity is not clear; however, the changes in protein abundances found after long term diabetes [20, 28], could be a compensatory response rather than an effect of diabetes found early on in diabetes. Reduced α-ENaC protein levels found in these earlier studies [19, 20] could also be due to the nephropathy or renal hypertrophy associated with long term diabetes [21].
We found that candesartan treatment did not attenuate the elevated levels ENaC subunits in the medulla of diabetic rats. Thus upregulated AT1R does not appear to have a role in the increased ENaC abundance that is observed in diabetes. We speculate that increased ENaC subunit protein levels in diabetes could be due to increased presence of vasopressin (AVP), since diabetes is associated with elevated AVP levels [22, 23]. In this regard, AVP has been shown to increase ENaC subunits protein abundances [24]. However, why diabetes increased ENaC subunits only in medulla and not in cortex is not clear. We speculate that the lower number of vasopressin receptors present in the cortex versus medulla could be one of the reasons [25, 26].
Like diabetes, candesartan also appeared to have a differential effect in medulla vs cortex of both diabetic and non diabetic rats. Candesartan did not affect ENaC subunits in the medulla whereas in cortex, candesartan reduced the abundance of ENaC subunits in both diabetic as well as non-diabetic rats. One plausible explanation for the blunted or absent effects of candesartan on medullary ENaC subunits in diabetic rats could be a compensatory response, as these proteins may be required to reduce the loss of electrolytes in the diabetic condition. Moreover, the levels of ENaC subunits were markedly higher in the medulla of diabetic rats to begin with. The downregulatory effect of candesartan observed in cortex is in agreement with our recent study in lean Zucker rats, where we demonstrated that candesartan was able to significantly reduce whole kidney abundances of β and γ-ENaC in non-diabetic lean rats [7]. In this regard, angio-tensin II has been shown to directly increase the activity as well as abundance of ENaC subunits [3, 4]. However, Beutler et al. [3] found that in response to candesartan infusion, the expression levels of β and γ-ENaC were significantly increased in the cortex region of the rats with NaCl restriction [3]. One possible explanation for this discrepancy could be the use of NaCl restricted rats, a model of high plasma renin activity, in their study. In addition, these rats were exposed to candesartan for a relatively shorter time compared to our study, i.e., two days versus 7 days.
In non-diabetic rats, candesartan increased ENaC protein levels in the medulla (unlike cortex). A comprehensive analysis of medullary regions revealed that this regulation was mostly in outer medulla and initial IMCDs (inner medullary base). However no such change was observed in terminal IMCDs (inner medullary tip). We speculate that this could be a compensatory effect rather than a direct regulation by candesartan. It may be possible that a candesartan-induced reduction of ENaC in the cortex could increase the sodium load to the medulla, thereby prompting an increased ENaC abundance in the medullary regions, at least in vehicle-treated non-diabetic rats. However, medullas of the diabetic rats had higher abundance of these proteins to begin with thus limiting the additional candesartan effect and resembling a blunted effect of candesartan. In addition, in early diabetes (19–20 days from the onset of DM) AT1R mRNA has been shown to be increased only in cortex, which could also be the cause for a blunted candesartan effect in the medulla of diabetic rats [27]. Candesartan did not affect blood pressure in these rats as observed by tail cuff method [8] thus change in blood pressure can be ruled out as a factor for this regulation.
NCC
In our previous study we showed that induction of type I diabetes significantly increases the abundance of whole kidney NCC [1]. This was confirmed in the present study that further examined the effects of candesartan and showed that candesartan reversed the elevation of NCC suggesting a role for upregulated AT1R in the elevation of NCC in type 1 diabetes. In addition, the significant decrease in NCC levels in AT1R knockout mice demonstrated by Brooks et al. [28] further suggests a direct role of angiotensin II in the upregulation of NCC. Although our recent study in non-diabetic lean Zucker rats also demonstrated that candesartan was able to significantly reduce NCC [7], long term STZ-induced diabetes did not seem to affect NCC abundance [20]. The reasons for this disparity could be similar to what has been discussed above for ENaC protein.
Na-K-ATPase
In diabetic rats, the α1 subunit of Na-K-ATPase was increased in the medullary region (OM and IM) while no significant change was found in the cortex. Khadauri et al. [29] has shown that STZ-induced diabetes increased the activity of Na-K-ATPase activity in the proximal convoluted tubule and medullary thick ascending limb, and cortical and outer medullary collecting tubule, but not in the proximal straight tubule, cortical thick ascending limb or distal convoluted tubule. Moreover, medullary regions would be expected to have high energy demands and are the most severely affected by diabetes-induced oxidative stress [17]. Similar to ENaC protein, we have demonstrated that candesartan differentially regulate Na-K-ATPase protein also in cortex vs medulla in these rats.
We have recently published that the STZ-diabetic rats have elevated levels of urea transporters (UT-A1, UT-A3), AQP2, and NKCC2/BSC1 proteins, which were further increased (UT-A3 and NKCC2/BSC1) or remained unaltered (UT-A1 and AQP2) by candesartan treatment [8]. Thus we suggest that early type I diabetes is associated with a compensatory elevation in the levels of medullary proteins to avoid urinary loss of sodium and water.
In summary, we found that medullary ENaC and Na-K-ATPase proteins were significantly increased in type I diabetes, which is not due to upregulated AT1R activity. We suggest that elevated AVP associated with diabetes may contribute to this upregulation. Unlike ENaC and Na-K-ATPase, increased NCC in type 1 diabetic rats appears to be associated with upregulated AT1R activity. We suggest that the regulation of ENaC and Na-K-ATPase proteins may be a compensatory effect rather than a direct effect of candesartan, at least in the medulla. Thus, while candesartan reduces ENaC and Na-K-ATPase proteins in the cortex, the medulla escapes these effects in the diabetic state, perhaps to avoid excessive sodium loss.
Acknowledgments
Funding for these studies was obtained from a National Kidney Foundation Grant and Haddad Research fund to ST, and NIH grants R01 HL073193 to CE, and R01 DK062081 to JK.
Footnotes
Publisher's Disclaimer: This is an open access article licensed under the terms of the Creative Commons Attribution Non-Commercial License (http://creativecommons.org/licenses/by-nc/3.0/) which permits unrestricted, non-commercial use, distribution and reproduction in any medium, provided the work is properly cited.
References
- 1.Song J, Knepper MA, Verbalis JG, Ecelbarger CA. Increased renal ENaC subunit and sodium transporter abundances in streptozotocin-induced type 1 diabetes. Am J Physiol Renal Physiol. 2003;285(6):F1125–37. doi: 10.1152/ajprenal.00143.2003. [DOI] [PubMed] [Google Scholar]
- 2.Kim D, Sands JM, Klein JD. Changes in renal medullary transport proteins during uncontrolled diabetes mellitus in rats. Am J Physiol Renal Physiol. 2003;285(2):F303–F309. doi: 10.1152/ajprenal.00438.2002. [DOI] [PubMed] [Google Scholar]
- 3.Beutler KT, Masilamani S, Turban S, et al. Long-term regulation of ENaC expression in kidney by angiotensin II. Hypertension. 2003;41(5):1143–50. doi: 10.1161/01.HYP.0000066129.12106.E2. [DOI] [PubMed] [Google Scholar]
- 4.Peti-Peterdi J, Warnock DG, Bell PD. Angiotensin II directly stimulates ENaC activity in the cortical collecting duct via AT(1) receptors. J Am Soc Nephrol. 2002;13(5):1131–5. doi: 10.1097/01.asn.0000013292.78621.fd. [DOI] [PubMed] [Google Scholar]
- 5.Alvarez de la Rosa D, Li H, Canessa CM. Effects of aldosterone on biosynthesis, traffic, and functional expression of epithelial sodium channels in A6 cells. J Gen Physiol. 2002;119(5):427–42. doi: 10.1085/jgp.20028559. [DOI] [PMC free article] [PubMed] [Google Scholar]
- 6.Blazer-Yost BL, Liu X, Helman SI. Hormonal regulation of EN-aCs: insulin and aldosterone. Am J Physiol. 1998;274(5 Pt 1):C1373–9. doi: 10.1152/ajpcell.1998.274.5.C1373. [DOI] [PubMed] [Google Scholar]
- 7.Madala Halagappa VK, Tiwari S, Riazi S, Hu X, Ecelbarger CM. Chronic candesartan alters expression and activity of NKCC2, NCC, and ENaC in the obese Zucker rat. Am J Physiol Renal Physiol. 2008;294(5):F1222–31. doi: 10.1152/ajprenal.00604.2007. [DOI] [PubMed] [Google Scholar]
- 8.Blount MA, Sands JM, Kent KJ, Smith TD, Price SR, Klein JD. Candesartan augments compensatory changes in medullary transport proteins in the diabetic rat kidney. Am J Physiol Renal Physiol. 2008;294(6):F1448–52. doi: 10.1152/ajprenal.00600.2007. [DOI] [PMC free article] [PubMed] [Google Scholar]
- 9.Topcu SO, Pedersen M, Norregaard R, et al. Candesartan prevents long-term impairment of renal function in response to neonatal partial unilateral ureteral obstruction. Am J Physiol Renal Physiol. 2007;292(2):F736–48. doi: 10.1152/ajprenal.00241.2006. [DOI] [PubMed] [Google Scholar]
- 10.Noda M, Matsuo T, Nagano-Tsuge H, et al. Involvement of angiotensin II in progression of renal injury in rats with genetic non-insulin-dependent diabetes mellitus (Wistar fatty rats) Jpn J Pharmacol. 2001;85(4):416–22. doi: 10.1254/jjp.85.416. [DOI] [PubMed] [Google Scholar]
- 11.Sugimoto K, Tsuruoka S, Matsushita K, Fujimura A. Effects of candesartan cilexetil on oxidative state and renal function in 5/6 nephrectomized rats. J Hum Hypertens. 1999;13(Suppl 1):S63–70. doi: 10.1038/sj.jhh.1000743. discussion S81. [DOI] [PubMed] [Google Scholar]
- 12.Tiwari S, Packer RK, Hu X, Sugimura Y, Verbalis JG, Ecelbarger CA. Increased renal alpha-ENaC and NCC abundance and elevated blood pressure are independent of hyperaldosteronism in vasopressin escape. Am J Physiol Renal Physiol. 2006;291(1):F49–57. doi: 10.1152/ajprenal.00390.2005. [DOI] [PubMed] [Google Scholar]
- 13.Tiwari S, Nordquist L, Halagappa VK, Ecelbarger CA. Trafficking of ENaC subunits in response to acute insulin in mouse kidney. Am J Physiol Renal Physiol. 2007;293(1):F178–85. doi: 10.1152/ajprenal.00447.2006. [DOI] [PubMed] [Google Scholar]
- 14.Nielsen J, Kwon TH, Praetorius J, et al. Segment-specific ENaC downregulation in kidney of rats with lithium-induced NDI. Am J Physiol Renal Physiol. 2003;285(6):F1198–209. doi: 10.1152/ajprenal.00118.2003. [DOI] [PubMed] [Google Scholar]
- 15.Pawelczyk T, Grden M, Rzepko R, Sakowicz M, Szutowicz A. Region-specific alterations of adenosine receptors expression level in kidney of diabetic rat. Am J Pathol. 2005;167(2):315–25. doi: 10.1016/S0002-9440(10)62977-X. [DOI] [PMC free article] [PubMed] [Google Scholar]
- 16.Uehara T, Miyoshi T, Tsuchiya N, et al. Comparative analysis of gene expression between renal cortex and papilla in nedaplatin-induced nephrotoxicity in rats. Hum Exp Toxicol. 2007;26(10):767–80. doi: 10.1177/0960327107084069. [DOI] [PubMed] [Google Scholar]
- 17.Palm F, Cederberg J, Hansell P, Liss P, Carlsson PO. Reactive oxygen species cause diabetes-induced decrease in renal oxygen tension. Diabetologia. 2003;46(8):1153–60. doi: 10.1007/s00125-003-1155-z. [DOI] [PubMed] [Google Scholar]
- 18.Palm F, Friederich M, Carlsson PO, Hansell P, Teerlink T, Liss P. Reduced nitric oxide in diabetic kidneys due to increased hepatic arginine metabolism: implications for renomedullary oxygen availability. Am J Physiol Renal Physiol. 2008;294(1):F30–7. doi: 10.1152/ajprenal.00166.2007. [DOI] [PubMed] [Google Scholar]
- 19.Riazi S, Maric C, Ecelbarger CA. 17-β estradiol attenuates streptozotocin-induced diabetes and regulates the expression of renal sodium transporters. Kidney Int. 2006;69(3):471–80. doi: 10.1038/sj.ki.5000140. [DOI] [PubMed] [Google Scholar]
- 20.Vidotti DB, Arnoni CP, Maquigussa E, Boim MA. Effect of long-term type 1 diabetes on renal sodium and water transporters in rats. Am J Nephrol. 2008;28(1):107–14. doi: 10.1159/000109967. [DOI] [PubMed] [Google Scholar]
- 21.Ziyadeh FN, Hoffman BB, Han DC, et al. Long-term prevention of renal insufficiency, excess matrix gene expression, and glomerular mesangial matrix expansion by treatment with monoclonal anti-transforming growth factor-beta antibody in db/db diabetic mice. Proc Natl Acad Sci USA. 2000;97(14):8015–20. doi: 10.1073/pnas.120055097. [DOI] [PMC free article] [PubMed] [Google Scholar]
- 22.Ahloulay M, Schmitt F, Dechaux M, Bankir L. Vasopressin and urinary concentrating activity in diabetes mellitus. Diabetes Metab. 1999;25(3):213–22. [PubMed] [Google Scholar]
- 23.Iwasaki Y, Kondo K, Murase T, Hasegawa H, Oiso Y. Osmoregulation of plasma vasopressin in diabetes mellitus with sustained hyperglycemia. J Neuroendocrinol. 1996;8(10):755–60. doi: 10.1046/j.1365-2826.1996.05124.x. [DOI] [PubMed] [Google Scholar]
- 24.Ecelbarger CA, Kim GH, Terris J, et al. Vasopressin-mediated regulation of epithelial sodium channel abundance in rat kidney. Am J Physiol Renal Physiol. 2000;279(1):F46–53. doi: 10.1152/ajprenal.2000.279.1.F46. [DOI] [PubMed] [Google Scholar]
- 25.Trinder D, Stephenson JM, Gao X, Phillips PA, Risvanis J, Johnston CI. [3H]desGly-NH2(9)-d(CH2)5 [D-Ileu2, Ileu4]AVP: an AVP V2 receptor antagonist radioligand. Peptides. 1991;12(6):1195–200. doi: 10.1016/0196-9781(91)90194-t. [DOI] [PubMed] [Google Scholar]
- 26.Phillips PA, Abrahams JM, Kelly JM, Mooser V, Trinder D, Johnston CI. Localization of vasopressin binding sites in rat tissues using specific V1 and V2 selective ligands. Endocrinology. 1990;126(3):1478–84. doi: 10.1210/endo-126-3-1478. [DOI] [PubMed] [Google Scholar]
- 27.Harrison-Bernard LM, Imig JD, Carmines PK. Renal AT1 receptor protein expression during the early stage of diabetes mellitus. Int J Exp Diabetes Res. 2002;3(2):97–108. doi: 10.1080/15604280214483. [DOI] [PMC free article] [PubMed] [Google Scholar]
- 28.Brooks HL, Allred AJ, Beutler KT, Coffman TM, Knepper MA. Targeted proteomic profiling of renal Na(+) transporter and channel abundances in angiotensin II type 1a receptor knockout mice. Hypertension. 2002;39(2 Pt 2):470–3. doi: 10.1161/hy02t2.102959. [DOI] [PubMed] [Google Scholar]
- 29.Khadouri C, Barlet-Bas C, Doucet A. Mechanism of increased tubular Na-K-ATPase during streptozotocin-induced diabetes. Pflugers Arch. 1987;409(3):296–301. doi: 10.1007/BF00583479. [DOI] [PubMed] [Google Scholar]