

Abstract
In a well-regulated control system, excitatory and inhibitory components work closely together with minimum lag; in response to inputs of finite duration, outputs should show rapid rise and, following the input's termination, immediate return to baseline. The efficiency of this response can be quantified using the power spectrum density's scaling parameter β, a measure of self-similarity, applied to the first-derivative of the raw signal. In this study, we adapted power spectrum density methods, previously used to quantify autonomic dysregulation (heart rate variability), to neural time-series obtained via functional MRI. The negative feedback loop we investigated was the limbic system, using affect-valent faces as stimuli. We hypothesized that trait anxiety would be related to efficiency of regulation of limbic responses, as quantified by power law scaling of fMRI time series. Our results supported this hypothesis, showing moderate to strong correlations of β (r = 0.4–0.54) for the amygdala, orbitofrontal cortex, hippocampus, superior temporal gyrus, posterior insula, and anterior cingulate. Strong anticorrelations were also found between the amygdala's β and wake heart rate variability (r = −0.61), suggesting a robust relationship between dysregulated limbic outputs and their autonomic consequences.
Keywords: fMRI, entropy, control systems, limbic, anxiety, amygdala, dorsolateral prefrontal cortex, heart-rate variability analysis
Introduction
Negative feedback loops that maintain homeostatic control are ubiquitous within the body (Khoo, 2000); the same mechanism, involving imbalance or “dysregulation” between excitatory and inhibitory components, can produce very different diseases depending upon the particular system affected. Dysregulatory diseases range from diabetes (Muscogiuri et al., 2008), Cushing's disease (Miller and O'Callaghan, 2002), hypertension (Grassi, 2009), cancer (Bosl and Li, 2005; Engelmann and Bauer, 2000; Ichimura et al., 2000), as well as autoimmune diseases such as asthma (Braman, 1995) and rheumatoid arthritis (Stenberg et al., 1992). As such, one diagnostic technique that has shown success in assessing risk for dysregulatory diseases is to provide a system perturbation (bolus) and then observe as a single instance the dynamics of the excitatory and inhibitory responses in modulating return to baseline; well-known examples include the glucose tolerance test for diabetes (Norris et al., 2008) and the dexamethasone suppression test for Cushing's disease (Elamin et al., 2008). Where strong perturbations are not feasible, one can maintain signal detection power by using a larger number of milder perturbations as inputs. For example, the nonlinear complexity with Shannon entropy method of heart rate variability analysis (Kurths et al., 1995; Voss et al., 1995) measures responses to endogenously and exogenously-produced perturbations for up to 24-hours at a time. These are assumed to be chaotic; therefore, the degree to which resulting cardiac outputs are also chaotic is an indicator of a well-regulated system, with increased chaos associated with improved cardiovascular health.
In a well-regulated control system, the excitatory and inhibitory components work closely together with minimum lag: in response to an input of finite duration, outputs should show rapid rise and, following the input's termination, efficient return to baseline (i.e., minimum latency and extinction times). As neuroimaging develops increasingly sophisticated methods of characterizing connectivity between neural regions associated with control circuits, this raises the exciting possibility of using neural time-series to quantify dysregulation within those circuits. Doing so would provide sensitive neurobiological markers for the dynamics associated with risk for neurological and psychiatric illnesses that are dysregulatory in nature.
This manuscript builds directly upon our previous research which, having modeled the limbic system as a control circuit based upon animal and human research (Baxter et al., 2000; Blair et al., 2005; Davis and Whalen, 2001; Izquierdo and Murray, 2005; Izquierdo et al., 2005; LeDoux, 2000; Maren, 2005; Morgane and Mokler, 2006; Phan et al., 2002; Phelps et al., 2004; Rosenkranz et al., 2003; Sotres-Bayon et al., 2004; Sotres-Bayon et al., 2006), found that dysregulation of the excitatory (amygdala) and inhibitory (Brodmann Area 45) components positively correlated with trait anxiety in healthy adults (Mujica-Parodi et al., 2009). Moreover, limbic dysregulation was positively correlated with autonomic dysregulation, suggesting a mechanism by which patients with mental illnesses such as paranoid schizophrenia show lowered heart rate variability (Mujica-Parodi et al., 2005), since outputs from the limbic system, via the lateral hypothalamus, project to the lateral medulla and provide inputs for the autonomous nervous system's control circuit. Upon this model, we hypothesized that the observed autonomic dysregulation seen in patients does not result from autonomic abnormalities, but rather from the autonomic nervous system's dysregulated limbic outputs (Radulescu and Mujica-Parodi, 2009; Radulescu and Mujica-Parodi, 2008).
The method we used previously to characterize dysregulation was to measure cross-correlations (“coupling”) between time-series for nodes within the circuit. While the method showed a relationship to trait anxiety in healthy individuals, it had several important limitations as diagnostic or risk-assessment technique for patients. First, although analyses of the dynamics showed that the most dominant control was exerted by BA45 upon the amygdala, the cross-correlation method showed that trait anxiety was associated with uncoupling between different node-pairs within the circuit. To maximize clinical utility, it would be preferable that systemic uncoupling be characterized by a single output, as per the nonlinear complexity method of heart rate variability analysis. Second, the method made certain assumptions about the dynamics that seem to be violated by the more severe dysregulation seen in patients (Radulescu and Mujica-Parodi, 2008). While the most straightforward method of accomplishing both of these aims would be to measure Shannon entropy of the system, we found that entropy measures are unstable for the limited temporal resolution obtained by fMRI time-series. Therefore, the approach we took was to measure variability directly by looking at frequency analyses (i.e., power spectrum density) of the time-series.
Power spectrum scale invariance (PSSI) has been conventionally used as an efficient tool for analyzing irregular time series (Shelhamer, 2007) by measuring the relative frequency content of a signal. In our study of temporal variability of human brain activity we utilize the fact that the time series of functional magnetic resonance imaging (fMRI) data show power-law scaling behavior (Thurner et al., 2003; Zarahn et al., 1997). Scaling or scale-invariance means that there is no preferred temporal scale, and that the power spectrum density of the signal follows the power law:
where β is the scaling exponent. This form of the PSSI, peculiar to fractional Brownian motion (Beran, 1994; Hurst, 1951; Mandelbrot, 1982; Mandelbrot and van Ness, 1968), is related to statistical self-similarity or fractal property of the signal.
Temporal scaling laws in biological time series are usually explained by the existence of the underlying complex control system involving various feedback mechanisms (Bak et al., 1987, 1988; Tang and Bak, 1988). The absence of characteristic time scales gives to the system important biological advantages, such as adaptability of response to a constantly changing environment (Goldberger et al., 1990). Scaling behavior in human brain oscillations using electroencephalogram (EEG) time series (Linkenkaer-Hansen et al., 2001) suggests that power-law scaling behavior of spontaneous oscillations can be explained within the theory of self-organized criticality, in which a system contains a critical point as an attractor. Conceptualized in these terms, a well-regulated control system is “self-organizing” in a sense that it arranges itself naturally without any external mechanism. The criticality of the system is in its balancing between structural stability in response to perturbations and the ability to react to perturbations without the need to tune the control parameters.
The scaling parameter β (Shelhamer, 2007 and references therein) serves as a measure of the auto-correlations within the signal. Estimating the β exponent for a time series provides a measure of whether the data are a pure random walk or have underlying trends. A flat spectrum (β = 0) corresponds to the uncorrelated time series; i.e., white noise. Increasing (negative) values of the scaling exponent indicate the persistence in the time series (i.e., the system's “memory”) over many different time scales. However, for reasons explained below, many of the physiological applications of the scaling parameter calculate β not from the raw signal, but from its first derivative. The derivative shifts β by a constant, making negative values of β across the brain positive without changing between-voxel relationships.
Our approach is similar to that used in heart rate variability analysis. The scale-invariant properties of heartbeat sequences have been studied by various groups and methods (Ivanov et al., 1999; Ivanov et al., 2001; Peng et al., 1993; Thurner et al., 1998). It has been found that the scaling laws strongly depend upon the state of the underlying physiologic control system, and are consistent with a nonlinear feedback system that shifts the signal away from the extremes (Ivanov et al., 2001). The PSSI analysis of the time series defines the complexity of heart-beat dynamics through its scale-free behavior, thus identifying a single scaling exponent as an index of healthy or pathological regulation (Peng et al., 1993).
While power spectrum density has long been used for analyzing inter-beat (R-R) intervals for heart rate variability analysis (Akselrod et al., 1981; Pagani et al., 1986; Pomeranz et al., 1985), applying the method to neural time-series required some modifications. Heart rate variability analyses assume chaotic inputs, and therefore by extension that well-regulated (i.e., highly adaptive) systems should also be characterized by high degrees of variability. However, given the inherent design limitations placed upon fMRI time-series, by both TR as well as hemodynamic lag, inputs for most fMRI studies, even those that are event-related, cannot be truly chaotic. For block designs, in which the stimuli are presented at regular intervals of consistent duration, this is even more so the case. Therefore, to be able to adapt the PSSI method to as many different types of fMRI designs as possible, we took the power spectrum not of the raw time-series but of its first-derivative (Shelhamer, 2007). This allowed us to quantify the suppleness of the system in responding quickly to new inputs (both endogenous and exogenous) and also returning to baseline quickly following input termination, without the assumption that inputs must be chaotic. For clarity it is important to note that in contrast to PSSI, what is normally known as “power spectrum density” or “spectral” analysis of heart rate variability measures not the degree to which all frequencies are represented, but specifically upon frequency ranges associated with excitatory (sympathetic) and inhibitory (parasympathetic) components (Task Force of the European Society of Cardiology, 1996). For fMRI this need is somewhat ameliorated, since unlike R-R intervals, fMRI time-series permit gross discrimination of their influences via spatial localization. However, in performing fMRI PSSI analyses it is important to exclude frequencies associated with physiological factors such as respiration and heart rate, as these may provide confounds in interpreting the neural response.
For this study, we “perturbed the system” using visual stimuli (affect-valent faces) known to reliably provoke a limbic response. Since frequency analyses optimally require a larger number of data points than would typically be found for one condition, we included the entire time-series in our analyses rather than specifying condition. We hypothesized that individuals with higher levels of trait anxiety would show less efficient regulation (β > 0) of limbic responses.
Materials and Methods
Participants
We recruited 50 healthy adult subjects into this study (N=22 males, N=28 females; μage=26 yrs; s.d.=7.7; max/min age=18-49). A lengthy phone screening, as well as the Scheduled Clinical Interview for DSM-IV (Ventura et al., 1998), were administered to rule out subjects with current or prior psychiatric illness. All subjects received a history and physical; subjects were excluded if they had a history of drug abuse, traumatic brain injury, cardiovascular illness (including high blood pressure), regular nicotine use, or any MRI exclusion criteria, including metal in the body, claustrophobia, or pregnancy. This study was approved by the Institutional Review Board of Stony Brook University, and all subjects provided informed consent.
Study Design
All subjects were hospitalized for 48 hours at the Stony Brook University Hospital's General Clinical Research Center, to provide maximum control over the testing environment. Subjects were admitted to the hospital at 8pm, provided informed consent, and received a physician-administered history and physical to ensure eligibility in the study. The morning after the first night, subjects were asked to complete the State-Trait Anxiety Inventory (Spielberger, 1983), an instrument that provides a psycho-social assessment of anxiety in healthy adults. Starting at 10:30 am, subjects then received ambulatory cardiac monitoring for the next 24 hours until 10:30am the second day. At this point, subjects received an MRI.
Visual Stimuli
To “perturb” the control circuit, we used gray-scale images of male and female faces depicting angry, fearful, happy and neutral emotions (Ekman, 1993), which are known to reliably activate a limbic response (Phillips et al., 1997; Williams et al., 2004). Each face block consisted of nine different faces of the same emotion type, displayed for 2.2s each for total block duration of 20s. Each fMRI run consisted of eight 20s blocks: angry, neutral, happy, and fearful face blocks, each of which alternated with a 20s “rest” block (fixation cross composed of white cross-hairs presented on a black background). There were two runs. Subjects passively viewed visual stimuli during scanning using an angled mirror mounted on the head coil and a screen placed directly outside the magnet bore. Stimuli were presented using a computer running E-prime software (version 1.0; Psychology Software Tools, Inc.; Pittsburgh, PA) and were projected onto the screen using a projector placed outside the scanner room.
Image Acquisition
Subjects were scanned on a 1.5T Philips Intera MRI scanner at the Stony Brook University Hospital using an 8-channel SENSE parallel head coil. Data were acquired using four blocks (one for each fMRI run) of 136 T2*-weighted echoplanar single-shot images covering the frontal and limbic areas of the brain, with TR=2500ms, SENSE factor=2, TE=45ms, Flip angle=90° Matrix=64×64, 3.9×3.9×4mm3 voxels, and 30 contiguous oblique coronal slices. In addition to the functional scan, we obtained an anatomical scan to match the slice orientation of the functional scan. The acquisition parameters for this sequence were: TR=15ms, TE=450ms, Matrix=256×256, FOV=250 and 30 contiguous oblique coronal slices with 4mm slice thickness and no gap between the slices. The anatomical data were used to generate a customized EPI template to normalize our EPI scans to the standard frame of reference. The subject's head was secured with tape to minimize head movements during the scans.
Image Analyses
The fMRI data analyses were performed using the Statistical Parametric Mapping software (SPM99; http//www.fil.ion.ucl.ac.uk/spm), running under Matlab 6.5 (Mathworks, Natick, Massachusetts). The raw functional BOLD images were first realigned to the first volume to remove movement-related artifacts using a sinc interpolation. The motion correction algorithm in the SPM99 software package is capable of correcting for motion within 3mm. Movement for all 50 of the subjects was found to be within 3mm in each of the functional runs and was fully corrected. Realigned images were then spatially normalized into 3×3×3mm3 using an affine transformation with a set of 7×8×7 basis functions and a customized template that was created using the data for the first 12 subjects; the incomplete brain coverage and oblique nature of our slices required us to use a custom template for normalization. For each subject, the scalp was removed from a low-resolution EPI image, using the Brain Extraction Tool (BET) (Smith, 2002) available in MRIcro software, at a fractional intensity threshold of 0.5. These skull stripped images were then registered and normalized to each other and the average image was smoothed with a Gaussian kernel of 8mm full-width half maximum and registered to the EPI template provided by SPM99 to generate the final template. The realigned and normalized time series were then smoothed with a Gaussian kernel of 8mm full-width half maximum.
Extraction of fMRI Time-series
Based upon prior research (Mujica-Parodi et al., 2009), we identified eight a priori regions of interest: these were the bilateral amygdala, hippocampus, BA45, and BA9. Using the WFU PickAtlas Toolbox, we defined masks for each of these regions. The time series for each region were extracted from voxels corresponding to the coordinates of the nonzero values in the resliced (binary) masks. The time series for the entire brain were generated in a similar fashion by applying a binary mask of the entire brain generated from the abovementioned custom template.
Power Spectrum Scale Invariance Method
The power spectral density of the time series was estimated using Welch's averaged modified periodogram method of spectral estimation (8 segments, with 50% overlap, Hamming window). The scaling parameter β was determined by estimating the slope of the power spectrum of linearly detrended first derivative of the time series on a log-log scale. β was obtained by applying a linear fit to the data in the 0.06-0.2Hz range.
The bandwidth of 0.06-0.2Hz was chosen to be conservative in excluding the influence of both acquisition parameters and task design. The upper limit for the bandwidth was determined by the maximum time resolution for our time-series possible given a TR=2.5s (while we could have increased the time-resolution by reducing the TR to 1s, it would have been at the cost of obtaining insufficient brain coverage to acquire data from all components of the limbic circuit). The choice for the lower limit for the bandwidth used was based on the structure of the task. Since the design utilized 20s blocks, it was important to exclude the basic frequency of the task from the analyzed frequency range (the block was composed of 2.2s presentations, whose frequency therefore also fell outside the upper limit). Frequencies of 0.05Hz (1/20s) and below therefore needed to be excluded, and this cutoff also took care of the higher order harmonics (1/40s, etc.).
Region of Interest Analyses and Exploratory Confirmation of Regions of Interest
For each subject, the trait anxiety score was correlated with scaling parameter β for each voxel in the eight regions of interest. To compensate for the issue of spuriously inflated values due to the multiple comparisons, we required spatial contiguity larger than the smoothing kernel; within each region of interest correlated voxels (p < 0.05) were collected into clusters with connectivity=26 (i.e., each voxel has 26 neighbors: 33-1, in 3D space). This approach, rather than Bonferroni-correcting p-values, was taken to avoid overly conservative correction in potentially large areas of the prefrontal cortex. We additionally performed a whole-brain exploratory analysis, disregarding clusters < 5 voxels. For each cluster of significantly correlated voxels (p < 0.01) the maximally correlated voxel was used to identify the region using Talairach Daemon (Lancaster et al., 2000).
Heart-Rate Variability Analyses
ECG were obtained, processed, and analyzed for 40 subjects according to previously-published methods (Mujica-Parodi et al., 2009). As per our previous work, we used the Principal Dynamic Modes method as it has shown superior accuracy, as compared to the more commonly used Power Spectrum Density method, in separating out the sympathetic and parasympathetic components (Chon et al., 2006; Zhong et al., 2006). The PDM-derived measures of sympathetic and parasympathetic activity were then correlated with the scaling parameter β for each voxel within the eight regions of interest and clustered as described above for trait anxiety.
Results
Trait Anxiety
The trait anxiety scale, like the characteristic it represents, is a continuous measure that, in our sample of N = 50, provided a normal distribution (Shapiro-Wilk: W=0.98, p=0.4; μtrait anxiety score=38; s.d.= 10; max/min score=21-58). Trait anxiety was not correlated with age (r=−0.04, p=0.8), nor was it different for males and females (t=0.5, p=0.6).
Power Spectrum Scale Invariance Method
Power spectrum logarithmic slope β, a measure of frequency spectrum density, was > 0 for all individuals and correlated with trait anxiety (r=0.49, p=0.000, N=50) for the left amygdala (Figure 1; Table 1), right BA45 (r=0.43, p=0.002) and right BA9 (r=0.48, p=0.000). Relationships were not seen for the right amygdala or bilateral hippocampus. Our primary analyses used correlations since they most accurately retain the continuous nature of the trait anxiety variable. However, for purposes of illustration (Figure 2), we separated out subjects into extreme high and low-anxiety groups, defined as individuals with anxiety scores G=1.5 standard deviations above (N=4; μ=56.5, s.d.=1.73) and below (N=3; μ=22.33, s.d =1.15) the mean. Distribution of points in state space with time-delay reconstruction of TR=2.5s, indicates that high anxiety subjects had less temporal variability in response to stimuli (Figure 2a) and that the two groups' temporal variability distributions were statistically significant (Figure 2b; Wilcoxon rank-sum test: Z=7.82, p=0.000).
Figure 1.
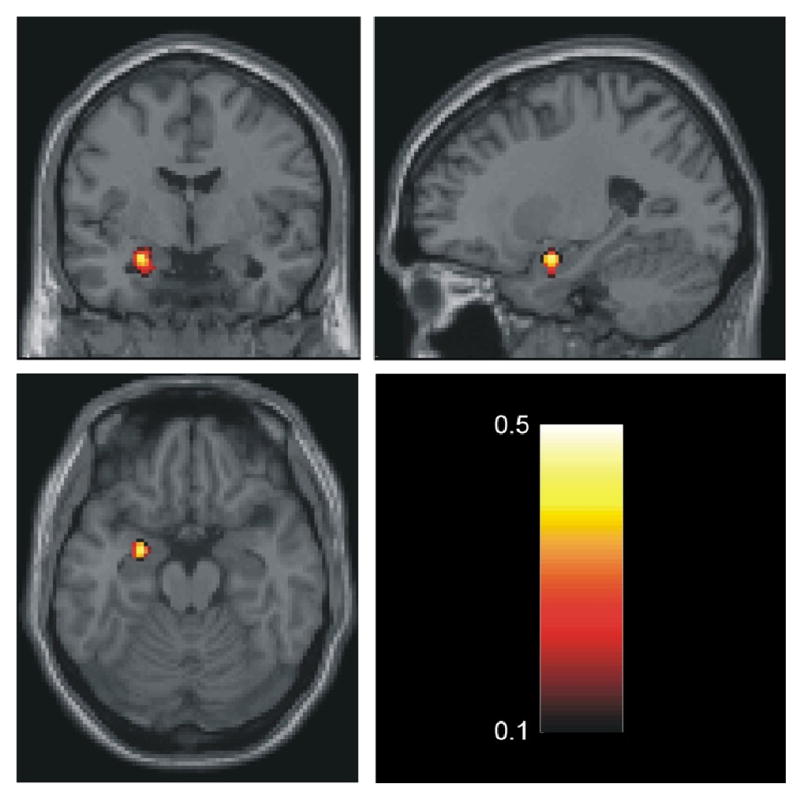
Correlation between the irregularity of the time series quantified by β (calculated from the first derivative of the timeseries) and trait anxiety within the left amygdala. Size of cluster is 25 voxels with a p-threshold < 0.05. For the maximally correlated voxel MNI= [ -24 -3 -18 ] p=0.000, r =0.49. The correlation coefficients are color-coded according to the bar.
Table 1. Targeted Analysis: Correlation Between Scaling Parameter β and Trait Anxiety.
| MNI Coordinates | Maximally Correlated Voxel | ||||||
|---|---|---|---|---|---|---|---|
| Region | Hemisphere | x | y | z | Cluster Size* (Voxels) |
r value | p value |
| Amygdala | L | -24 | -3 | -18 | 25 | 0.49 | 0.000 |
| BA45 | R | 60 | 27 | 24 | 11 | 0.43 | 0.002 |
| BA9 | R | 57 | 3 | 30 | 22 | 0.48 | 0.000 |
| 6 | 51 | 42 | 8 | 0.35 | 0.012 | ||
| 60 | 21 | 30 | 0.41 | 0.003 | |||
Clusters of voxels with p < 0.05; Clusters of size less than 5 voxels discarded.
Figure 2.
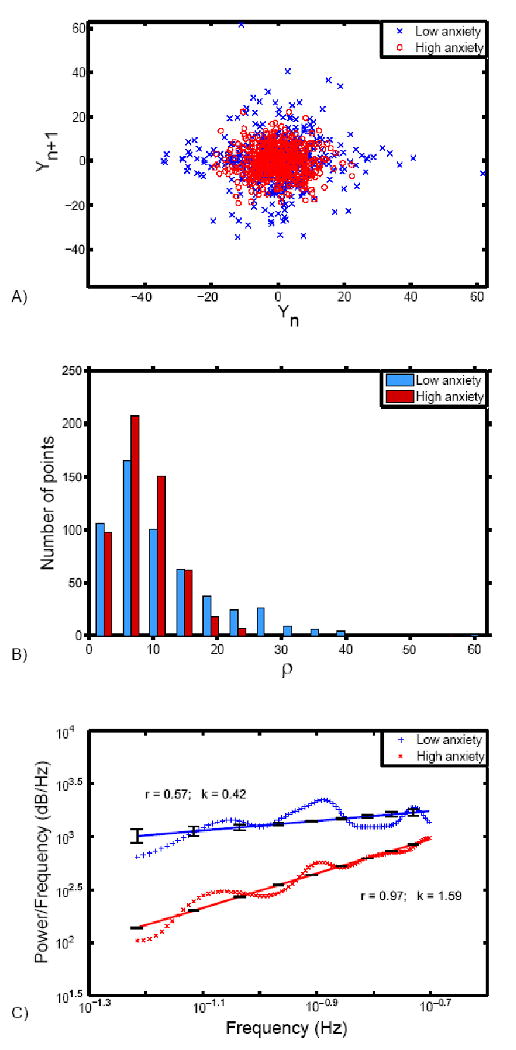
Illustration of difference between high and low trait anxious individuals. (a) Time series from maximally correlated voxel in the left amygdala (MNI: -24, -3, -18) for high and low trait anxiety groups are shown in the state space using time-delay reconstruction with a delay of TR (2.5 seconds). (b) Histogram showing the distribution of points in the state space as a function of the distance defined by . The distributions of points for high and low anxiety subjects are significantly different as determined by Wilcoxon rank-sum test (Z=7.82, p=0.000) (c) Power spectrum density of the first derivative of the time series corresponding to high and low anxiety individuals plotted on the logarithmic scale. Linear fit of slope β with standard error is shown, together with the correlation coefficient r between the linear fit and the averaged power spectrum density. The difference in slopes indicates that the time series from high trait anxiety subjects show less variability than the time series from low trait anxiety subjects.
Exploratory Confirmation of Regions of Interest
We initially performed the analysis using regions that were defined, a priori, as components of the limbic circuit reliably triggered by fMRI studies of emotional stimuli. However, to check whether our results might have been biased by pre-defined regions of interest, we additionally performed an exploratory analysis that investigated which areas showed correlations between β and trait anxiety. As shown by Figure 3 and Table 2, correlated voxels were not randomly dispersed within the brain but tightly defined by a few clusters that, in addition to the pre-defined regions of interest, included the orbitofrontal cortex, superior temporal and frontal gyrus, posterior insula, and anterior cingulate.
Figure 3.
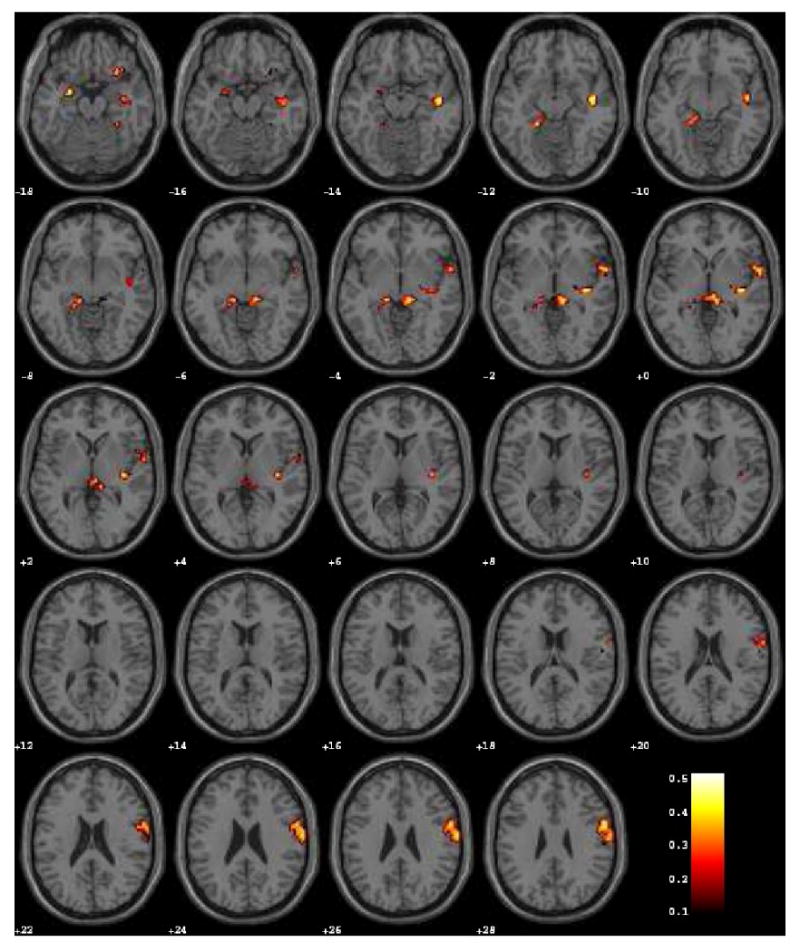
Voxel-wise whole-brain map reflecting exploratory analysis for correlations between β (calculated from the first derivative of the timeseries) and trait anxiety (p < 0.05, cluster threshold > 20 voxels).
Table 2. Exploratory Analysis: Correlation Between Scaling Parameter β and Trait Anxiety.
| MNI Coordinates | Maximally Correlated Voxel | ||||||
|---|---|---|---|---|---|---|---|
| Region | Hemisphere | x | y | z | Cluster Size* (Voxels) |
r value | p value |
| Amygdala | L | -24 | -3 | -18 | 10 | 0.49 | 0.000 |
| Hippocampus | L | -15 | -33 | -9 | 6 | 0.48 | 0.000 |
| Hippocampus | R | 12 | -33 | -3 | 13 | 0.44 | 0.001 |
| Pars triangular, inferior frontal gyrus (BA45) | R | 36 | 27 | 9 | 7 | 0.54 | 0.000 |
| Dorsolateral prefrontal cortex (BA9) | R | 57 | 3 | 30 | 66 | 0.48 | 0.000 |
| Orbitofrontcal cortex | R | 30 | 21 | -21 | 13 | 0.52 | 0.000 |
| Superior Frontal Gyrus (BA6, BA8) | L | -12 | 33 | 30 | 13 | 0.47 | 0.001 |
| Superior Temporal Gyrus (BA21, BA22) | R | 45 | -12 | -12 | 15 | 0.48 | 0.000 |
| Superior Temporal Gyrus (BA22) | R | 63 | 6 | -3 | 13 | 0.45 | 0.001 |
| Posterior Insula | R | 36 | -21 | -3 | 19 | 0.51 | 0.000 |
| Anterior Ciugulate | L | -3 | 18 | 42 | 20 | 0.49 | 0.000 |
Clusters of voxels with p < 0.01; Clusters of size less than 5 voxels discarded.
Heart-Rate Variability Analyses
Individuals with richer frequency spectra, as quantified by smaller β, showed significantly greater autonomic (both sympathetic and parasympathetic) activity for wake ECG in all regions of interest except for the left hippocampus (Table 3).
Table 3. Targeted Analysis: Correlation Between Scaling Parameter β and HRV (PDM).
| MNI Coordinates | Maximally Correlated Voxel | ||||||
|---|---|---|---|---|---|---|---|
| Region | Hemisphere | x | y | z | Cluster Size* (Voxels) |
r value | p value |
| Sympathetic | |||||||
| Amygdala | L | -21 | -6 | -15 | 6 | -0.40 | 0.011 |
| R | 24 | -3 | -21 | -0.61 | 0.000 | ||
| BA45 | R | 42 | 21 | -0.55 | 8 | -0.55 | 0.000 |
| 60 | 21 | 6 | 8 | -0.37 | 0.018 | ||
| BA9 | L | -42 | 36 | 36 | 63 | -0.53 | 0.001 |
| R | 36 | 21 | 36 | 56 | -0.48 | 0.002 | |
| R | 9 | 42 | 24 | 44 | -0.49 | 0.001 | |
| L | -24 | -5 | 39 | 30 | -0.41 | 0.009 | |
| Parasympathetic | |||||||
| Amygdala | L | -24 | -24 | -27 | 15 | -0.42 | 0.008 |
| R | 24 | 0 | -21 | 22 | -0.50 | 0.001 | |
| BA45 | R | 60 | 18 | 9 | 12 | -0.41 | 0.009 |
| R | 60 | 18 | 24 | 6 | -0.37 | 0.017 | |
| BA9 | L | -42 | 33 | 33 | 96 | -0.51 | 0.001 |
| R | 9 | 42 | 18 | 84 | -0.53 | 0.000 | |
| R | 33 | 24 | 42 | 39 | -0.51 | 0.001 | |
| R | 48 | 12 | 30 | 7 | -0.45 | 0.004 | |
| Hippocampus | R | 33 | -27 | -12 | 10 | -0.47 | 0.002 |
Clusters of voxels with p < 0.05; Clusters of size less than 5 voxels discarded.
Discussion
Our aim was to develop a more sensitive global measure of limbic regulation. We started from a control systems model, in which the bilateral amygdala and hippocampus, as well as right BA9 and BA45, were defined—on the basis of previous research—as excitatory and inhibitory components of a negative feedback loop modulating emotional arousal to these same stimuli. By definition, the more supple the control circuit, the more tightly outputs should couple inputs; i.e., respond quickly to new stimuli and then return to baseline following their termination. Sharper responses to stimuli would be characterized by a richer power spectrum (a perfect impulse response would show a flat power spectrum, i.e. β=0). We quantified neural reactivity by calculating the power spectrum density, taking the log and then plotting its slope β: power spectra that included more frequencies showed smaller (flatter) β, with power spectra that included fewer frequencies showed larger (steeper) β. Since we hypothesized that individuals with greater trait anxiety would have less supple limbic regulation, by extension, we predicted that trait anxious individuals would show larger β with respect to their limbic hemodynamic responses.
The data supported our hypothesis, showing significant positive correlations between β for components of the limbic control circuit and trait anxiety, which focused on the left amygdala, BA9, and BA45. The exploratory analysis additionally identified several other regions: the insula, orbitofrontal gyrus, anterior cingulate, and superior frontal gyrus, that are known to be strongly associated with autonomic regulation, emotion regulation, and cognitive functions associated with emotion regulation such as risk-assessment (Baird et al., 2006; Banks et al., 2007; Critchley et al., 2003; Critchley et al., 2005; Paulus et al., 2005; Petrovic et al., 2008; Simmons et al., 2008; Simmons et al., 2006; Stein et al., 2007). As suggested by our hypothesis that dysregulated outputs from the limbic system would provide dysregulated inputs to the autonomic nervous system, we also observed that limbic β was inversely correlated with autonomic regulation, both sympathetic and parasympathetic.
We considered a number of potential confounds. The fact that the cluster sizes for the correlations were reasonably large (>11 voxels), combined with robust correlation coefficients of approximately r ≅ 0.5, suggest that the effect is unlikely to be attributable to voxel-specific random variation. All band ranges associated with the task itself (both the entire block as well as the block's individual stimulus presentations) were deliberately excluded from the analysis in order to avoid confounds due to experimental design. To confirm that the observed dynamics were task-independent, we ran the analysis for the frequency range including within the task (0.002-0.06Hz). Within this frequency range, there were no significant correlations with trait anxiety or HRV in any of the regions of interest, suggesting that the observed dynamics were unrelated to task demands. While it could be possible that the relationship between trait anxiety and time-course dynamics reflects differences in HRV embedded within the BOLD signal, this scenario seems unlikely for several reasons. First, if the differences found were mostly due to the general cardiovascular component of the signal, then the correlations found would be expected to be brain-wide, as opposed to especially localized to the limbic regions of interest. Second, the trait anxiety scores were not correlated with LF, HF, LF/HF ratio, PDM-sympathetic, PDM-parasympathetic, or PDM-sympathetic/parasympathetic for either the Power Spectrum Density or Principal Dynamic Modes methods of evaluating HRV. Likewise, while respiration rate was not monitored for our subjects as they were all healthy, it is reasonable to assume that respiration rate falls outside the specified bandwidth, since the normal adult rest-state breathing rate of 12-20bpm (Tortora and Anagnostakos, 1990) is above 0.2Hz.
The most important limitation of our study was its low temporal resolution. Unfortunately, given the locations of the excitatory and inhibitory nodes of the circuit (i.e., both prefrontal and amygdala), the scans required imaging most of the brain. It would have been foolhardy to do otherwise, since we had no way to know a priori whether the dynamics would be confined to the excitatory regions, inhibitory regions, or both. As a first study, the exploratory approach was deliberate: the fact that the entire brain was imaged but that the dynamics themselves picked out the limbic circuit, itself provided added support for the method. However, given that we now have greater spatial specificity with respect to which ROIs contain scale-invariant dynamics, future studies of trait anxiety could restrict acquisition to only one node of the circuit (for example, the amygdala), present the stimuli for shorter periods, and image at higher temporal resolution to permit expansion of the bandwidth.
In order to most accurately compare the efficacy of our power spectrum scale invariance method versus previously-reported cross-correlations(Mujica-Parodi et al., 2009), the current and previous studies used the same data set of N=65 healthy adults. We excluded fifteen subjects in the current data set due to concerns regarding EPI quality in all regions of interest; however, recalculation of previous cross-correlation coefficients did not show differences between the original and reduced data sets (Table 4). While the two methods were consistent in showing relationships between limbic dysregulation and trait anxiety, as well as limbic dysregulation and diminished heart rate variability, there were important differences between the two results.
Table 4. Trait anxiety negatively correlated with cross-correlation coefficients r for region-of-interest pairs (N=50).
| Contrast | Cross-Correlation pairs | Cross-correlation coefficient × trait anxiety (r) |
Significance (P) |
|---|---|---|---|
| Neutral-rest | L Amygdala × R Amygdala | -0.35 | 0.001 |
| L Amygdala × R Hippocampus | -0.41 | 0.003 | |
| L Amygdala × L Hippocampus | -0.38 | 0.006 | |
| L Amvedala × BA45 | -0.29 | 0.04 | |
| R Hippocampus × BA45 | -0.33 | 0.02 | |
| Happy-rest | L Amvedala × BA45 | -0.31 | 0.03 |
| R Hippocampus × BA45 | -0.35 | 0.01 | |
| BA45 × BA9 | -0.38 | 0.007 |
First, the PSSI results for the ROI analysis were more focused, specifically identifying the left amygdala, right BA9, and right BA45 as regions of less supple regulation, whereas the cross-correlation method identified correlations between trait anxiety and nearly all ROI pairs. These results cohere well with the “local” results for the same article, which suggested an excitatory-inhibitory modulation specifically between the left amygdala and BA45.
Second, the PSSI method permitted measurement of limbic regulation from single-ROI outputs, rather than relying upon dual-ROI-output pairs. This has significant implications for future research and potential clinical applications, since one of the critical obstacles in increasing sensitivity for measurement of limbic regulation is the low sampling-rate of fMRI time-series. Yet other methods with greater temporal resolution, by which a signal might provide frequencies over several orders of magnitude rather than a half-decade—such as EEG and near-infrared spectroscopy—would not be capable of obtaining signals for both components of the pair, since they have no access to subcortical ROIs. Our current results happily suggest that it may be possible to measure the regulation of the limbic system as a whole simply by obtaining coupled signal from prefrontal regions, which should be accessible by both EEG and near-infrared spectroscopy.
Third, the PSSI method showed equivalent or increased detection sensitivity as compared to our previous results using cross-correlations. Whereas previously-reported measures correlated with trait anxiety between r=0.29-0.36 (r=0.29-0.41 for N=50), the PSSI method shows correlations with trait anxiety between r=0.35-0.49; while previous correlations with heart rate variability were r = −0.27, they now reach r = −0.61.
Finally, whereas cross-correlations correlated with increased sympathetic activity, the PSSI method negatively correlated with both sympathetic and parasympathetic activity, suggesting that sluggish limbic regulation translated down-stream into sluggish autonomic regulation, at both shorter-acting (parasympathetic) and slower-acting (sympathetic) time-domains. Importantly, neither autonomic variable significantly correlated with trait anxiety (PDM sympathetic: r=0.14 p=0.4 N=40; PDM parasympathetic r=0.04 p=0.8 N=40) and correlations were not transitive, suggesting that the relationship between limbic and autonomic outputs reflected a mediation, rather than being trivially linked via a common origin.
While scaling has been applied previously to both fMRI and heart rate variability data, fMRI papers have generally applied the method to distinguish spatially-defined activation patterns; i.e., a purely data-driven analog to the general linear model but that does not require a priori specification of the experimental design. For example the scaling nature of fMRI time series was studied (Thurner et al., 2003), and demonstrated that scaling exponents depend upon the underlying level of neural activity, with activated regions showing greater persistence. This occurs because lasting brain activity leads to the presence of smoother structures in the signal, so the dominance of singularities in a signal is reduced. By contrast, heart rate variability research has applied PSSI in order to quantify control systems dysregulation of the autonomic nervous system. Here, we tried to bridge the gap between the two fields by applying scaling to model neural regulation, using a relatively well-understood control system in the brain. In our application, the time series of trait anxious individuals persist longer in the excited state, producing larger values of β.
The strengths of the current method, outlined above, suggest three important directions for future research. First, while cross-correlations provide some gross measure of dysregulation for time-series that are roughly congruent and can be modeled using equivalent hemodynamic response functions, the PSSI method is a more robust method that requires that fewer assumptions be met, a feature that suggests its potential utility with respect to patients. Second, because the PSSI method requires perturbations but does not require that their structure be defined in order to construct a basis function for analysis, the method might lend itself well to resting activation, analogously to heart rate variability. Finally, while cross-correlations require dual-output pairs from cortical and subcortical regions, the PSSI method retains many of the same benefits while permitting single-output cortical measures, a feature that suggests that it could be applied to near-infrared spectroscopy and/or EEG. Doing so could provide even greater sensitivity, since both technologies' sampling frequencies would permit collection of data over significantly longer time-scales without inducing habituation. This would be an important direction for future research, permiting a more rich characterization of scale invariance (which in physics normally is measured over several orders of magnitude) and potential multi-fractality (Shimizu et al., 2004). Morover, increased temporal resolution would also permit future exploration of computational characterizations, such as nonlinear complexity/entropy, which have shown significant diagnostic promise with heart rate variability (Voss et al., 2007) but that are unstable at fMRI's low sampling rates.
Acknowledgments
This research was supported by the Office of Naval Research #N0014-04-1-005 (LRMP) and the National Institutes of Health 5-MO1-RR-10710 (Stony Brook University Hospital General Clinical Research Center).
Footnotes
The authors declare no competing financial interests.
Publisher's Disclaimer: This is a PDF file of an unedited manuscript that has been accepted for publication. As a service to our customers we are providing this early version of the manuscript. The manuscript will undergo copyediting, typesetting, and review of the resulting proof before it is published in its final citable form. Please note that during the production process errors may be discovered which could affect the content, and all legal disclaimers that apply to the journal pertain.
References
- Akselrod S, Gordon D, Ubel FA, Shannon DC, Berger AC, Cohen RJ. Power spectrum analysis of heart rate fluctuation: a quantitative probe of beat-to-beat cardiovascular control. Science. 1981;213:220–222. doi: 10.1126/science.6166045. [DOI] [PubMed] [Google Scholar]
- Baird A, Dewar BK, Critchley H, Dolan R, Shallice T, Cipolotti L. Social and emotional functions in three patients with medial frontal lobe damage including the anterior cingulate cortex. Cogn Neuropsychiatry. 2006;11:369–388. doi: 10.1080/13546800444000245. [DOI] [PMC free article] [PubMed] [Google Scholar]
- Bak P, Tang C, Wiesenfeld K. Self-organized criticality: An explanation of the 1/f noise. Physical Review Letters. 1987;59:381. doi: 10.1103/PhysRevLett.59.381. [DOI] [PubMed] [Google Scholar]
- Bak P, Tang C, Wiesenfeld K. Self-organized criticality. Physical Review A. 1988;38:364. doi: 10.1103/physreva.38.364. [DOI] [PubMed] [Google Scholar]
- Banks SJ, Eddy KT, Angstadt M, Nathan PJ, Phan KL. Amygdala-frontal connectivity during emotion regulation. Soc Cogn Affect Neurosci. 2007;2:303–312. doi: 10.1093/scan/nsm029. [DOI] [PMC free article] [PubMed] [Google Scholar]
- Baxter MG, Parker A, Lindner CC, Izquierdo AD, Murray EA. Control of response selection by reinforcer value requires interaction of amygdala and orbital prefrontal cortex. J Neurosci. 2000;20:4311–4319. doi: 10.1523/JNEUROSCI.20-11-04311.2000. [DOI] [PMC free article] [PubMed] [Google Scholar]
- Beran J. Statistics for Long-Memory Processes. Chapman & Hall/CRC; 1994. [Google Scholar]
- Blair HT, Sotres-Bayon F, Moita MA, Ledoux JE. The lateral amygdala processes the value of conditioned and unconditioned aversive stimuli. Neuroscience. 2005;133:561–569. doi: 10.1016/j.neuroscience.2005.02.043. [DOI] [PubMed] [Google Scholar]
- Bosl WJ, Li R. Mitotic-exit control as an evolved complex system. Cell. 2005;121:325–333. doi: 10.1016/j.cell.2005.04.006. [DOI] [PubMed] [Google Scholar]
- Braman SS. The regulation of normal lung function. Allergy Proc. 1995;16:223–226. doi: 10.2500/108854195778702602. [DOI] [PubMed] [Google Scholar]
- Chon KH, Zhong Y, Wang H, Ju K, Jan KM. Separation of heart rate variability components of the autonomic nervous system by utilizing principal dynamic modes. Nonlinear Dynamics Psychol Life Sci. 2006;10:163–185. [PubMed] [Google Scholar]
- Critchley HD, Mathias CJ, Josephs O, O'Doherty J, Zanini S, Dewar BK, Cipolotti L, Shallice T, Dolan RJ. Human cingulate cortex and autonomic control: converging neuroimaging and clinical evidence. Brain. 2003;126:2139–2152. doi: 10.1093/brain/awg216. [DOI] [PubMed] [Google Scholar]
- Critchley HD, Tang J, Glaser D, Butterworth B, Dolan RJ. Anterior cingulate activity during error and autonomic response. Neuroimage. 2005;27:885–895. doi: 10.1016/j.neuroimage.2005.05.047. [DOI] [PubMed] [Google Scholar]
- Davis M, Whalen PJ. The amygdala: vigilance and emotion. Mol Psychiatry. 2001;6:13–34. doi: 10.1038/sj.mp.4000812. [DOI] [PubMed] [Google Scholar]
- Ekman P. Facial expression and emotion. Am Psychol. 1993;48:384–392. doi: 10.1037//0003-066x.48.4.384. [DOI] [PubMed] [Google Scholar]
- Elamin MB, Murad MH, Mullan R, Erickson D, Harris K, Nadeem S, Ennis R, Erwin PJ, Montori VM. Accuracy of diagnostic tests for Cushing's syndrome: a systematic review and metaanalyses. J Clin Endocrinol Metab. 2008;93:1553–1562. doi: 10.1210/jc.2008-0139. [DOI] [PubMed] [Google Scholar]
- Engelmann I, Bauer G. How can tumor cells escape intercellular induction of apoptosis? Anticancer Res. 2000;20:2297–2306. [PubMed] [Google Scholar]
- Goldberger AL, Rigney DR, West BJ. Chaos and fractals in human physiology. Sci Am. 1990;262:42–49. doi: 10.1038/scientificamerican0290-42. [DOI] [PubMed] [Google Scholar]
- Grassi G. Assessment of sympathetic cardiovascular drive in human hypertension: achievements and perspectives. Hypertension. 2009;54:690–697. doi: 10.1161/HYPERTENSIONAHA.108.119883. [DOI] [PubMed] [Google Scholar]
- Hurst H. Long-term storage of reservoirs: an experimental study. Trans Amer Soc Civil Engineers. 1951;116:770–799. [Google Scholar]
- Ichimura K, Bolin MB, Goike HM, Schmidt EE, Moshref A, Collins VP. Deregulation of the p14ARF/MDM2/p53 pathway is a prerequisite for human astrocytic gliomas with G1-S transition control gene abnormalities. Cancer Res. 2000;60:417–424. [PubMed] [Google Scholar]
- Ivanov PC, Amaral LAN, Goldberger AL, Havlin S, Rosenblum MG, Struzik ZR, Stanley HE. Multifractality in human heartbeat dynamics. Nature. 1999;399:461–465. doi: 10.1038/20924. [DOI] [PubMed] [Google Scholar]
- Ivanov PC, Nunes Amaral LA, Goldberger AL, Havlin S, Rosenblum MG, Stanley HE, Struzik ZR. From 1/f noise to multifractal cascades in heartbeat dynamics. Chaos. 2001;11:641–652. doi: 10.1063/1.1395631. [DOI] [PubMed] [Google Scholar]
- Izquierdo A, Murray EA. Opposing effects of amygdala and orbital prefrontal cortex lesions on the extinction of instrumental responding in macaque monkeys. Eur J Neurosci. 2005;22:2341–2346. doi: 10.1111/j.1460-9568.2005.04434.x. [DOI] [PubMed] [Google Scholar]
- Izquierdo A, Suda RK, Murray EA. Comparison of the effects of bilateral orbital prefrontal cortex lesions and amygdala lesions on emotional responses in rhesus monkeys. J Neurosci. 2005;25:8534–8542. doi: 10.1523/JNEUROSCI.1232-05.2005. [DOI] [PMC free article] [PubMed] [Google Scholar]
- Khoo MCK. Physiological Control Systems, Analysis, Simulation and Estimation. John Wiley & Sons, Inc.; New York: 2000. [Google Scholar]
- Kurths J, Voss A, Saparin P, Witt A, Kleiner HJ, Wessel N. Quantitative analysis of heart rate variability. Chaos. 1995;5:88–94. doi: 10.1063/1.166090. [DOI] [PubMed] [Google Scholar]
- Lancaster JL, Woldorff MG, Parsons LM, Liotti M, Freitas CS, Rainey L, Kochunov PV, Nickerson D, Mikiten SA, Fox PT. Automated Talairach atlas labels for functional brain mapping. Hum Brain Mapp. 2000;10:120–131. doi: 10.1002/1097-0193(200007)10:3<120::AID-HBM30>3.0.CO;2-8. [DOI] [PMC free article] [PubMed] [Google Scholar]
- LeDoux JE. Emotion circuits in the brain. Annu Rev Neurosci. 2000;23:155–184. doi: 10.1146/annurev.neuro.23.1.155. [DOI] [PubMed] [Google Scholar]
- Linkenkaer-Hansen K, Nikouline VV, Palva JM, Ilmoniemi RJ. Long-range temporal correlations and scaling behavior in human brain oscillations. J Neurosci. 2001;21:1370–1377. doi: 10.1523/JNEUROSCI.21-04-01370.2001. [DOI] [PMC free article] [PubMed] [Google Scholar]
- Mandelbrot B. The fractal geometry of nature. W.H. Freeman; New York: 1982. [Google Scholar]
- Mandelbrot B, van Ness J. Fractional Brownian motions, fractional noises and applications. Society for Industrial and Applied Mathematics Review. 1968;10:422–437. [Google Scholar]
- Maren S. Building and burying fear memories in the brain. Neuroscientist. 2005;11:89–99. doi: 10.1177/1073858404269232. [DOI] [PubMed] [Google Scholar]
- Miller DB, O'Callaghan JP. Neuroendocrine aspects of the response to stress. Metabolism. 2002;51:5–10. doi: 10.1053/meta.2002.33184. [DOI] [PubMed] [Google Scholar]
- Morgane PJ, Mokler DJ. The limbic brain: Continuing resolution. Neuroscience & Biobehavioral Reviews. 2006;30:119–125. doi: 10.1016/j.neubiorev.2005.04.020. [DOI] [PubMed] [Google Scholar]
- Mujica-Parodi LR, Korgaonkar M, Ravindranath B, Greenberg T, Tomasi D, Wagshul M, Ardekani B, Guilfoyle D, Khan S, Zhong Y, Chon K, Malaspina D. Limbic dysregulation is associated with lowered heart rate variability and increased trait anxiety in healthy adults. Hum Brain Mapp. 2009;30:47–58. doi: 10.1002/hbm.20483. [DOI] [PMC free article] [PubMed] [Google Scholar]
- Mujica-Parodi LR, Yeragani V, Malaspina D. Nonlinear complexity and spectral analyses of heart rate variability in medicated and unmedicated patients with schizophrenia. Neuropsychobiology. 2005;51:10–15. doi: 10.1159/000082850. [DOI] [PMC free article] [PubMed] [Google Scholar]
- Muscogiuri G, Chavez AO, Gastaldelli A, Perego L, Tripathy D, Saad MJ, Velloso L, Folli F. The crosstalk between insulin and renin-angiotensin-aldosterone signaling systems and its effect on glucose metabolism and diabetes prevention. Curr Vasc Pharmacol. 2008;6:301–312. doi: 10.2174/157016108785909715. [DOI] [PubMed] [Google Scholar]
- Norris SL, Kansagara D, Bougatsos C, Fu R. Screening adults for type 2 diabetes: a review of the evidence for the U.S. Preventive Services Task Force. Ann Intern Med. 2008;148:855–868. doi: 10.7326/0003-4819-148-11-200806030-00008. [DOI] [PubMed] [Google Scholar]
- Pagani M, Lombardi F, Guzzetti S, Rimoldi O, Furlan R, Pizzinelli P, Sandrone G, Malfatto G, Dell'Orto S, Piccaluga E, et al. Power spectral analysis of heart rate and arterial pressure variabilities as a marker of sympatho-vagal interaction in man and conscious dog. Circ Res. 1986;59:178–193. doi: 10.1161/01.res.59.2.178. [DOI] [PubMed] [Google Scholar]
- Paulus MP, Feinstein JS, Leland D, Simmons AN. Superior temporal gyrus and insula provide response and outcome-dependent information during assessment and action selection in a decision-making situation. Neuroimage. 2005;25:607–615. doi: 10.1016/j.neuroimage.2004.12.055. [DOI] [PubMed] [Google Scholar]
- Peng CK, Mietus J, Hausdorff JM, Havlin S, Stanley HE, Goldberger AL. Long-range anticorrelations and non-Gaussian behavior of the heartbeat. Physical Review Letters. 1993;70:1343. doi: 10.1103/PhysRevLett.70.1343. [DOI] [PubMed] [Google Scholar]
- Petrovic P, Pleger B, Seymour B, Kloppel S, De Martino B, Critchley H, Dolan RJ. Blocking central opiate function modulates hedonic impact and anterior cingulate response to rewards and losses. J Neurosci. 2008;28:10509–10516. doi: 10.1523/JNEUROSCI.2807-08.2008. [DOI] [PMC free article] [PubMed] [Google Scholar]
- Phan KL, Wager T, Taylor SF, Liberzon I. Functional neuroanatomy of emotion: a meta-analysis of emotion activation studies in PET and fMRI. Neuroimage. 2002;16:331–348. doi: 10.1006/nimg.2002.1087. [DOI] [PubMed] [Google Scholar]
- Phelps EA, Delgado MR, Nearing KI, LeDoux JE. Extinction learning in humans: role of the amygdala and vmPFC. Neuron. 2004;43:897–905. doi: 10.1016/j.neuron.2004.08.042. [DOI] [PubMed] [Google Scholar]
- Phillips ML, Young AW, Senior C, Brammer M, Andrew C, Calder AJ, Bullmore ET, Perrett DI, Rowland D, Williams SC, Gray JA, David AS. A specific neural substrate for perceiving facial expressions of disgust. Nature. 1997;389:495–498. doi: 10.1038/39051. [DOI] [PubMed] [Google Scholar]
- Pomeranz B, Macaulay RJ, Caudill MA, Kutz I, Adam D, Gordon D, Kilborn KM, Barger AC, Shannon DC, Cohen RJ, et al. Assessment of autonomic function in humans by heart rate spectral analysis. Am J Physiol. 1985;248:H151–153. doi: 10.1152/ajpheart.1985.248.1.H151. [DOI] [PubMed] [Google Scholar]
- Radulescu AR, Mujica-Parodi L. A principal component network analysis of prefrontal-limbic fMRI time series in schizophrenia patients and healthy controls Psychiatry Research. Neuroimaging. 2009;174(3) doi: 10.1016/j.pscychresns.2009.04.017. in press. [DOI] [PMC free article] [PubMed] [Google Scholar]
- Radulescu AR, Mujica-Parodi LR. A systems approach to prefrontal-limbic dysregulation in schizophrenia. Neuropsychobiology. 2008;57:206–216. doi: 10.1159/000151731. [DOI] [PubMed] [Google Scholar]
- Rosenkranz JA, Moore H, Grace AA. The prefrontal cortex regulates lateral amygdala neuronal plasticity and responses to previously conditioned stimuli. J Neurosci. 2003;23:11054–11064. doi: 10.1523/JNEUROSCI.23-35-11054.2003. [DOI] [PMC free article] [PubMed] [Google Scholar]
- Shelhamer M. Nonlinear dynamics in physiology : a state-space approach. World Scientific; Singapore: 2007. [Google Scholar]
- Shimizu Y, Barth M, Windischberger C, Moser E, Thurner S. Wavelet-based multifractal analysis of fMRI time series. Neuroimage. 2004;22:1195–1202. doi: 10.1016/j.neuroimage.2004.03.007. [DOI] [PubMed] [Google Scholar]
- Simmons A, Matthews SC, Paulus MP, Stein MB. Intolerance of uncertainty correlates with insula activation during affective ambiguity. Neurosci Lett. 2008;430:92–97. doi: 10.1016/j.neulet.2007.10.030. [DOI] [PMC free article] [PubMed] [Google Scholar]
- Simmons A, Strigo I, Matthews SC, Paulus MP, Stein MB. Anticipation of aversive visual stimuli is associated with increased insula activation in anxiety-prone subjects. Biol Psychiatry. 2006;60:402–409. doi: 10.1016/j.biopsych.2006.04.038. [DOI] [PubMed] [Google Scholar]
- Smith SM. Fast robust automated brain extraction. Hum Brain Mapp. 2002;17:143–155. doi: 10.1002/hbm.10062. [DOI] [PMC free article] [PubMed] [Google Scholar]
- Sotres-Bayon F, Bush DE, LeDoux JE. Emotional perseveration: an update on prefrontal-amygdala interactions in fear extinction. Learn Mem. 2004;11:525–535. doi: 10.1101/lm.79504. [DOI] [PubMed] [Google Scholar]
- Sotres-Bayon F, Cain CK, Ledoux JE. Brain mechanisms of fear extinction: historical perspectives on the contribution of prefrontal cortex. Biol Psychiatry. 2006;60:329–336. doi: 10.1016/j.biopsych.2005.10.012. [DOI] [PubMed] [Google Scholar]
- Spielberger CD. Manual for the State-Trait Anxiety Inventory (Form Y) Consulting Psychologists Press; Palo Alto (CA): 1983. [Google Scholar]
- Stein MB, Simmons AN, Feinstein JS, Paulus MP. Increased amygdala and insula activation during emotion processing in anxiety-prone subjects. Am J Psychiatry. 2007;164:318–327. doi: 10.1176/ajp.2007.164.2.318. [DOI] [PubMed] [Google Scholar]
- Stenberg VI, Fiechtner JJ, Rice JR, Miller DR, Johnson LK. Endocrine control of inflammation: rheumatoid arthritis double-blind, crossover clinical trial. Int J Clin Pharmacol Res. 1992;12:11–18. [PubMed] [Google Scholar]
- Tang C, Bak P. Critical exponents and scaling relations for self-organized critical phenomena. Phys Rev Lett. 1988;60:2347–2350. doi: 10.1103/PhysRevLett.60.2347. [DOI] [PubMed] [Google Scholar]
- Task Force of the European Society of Cardiology, a.t.N.A.S.o.P.a.E. Heart rate variability: standards of measurement, physiological interpretation and clinical use. Circulation. 1996:1043–1065. [PubMed] [Google Scholar]
- Thurner S, Feurstein M, Teich M. Multiresolution wavelet analysis of heartbeat intervals discriminates healthy patients from those with cardiac pathology. Phys Rev Lett. 1998;80:1544–1547. [Google Scholar]
- Thurner S, Windischberger C, Moser E, Walla P, Barth M. Scaling laws and persistence in human brain activity. Physica A. 2003;326:511–521. [Google Scholar]
- Tortora G, Anagnostakos N. Principles of Anatomy and Physiology. 6th. Harper-Collings; New York: 1990. [Google Scholar]
- Ventura J, Liberman RP, Green MF, Shaner A, Mintz J. Training and quality assurance with the Structured Clinical Interview for DSM-IV (SCID-I/P) Psychiatry Res. 1998;79:163–173. doi: 10.1016/s0165-1781(98)00038-9. [DOI] [PubMed] [Google Scholar]
- Voss A, Kurths J, Kleiner HJ, Witt A, Wessel N. Improved analysis of heart rate variability by methods of nonlinear dynamics. J Electrocardiol. 1995;28(Suppl):81–88. doi: 10.1016/s0022-0736(95)80021-2. [DOI] [PubMed] [Google Scholar]
- Voss A, Schroeder R, Truebner S, Goernig M, Figulla HR, Schirdewan A. Comparison of nonlinear methods symbolic dynamics, detrended fluctuation, and Poincare plot analysis in risk stratification in patients with dilated cardiomyopathy. Chaos. 2007;17:015120. doi: 10.1063/1.2404633. [DOI] [PubMed] [Google Scholar]
- Williams LM, Das P, Harris AW, Liddell BB, Brammer MJ, Olivieri G, Skerrett D, Phillips ML, David AS, Peduto A, Gordon E. Dysregulation of arousal and amygdala-prefrontal systems in paranoid schizophrenia. Am J Psychiatry. 2004;161:480–489. doi: 10.1176/appi.ajp.161.3.480. [DOI] [PubMed] [Google Scholar]
- Zarahn E, Aguirre GK, D'Esposito M. Empirical Analyses of BOLD fMRI Statistics I. Spatially Unsmoothed Data Collected under Null-Hypothesis Conditions. Neuroimage. 1997;5:179–197. doi: 10.1006/nimg.1997.0263. [DOI] [PubMed] [Google Scholar]
- Zhong Y, Jan KM, Ju KH, Chon KH. Quantifying cardiac sympathetic and parasympathetic nervous activities using principal dynamic modes analysis of heart rate variability. Am J Physiol Heart Circ Physiol. 2006;291:H1475–1483. doi: 10.1152/ajpheart.00005.2006. [DOI] [PubMed] [Google Scholar]