Abstract
The de novo structure of an antimicrobial protein, human α-defensin 1 (HNP-1), is determined by combining a 3D 13C-13C-13C (CCC) magic-angle spinning (MAS) correlation experiment with standard resonance assignment experiments. Using a short spin diffusion mixing time to assign intra-residue cross peaks and a long mixing time to detect inter-residue correlation peaks, we show that the 3D CCC experiment not only reduces the ambiguity of resonance assignment, but more importantly yields two orders of magnitude more long-range distances without recourse to existing crystal structures. Most of these distance constraints could not be obtained in a de novo fashion from 2D correlation spectra due to significant resonance overlap. Combining the distance constraints from the 3D CCC experiment and the chemical-shift-derived torsion angles, we obtained a de novo high-resolution NMR structure of HNP-1, with a heavy-atom RMSD of 3.4 Å from the crystal structure of the analogous HNP-3. The average energy of the minimum-energy ensemble is less than of 40 kcal/mol. Thus, the 3D CCC experiment provides a reliable means of restraining the three-dimensional structure of insoluble proteins with unknown conformations.
Introduction
Magic-angle spinning (MAS) solid-state NMR (SSNMR) spectroscopy has become a complementary method to solution NMR and X-ray crystallography for structure determination of proteins. Techniques for measuring a large number of conformational constraints, such as chemical shifts [1–9], torsion angles [10–12], and distances [13–16], have been recently developed. For uniformly 13C-labeled proteins, distance constraints are usually obtained from 2D 13C-13C correlation spectra such as PDSD, DARR, and CHHC [17–20]. To obtain long-distance constraints, long spin diffusion mixing times are usually required, resulting in a large number of cross peaks that are difficult to resolve and assign, since even the subset of short-range cross peaks already required 3D heteronuclear correlation experiments to fully resolve. Recently, a Proton Assisted Recoupling (PAR) experiment [21; 22] was introduced to selectively enhance the intensities of weakly coupled long-range cross peaks in 2D spectra. Despite this improvement, 2D 13C-13C correlation approaches remain of limited utility for distance extraction, and often existing crystal structures or structural models were relied on for assigning the cross peaks in these congested 2D spectra.
Three-dimensional 13C-13C-13C (CCC) correlation experiments have been proposed to facilitate resonance assignment [23; 24]. Baldus and co-workers [23] demonstrated a CCC experiment that contains a double-quantum (DQ) indirect dimension, which avoids the cubic diagonal in the 3D spectrum and identifies the intra-residue cross peaks through the DQ signals. Rienstra and coworkers [24] proposed an alternative 3D CCC experiment that uses soft 180° and 90° pulses to selectively detect the aliphatic region of the 13C spectrum in the F1 and F2 dimensions, thus shortening experimental time. However, both studies focused on increasing intra-residue resonance assignment rather than extracting long-range distances. In this work, we show that the 3D CCC experiment not only improves resonance assignment, but allows distance extraction in a de novo fashion, which is essential for restraining the three-dimensional fold of structurally unknown proteins.
Human neutrophil α-defensins (HNPs) are cationic antimicrobial proteins of the human innate immune system to protect against microbial infections [25]. Six human α-defensins are known. They contain 29 – 33 amino acid residues and six conserved cysteins that form three intramolecular disulfide bonds [26–29]. HNPs kill a broad range of pathogens, including bacteria, fungi and certain enveloped viruses [25; 30]. Similar to most antimicrobial peptides (AMPs), the main mode of action of HNPs is the disruption of the cell membrane of the invading pathogen [31; 32]. Several crystal structures of HNPs have been reported [33–36]; however, all these structures were solved in the absence of any membranes or membrane-mimetic solvents, thus their relevance for the membrane-bound structure and mechanism of HNPs remains unknown. Understanding the detailed mechanism of human α-defensins thus requires high-resolution structures of HNPs in the lipid membrane.
We have initiated a solid-state NMR investigation of the three-dimensional structure of HNP-1 in lipid membranes. As a first step, the resonance assignment of the 30-residue HNP-1 in a microcrystalline state has been completed using various 2D 13C-13C and 3D 13C-15N correlation techniques [37]. However, the long-distance correlation peaks observed in the 2D CC spectra could not be assigned without using information from the crystal structure of the analogous HNP-3 [33]. In this work, we show that the 3D CCC experiment allows a large number of inter-residue distances to be identified, thus permitting a de novo structure determination of HNP-1. We also quantify the increased information content of the 3D CCC experiment compared to the 2D CC experiment.
Materials and Methods
Sample preparation
Uniformly 13C, 15N-labeled HNP-1 in microcrystalline form was prepared as described in a separate report [37]. Briefly, a fusion protein containing the HNP-1 sequence, GST-proHNP1, was expressed in E. coli, folded, and cleaved to yield the HNP-1 precursor protein proHNP-1. ProHNP-1 was purified by reversed-phase HPLC and cleaved by cyanogen bromide to give folded HNP-1. Microcrystalline HNP-1 was prepared by precipitation from a pH 6.5 polyethyleneglycol-400 solution. The hydrated protein microcrystals were centrifuged into the MAS rotors. 3–5 mg of microcrystals were packed into a 4 mm rotor and a 2.5 mm rotor.
Solid-state NMR
Solid-state NMR experiments were carried out on a Bruker AVANCE-600 (14.1 Tesla) spectrometer. The 2D 13C-13C DARR spectrum with a mixing time of 100 ms was measured at 253 K under 12 kHz MAS using a 2.5 mm rotor sample. The spectral widths of the direct (F2) and indirect (F1) dimensions were 50 kHz and 27 kHz, respectively. A total of 300 t1 slices and 96 scans per slice were measured, resulting in an experimental time of 17 hours.
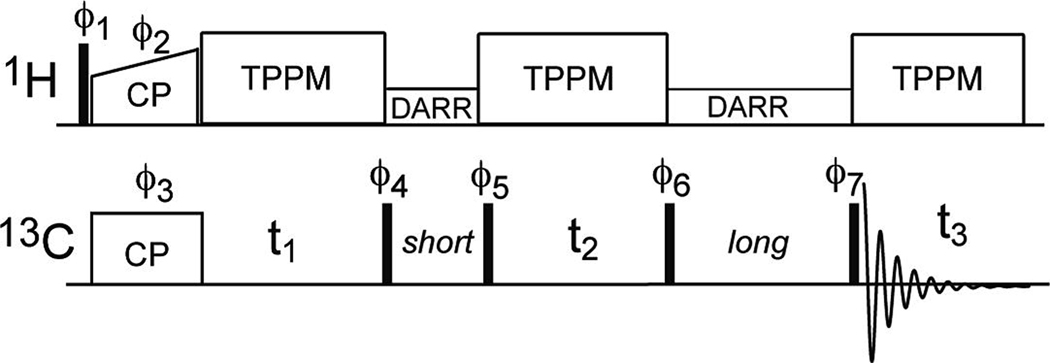
The 3D CCC pulse sequence is shown in Fig. 1. The experiment was carried out at 253 K under 8 kHz MAS using a 4 mm rotor sample. The first and second DARR mixing times were 20 ms and 100 ms, respectively. The F1 and F2 spectral widths were 13 kHz (86.7 ppm). The 13C carrier was set to 39.6 ppm, thus the F1 and F2 spectral windows ranged from −3.5 to 82.7 ppm. This spectral range folded the Arg Cζ region in 157–169 ppm to 70.8–82.8 ppm, and the CO region at 170 – 180 ppm to −2.4–7.6 ppm. Both folded regions avoided resonance overlap with the aliphatic carbons. The 3D spectrum was measured with 130 t1 slices, 130 t2 slices, and 8 scans per slice, resulting in an experimental time of 71 hours.
Fig. 1.
Pulse sequence for the 3D CCC MAS correlation experiment. Phase cycles are: ϕ1 = 0 2, ϕ2 = 1, ϕ3= 0 0 1 1 2 2 3 3, ϕ4 = 1 1 2 2 3 3 0 0, ϕ5 = 3 3 0 0 1 1 2 2, ϕ6 = 1 1 2 2 3 3 0 0, 3 3 0 0 1 1 2 2, ϕ7 = 0 1 2 3 2 3 0 1, and receiver = 1 0 3 2 3 2 1 0, 3 2 1 0 1 0 3 2. Here 0 = +x, 1 = +y, 2 = −x, and 3 = −y.
Typical 90° pulse lengths were 4–5 µs for both 1H and 13C channels. The 1H-13C cross polarization contact time was 700 µs and the 1H decoupling field strength was 71 kHz in the experiments. The 13C chemical shifts were referenced externally to the α-Gly 13C’ signal at 176.49 ppm on the TMS scale.
Structure calculation
The 2D and 3D 13C correlation spectra were assigned using the program SPARKY. Structure calculation was carried out using the XPLOR-NIH program [38; 39]. Distance constraints were inputted similar to that of Castellani et al [13], where sequential Cα-Cα distances were fixed to 3.8±0.5 Å, and other inter-residue distances were given the range of 2.5–7.5 Å for the 100 ms DARR mixing time used in the 3D CCC experiment [13; 40]. In addition to unique distance constraints, ambiguous distances with a degeneracy of less than 5 were included in the input file. Dihedral angle constraints obtained from the assigned 13C and 15N chemical shifts [41] were also included [37]. Structure calculations proceeded in two stages. For the annealing process, an ensemble of 200 structures was calculated by performing molecular dynamics at 3500 K for 40 ps, followed by slow cooling from 3500 K to 25 K in 12.5 K increments, with 0.4 ps of dynamics at each temperature using a soft square NOE potential. In the second stage, each structure was refined by repeating the annealing protocol with only 10 ps of initial annealing using a hard square NOE potential with the kNOE force constant held at 30 kcal. After structure refinement, the ensemble of 10 lowest energy structures was selected to represent the final structure of HNP-1. The final structure has been deposited to the Protein Data Bank (Accession code: 2KHT).
Results and Discussion
2D CC spectrum at long mixing times
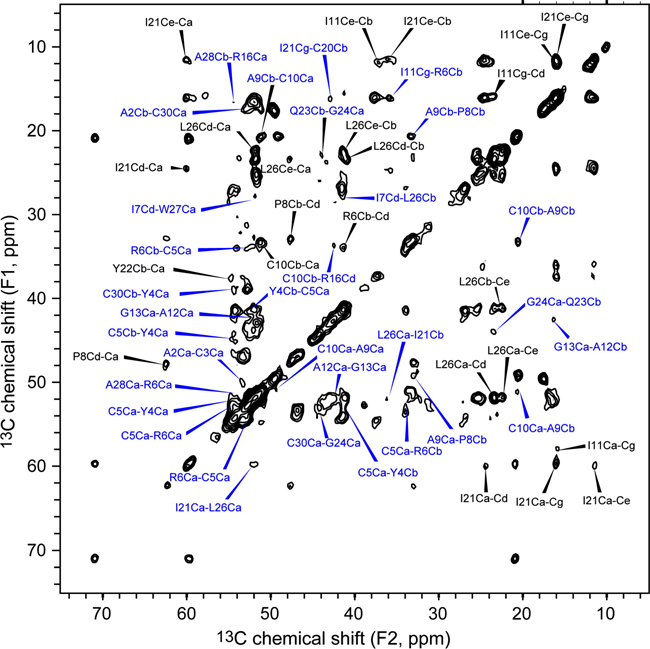
Before describing the analysis of the 3D CCC experiment, we first present the 100 ms 2D DARR spectrum (Fig. 2), which was measured to obtain long-range correlation peaks in a conventional manner [37]. All inter-residue cross peaks in the 2D spectrum are annotated in blue, and selected intra-residue cross peaks are annotated in black. For most inter-residue cross peaks, the assignments are ambiguous, with a degeneracy of 2 or higher. Only one of the assignment possibilities is listed in Fig. 2. For example, the peak at (F1 = 33.7 ppm, F2 = 42.5 ppm) can be assigned either to R6Cβ-R16Cδ or C10Cβ-R16Cδ, corresponding to an assignment degeneracy of 2. From this 100 ms 2D CC spectrum, a total of 24 inter-residue cross peaks with an assignment degeneracy of 1 – 8 were found. Among these peaks, 15 peaks were assigned to sequential correlations (|i-j|=1), 1 peak was assigned to medium correlations (1<|i-j|≤ 4), and 8 peaks were assigned to long-range correlations (|i-j|>4).
Fig. 2.
2D 13C-13C correlation spectrum of microcrystalline HNP-1 at a DARR mixing time of 100 ms. The spectrum was measured under 12 kHz MAS at 253 K. Inter-residue cross peaks are annotated in blue, and some intra-residue peaks are also assigned, in black.
3D CCC experiment
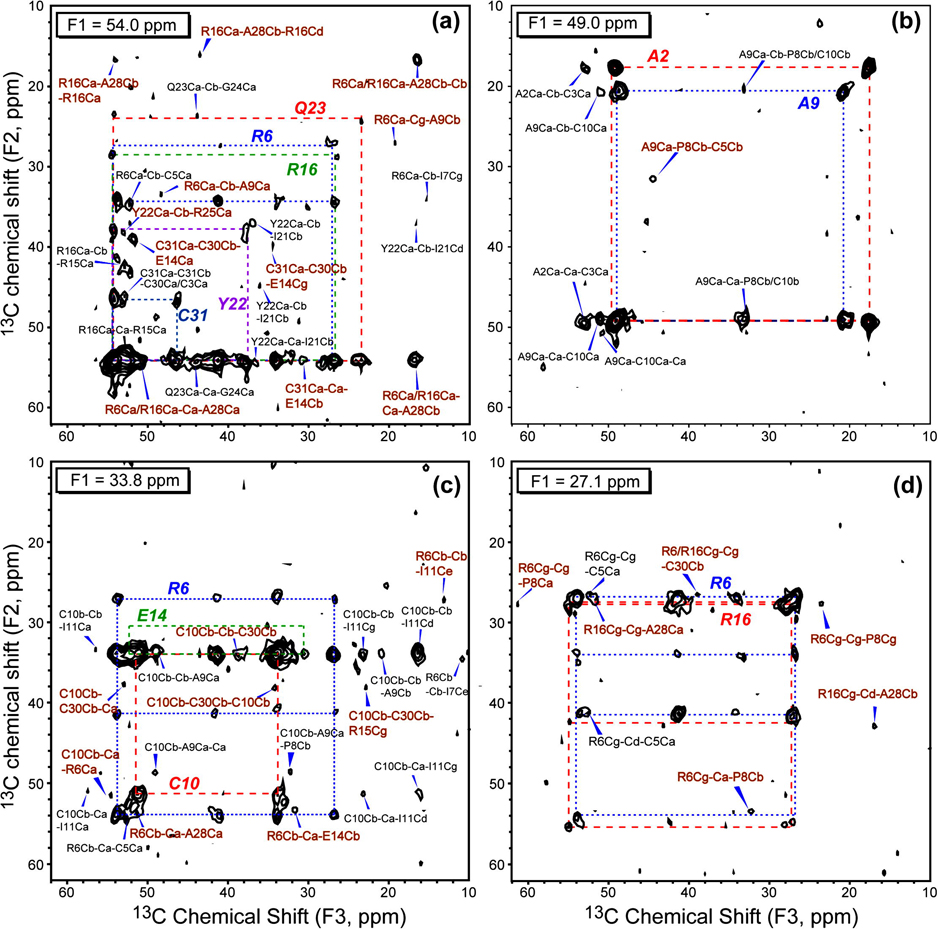
The 3D CCC experiment was carried out using a DARR mixing time of 20 ms between F1 and F2 and 100 ms between F2 and F3 dimensions. The short mixing time allows polarization transfer mostly within the same residue while the long mixing time establishes inter-residue correlations. Fig. 3 shows 4 representative 2D planes at F1 = 54.0, 49.0, 33.8, and 27.1 ppm. Compared to the 2D spectrum, each F2-F3 plane has a much smaller number of peaks, thus facilitating resonance assignment. For example, based on the previous assignment [37], the F2-F3 plane at F1 = 54.0 ppm (Fig. 3a) can be attributed to five Cα sites: R6Cα (53.9 ppm), R16Cα (54.5 ppm), Y22Cα (54.2 ppm), Q23Cα (54.2 ppm) and C31Cα (54.0 ppm). Indeed, five networks of resonances indicated by dashed lines were observed, representing the spin systems of R6, R16, C31, Q23, and Y22. For example, in the R6 spin system (blue dashed lines), R6Cα (53.9 ppm), R6Cβ (33.7 ppm), and R6Cγ (26.7 ppm) are detected in the F2 dimension due to spin diffusion from R6Cα during the 20 ms mixing time. Intra-residue cross peaks such as R6Cα-Cβ-Cδ (54.0 ppm, 34.3 ppm, 41.2 ppm) and R6Cα-Cγ-Cδ (54.0 ppm, 26.9 ppm, 41.2 ppm) are readily identified in the blue square.
Fig. 3.
F2–F3 planes of the 3D CCC spectrum at various F1 frequencies. (a) F1=54.0 ppm, (b) F1=49.0 ppm, (c) F1=33.8 ppm, (d) F1=27.1 ppm. The amino acid spin systems are connected by dashed lines. All inter-residue cross peaks are assigned. The non-sequential inter-residue cross peaks are shown in brown while the sequential cross peaks are in black.
More important than the intra-residue cross peaks are inter-residue cross peaks in these 2D planes, which are annotated in brown for non-sequential correlation peaks and black for sequential cross peaks. In assigning these inter-residue peaks, we use the following principles. First, due to the short mixing time between the F1 and F2 dimensions the F1-F2 assignment usually does not extend beyond sequential correlations, with the exception of disulfide bonds and a few very high intensity peaks such as the Ala methyl carbons. Second, for peaks lying at diagonal planes of the 3D spectrum, where either the F1 and F2 frequencies are identical or the F1 and F3 frequencies are identical, the degenerate assignment is resolved by looking for peaks in other planes that belong to the spin systems of the degenerate sites. For example, for two spins A and A’ with similar chemical shifts ωA, the observation of a cross peak at (F1, F2, F3) = (ωA, ωA, ωC) is two-fold degenerate. But if A and A’ have different frequencies for their directly bonded spins B and B’, then the observation of a cross peak at (ωB, ωA, ωC) but not at (ωB’, ωA, ωC) justifies the assignment of (ωA, ωA, ωC) to a long-range correlation between A and C and not between A’ and C.
We illustrate the above principles with several examples. First, the cross peak at (F1, F2, F3) = (54.0 ppm, 33.8 ppm, 52.8 ppm), which does not lie in any diagonal plane, can be uniquely assigned to R6Cα-Cβ-C5Cα, which establishes a sequential constraint. Second, the cross peak at (54.0 ppm, 39.4 ppm, 34.2 ppm) can be uniquely assigned to C31Cα-C30Cβ-E14Cγ, indicating spatial proximity between C30 and E14. Here the other four possibilities for the F1 frequency of 54.0 ppm are ruled out because the short mixing time prohibits long-distance polarization transfer. This non-diagonal cross peak also allowed the peak at (54.0 ppm, 54.0 ppm, 31.0 ppm) to be assigned to C31Cα-C31Cα-E14Cβ with reasonable confidence, even though it appears on a diagonal plane. Another example of a peak with degenerate assignment is the peak at (54.0 ppm, 54.0 ppm, 16.7 ppm). It can be assigned to XCα-Cα-A28Cβ, where X can be one of the five Cα sites at 54.0 ppm. However, one cross peak at (33.8 ppm, 54.0 ppm, 51.3 ppm) in F1 = 33.8 ppm plane (Fig. 3c) and another cross peak at (27.1 ppm, 42.5 ppm, 16.5 ppm) in Fig. 3d were detected that can be uniquely assigned to R6Cb-R6Ca-A28a and R16Cg-R16Cd-A28Cβ, respectively. These R6-A28 and R16-A28 correlations indicate that the (54.0 ppm, 54.0 ppm, 16.7 ppm) peak can be assigned to both R16Ca-R16Ca-A28Cb and R6Ca-R6Ca-A28Cb. In general, non-sequential inter-residue correlations manifest as multiple peaks in different planes of the 3D spectrum, thus increasing the confidence of assignment.
Fig. 3b shows the F1 = 49.0 ppm plane. Two squares corresponding to the A2 (Cα at 49.5 ppm) and A9 (Cα at 48.8 ppm) spin systems are well resolved. Five sequential cross peaks between A2 and C3, A9 and C10 can be uniquely assigned. In addition, two sequential cross peaks with a degeneracy of 2 were detected that correspond to A9-P8 or A9-C10 correlations. In this spectrum, one non-sequential inter-residue cross peak is observed that indicates proximity between P8 and C5 sidechains.
Fig. 3c shows the F2-F3 plane at F1 = 33.8 ppm, with R6, C10 and E14 spin systems, and Fig. 3d displays the F1 = 27.1 ppm plane with the R6 and R16 spin systems. Most non-sequential inter-residue cross peaks fall outside the diagonal planes in these two planes, simplifying assignment. Altogether, 26 non-sequential inter-residue constraints are identified in Fig. 3, greatly exceeding the 9 non-sequential cross peaks identified in the 100 ms 2D 13C-13C DARR spectrum. Most importantly, the 3D assigned long-range correlations are de novo rather than back-confirmed with the crystal structure, thus this approach can be applied to proteins with no pre-existing structure or structural models.
Distance statistics from 3D CCC and 2D CC spectra and assignment map
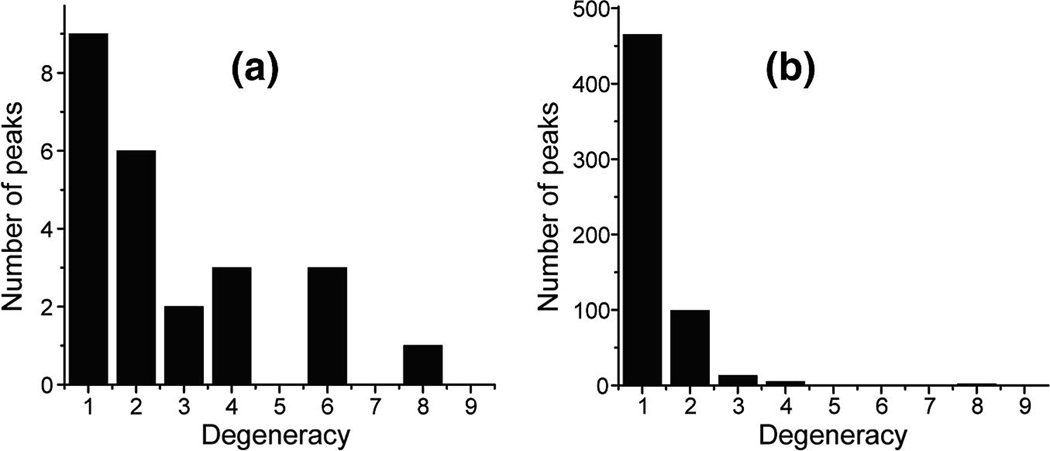
In the two previously published papers on the 3D CCC experiments [23; 24], no analysis was given about the long-range distances that can be obtained. We now quantify the number of long-range distance constraints as well as the completeness of assignment by the 3D CCC experiment on microcrystalline HNP-1. Fig. 4 shows the number of assigned peaks as a function of assignment ambiguity from the 100 ms 2D CC spectrum versus the 3D CCC spectrum. A total of 24 inter-residue correlation peaks was observed in the 100 ms 2D CC spectrum, including 15 sequential, 1 medium-range and 8 long-range correlations. Among the 24 inter-residue peaks, only 9 were uniquely assigned. The average assignment degeneracy is 2.71 with a standard deviation of 0.41.
Fig. 4.
Number of assigned peaks and their degeneracies from 2D and 3D 13C NMR. (a) Statistics of the 100 ms 2D CC spectrum. (b) Statistics of the 3D CCC spectrum, measured with mixing times of 20 ms and 100 ms. The 3D spectrum contains two orders of magnitude more resolved peaks than the 2D spectrum, with lower assignment degeneracies.
In comparison, the 3D CCC spectrum yielded 586 inter-residue correlations peaks, among which 450 were uniquely assigned. Among these unique cross peaks 220 are sequential and 230 are non-sequential cross peaks. The average assignment degeneracy decreased to 1.30 with a standard deviation of 0.04. Therefore, the 3D CCC experiment not only increased the number of inter-residue cross peaks by two orders of magnitude but also decreased the number of ambiguous assignments significantly. Another benefit of the 3D CCC spectrum is that by having a large number of inter-residue correlations, erroneous assignment is better tolerated compared to the case when a much smaller number of constraints are available.
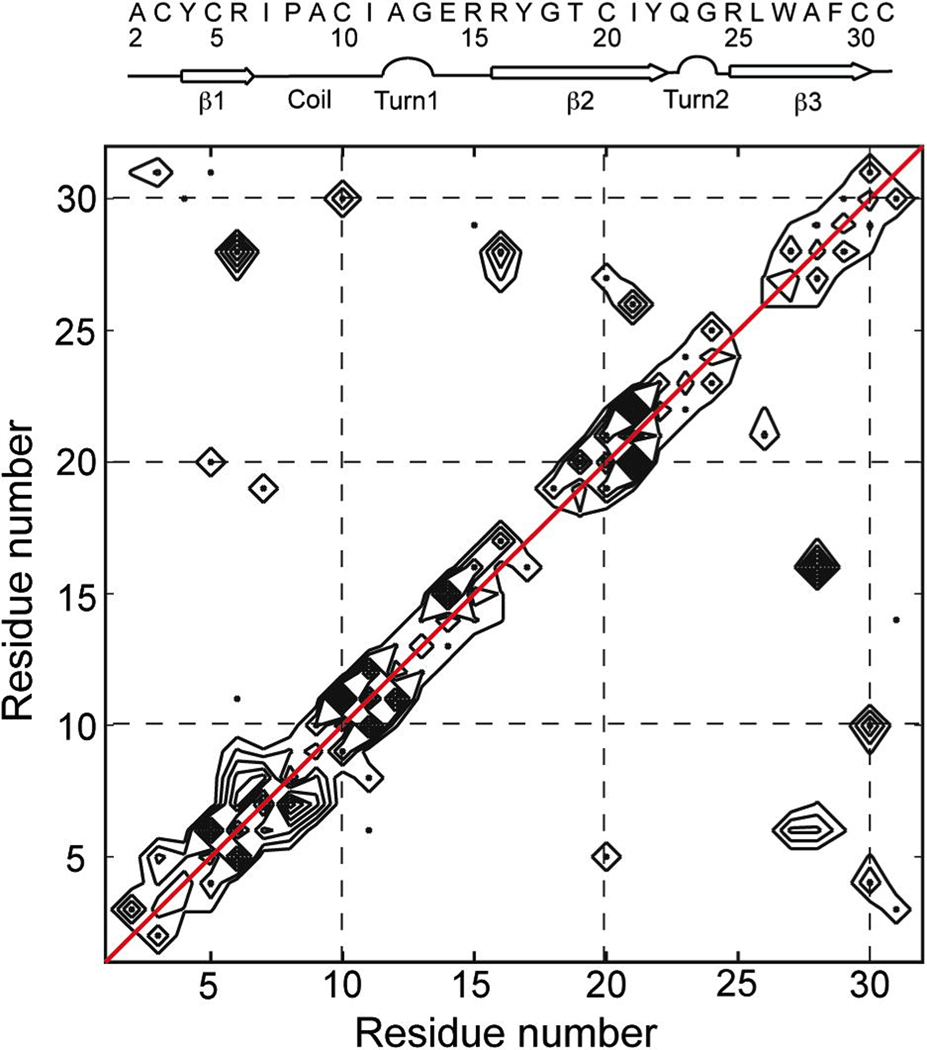
Based on the 3D CCC spectrum, Fig. 5 plots the number of uniquely assigned inter-reside correlation peaks as a function of residue number. The number of distance constraints between two residues can be directly read off the map. For example, the numbers of correlations for the (R6, A28) pair and the (A28, R6) pair are 5 and 3, respectively, which result from eight observed cross peaks in the 3D spectrum, five of which are unique: R6Cγ-A28Cα, R6Cα-A28Cα, R6Cβ-A28Cβ, R6Cα-A28Cβ, R6Cβ-A28Cα, and A28Cα-R6Cβ, A28Cβ-R6Cβ, A28Cβ-R6Cα. These five unique constraints were inputted as NOE constraints for structure calculation. Fig. 5 also shows that the correlations C3-C31, Y4-C30, and R6-A28 indicate two antiparallel β-strands β1 and β3, while the E14-C31, R15-F29, R16-A28, I21-L26, Y22-R25 cross peaks indicate another two antiparallel β-strands, β2 and β3. These antiparallel β-strands are consistent with those of the crystal structure (Fig. 6d). Moreover, three disulfide bond correlations, C3-C31, C5-C20 and C10-C30, which are absent in the 2D spectrum, are now clearly identified, providing another set of important constraints for the HNP-1 structure.
Fig. 5.
2D contour map of the number of inter-residue cross peaks in HNP-1. A red diagonal line (red) indicating auto-correlation is drawn to distinguish from sequential correlation peaks.
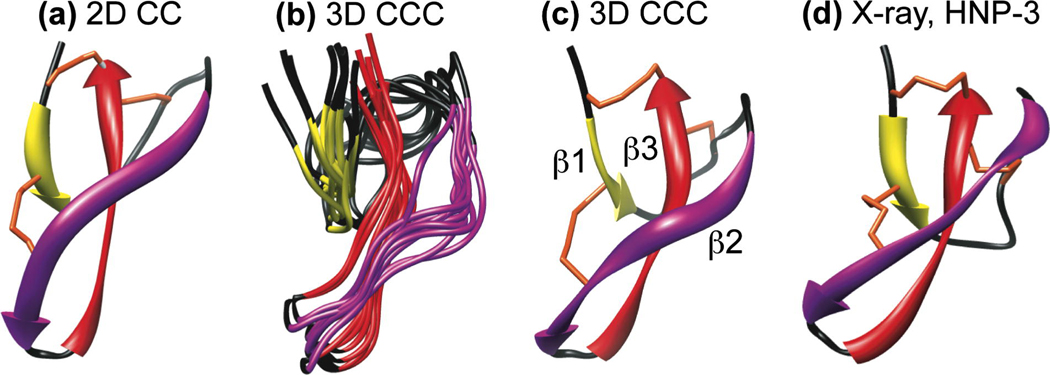
Fig. 6.
Three-dimensional structures of HNP-1 from SSNMR a n d HNP-3 from crystallography. (a) Average minimum-energy SSNMR structure obtained from long-distance constraints detected in the 2D CC spectrum. (b) Ensemble of 10 minimum-energy SSNMR structures obtained from long-distance constraints detected in the 3D CCC spectrum. (c) Average SSNMR structure of (b). All NMR structures shared the same torsion angle constraints obtained from chemical shifts. (d) Crystal structure of HNP-3. Yellow, purple, and red ribbons represent the three β-strands β1, β2, and β3. Black indicates loops. The three disulfide bonds are shown in orange.
Structure calculation
Fig. 6(a–c) shows the calculated HNP-1 structures where the long-range distance constraints were obtained from the 2D CC experiment and 3D CCC experiment. Both structures are compared with the crystal structure of HNP-3 (Fig. 6d). As listed in Table 1, a total of 60 distance constraints were obtained from 2D 13C-13C and 15N-15N correlation experiments, including 13C-13C DARR experiments with 20 ms, 40 ms, 100 ms and 200 ms mixing, a CHHC experiment with 100 µs mixing, and a 15N-15N correlation experiment with 3.0 s mixing [Zhang, 2009 #29]. Among these constraints, 36 were sequential (|i-j|=1), 4 were medium-range (1<|i-j|≤4), and another 20 constraints were long-range restraints (|i-j|>4). Although the long-range cross peaks were assigned by comparing with the crystal structure, due to the small number of distances, the heavy-atom RMSD of the 2D-based NMR structure from the crystal structure is still 3.8 Å (Fig. 6a). These differences include 1) a bulge in the β2 strand of the NMR structure, which is absent in the crystal structure, 2) a different orientation of the β3 strand, and 3) a different orientation of the loop connecting the β1 and β2 strands. The lack of de novo distance determination made it difficult to assess whether the deviation between the NMR structure and the crystal structure results from the low number of distance restraints or from a true conformational distinction between HNP-1 and HNP-3.
Table 1.
SSNMR structure statistics of HNP-1.
| Distance constraints and calculation results | From 2D NMR |
From 3D CCC NMR |
|
|---|---|---|---|
| Number of distance constraints |
Sequential (|i-j| = 1) | 36 | 129 |
| Medium-range (1< |i-j| ≤ 4) | 4 | 45 | |
| Long-range (|i-j| > 4) | 20 | 96 | |
| Unique | 60 | 213 | |
| Ambiguous | 0 | 57 | |
| Total | 60 | 270 | |
| Total (ϕ,ψ) torsion angle constraints | 56 | 56 | |
| Final energy Eglobal (kcal/mol) | 264 | 38.5 | |
| Backbone RMSD from crystal structure (Å) | 2.7 | 2.4 | |
| Heavy-atom RMSD from crystal structure (Å) | 3.8 | 3.4 | |
From the 3D CCC spectrum, we obtained a total of 213 unique distances and 57 ambiguous distances from the 450 uniquely assigned cross peaks. Some atomic pairs exhibit multiple cross peaks in the 3D spectrum, thus increasing the confidence of assignment. Among these distances, 129 are sequential, 45 are medium-range, and 96 are long-range constraints (Table 1). As shown in Fig. 6b, the ten minimum-energy structures are well clustered, and the average structure of the ensemble (Fig. 6c) is more similar to the crystal structure (Fig. 6d) [33] with a heavy-atom RMSD of 3.4 Å. Specifically, the β2 bulge is significantly attenuated in the new NMR structure, and the orientation of the β3 strand is also much closer to that of the HNP-3 structure. The remaining difference is the position of the I7-E14 loop, which can now be more confidently attributed to real conformational differences between the two proteins [Zhang, 2009 #29]. We hypothesize that this remaining conformational difference results from the sequence difference between HNP-1 and HNP-3 and is correlated with the antimicrobial activity difference between the two proteins. On average the HNP-1 antimicrobial activity is about 2-fold stronger than HNP-3 [42]. Since the three core β-strands are well constrained by the disulfide bonds and a tight turn, the only conformationally variable region of the protein is the non hydrogen-bonded loop between β1 and β2 strands. By subtly changing the conformation of the protein, this loop may thus influence the protein’s interaction with the target lipid membrane and hence the antimicrobial activity [34].
How robust is the 3D CCC experiment for protein samples with limited sensitivity? If we increase the lowest contour level by a factor of 1.6, effectively removing the weakest cross peaks, then we obtain fewer (323 inter-residue) cross peaks and fewer (145) distance constraints. But even with a smaller subset of constraints, the backbone RMSD between the resulting average NMR structure and the crystal structure remains reasonably low, 2.6 Å. Thus, the information content of the 3D CCC experiment is sufficient to permit de novo structure determination of proteins with lower sensitivities than available here. Moreover, the present distance analysis only focuses on the correlations between aliphatic carbons. If we include carbonyl and aromatic correlations with the aliphatic carbons, then the number of long-range distance constraints will increase further and ease structure determination.
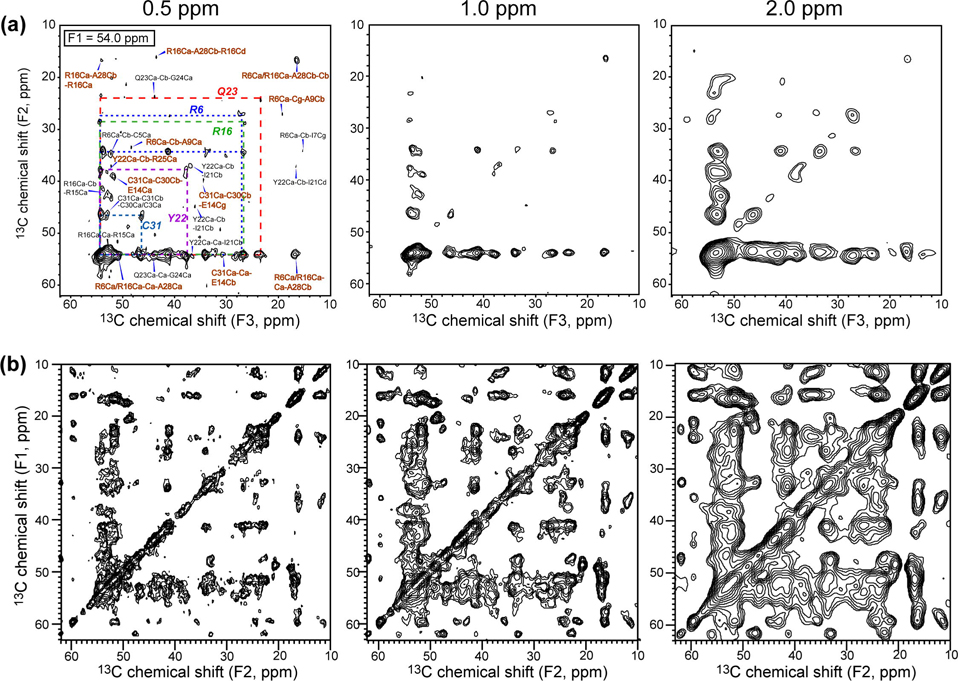
It is also interesting to assess how the number of distance constraints from the 3D CCC experiment is affected by linewidths, considering membrane proteins and other non-crystalline proteins typically have broader lines than microcrystalline proteins. As an example, we processed the F1 = 54.0 ppm plane of the 3D spectrum (Fig. 3a) with different Gaussian line broadening values of 0.5, 1.0 and 2.0 ppm. The number of cross peaks in the aliphatic region (10 – 62 ppm) was found to be 47, 33, and 35, respectively (Fig. 7a). Thus, at linewidths typical of non-crystalline proteins (1–2 ppm), the number of resolved peaks decreases only modestly, to about 75% of the maximum number. Interestingly, the peak number does not decrease from 1.0 ppm to 2.0 ppm linewidths, suggesting that each plane of the 3D spectrum is sufficiently uncongested that it is insensitive to changes in this range of linewidths. In comparison, the number of aliphatic cross peaks in the 100 ms 2D DARR spectrum is 194, 126, and 84 for 0.5, 1.0, and 2.0 ppm line broadening (Fig. 7b). Thus, the resolved peaks decreased to only 43% of the maximum value. Moreover, the peak number is significantly smaller under 2.0 ppm line broadening than under 1.0 ppm broadening, reflecting the intrinsic spectral congestion. Thus, the 3D CCC spectra are less affected by larger linewidths than 2D CC spectra, making the 3D CCC experiment also robust in terms of resolution.
Fig. 7.
Effects of linewidths on the number of resolved cross peaks from 3D CCC and 2D DARR spectra. (a) F1=54.0 ppm plane of the 3D CCC spectrum, processed with Gaussian line broadening values of 0.5 ppm (left), 1.0 ppm (middle), and 2.0 ppm (right). The numbers of cross peaks are 47, 33, and 35, respectively. (b) 2D 100 ms DARR spectrum, processed with Gaussian line broadening values of 0.5 ppm, 1.0 ppm, and 2.0 ppm, from the left to the right. The numbers of cross peaks are 194, 126, and 84, respectively.
Conclusion
We have shown that the 3D CCC experiment is very useful for resolving and extracting a large number of inter-residue distances that are crucial for de novo determination of the three-dimensional structure of proteins by solid-state NMR. By reducing peak congestion, the 3D CCC experiment reduces assignment ambiguity and significantly increases the number of long-range distance constraints. The information content is much larger than several 2D correlation experiments combined. This 3D CCC approach can be readily combined with techniques that preferentially detect long-range distances such as the PAR experiment. Similarly, one can combine the 3D CCC experiments with alternative isotopic labeling schemes to further facilitate long distance extraction.
Acknowledgment
This work is supported by an NIH grant GM66976 to M.H and an NSF instrumentation grant DBI421374 for the 600 MHz NMR at Iowa State University.
Footnotes
Publisher's Disclaimer: This is a PDF file of an unedited manuscript that has been accepted for publication. As a service to our customers we are providing this early version of the manuscript. The manuscript will undergo copyediting, typesetting, and review of the resulting proof before it is published in its final citable form. Please note that during the production process errors may be discovered which could affect the content, and all legal disclaimers that apply to the journal pertain.
References
- 1.Mielke SP, Krishnan VV. Characterization of protein secondary structure from NMR chemical shifts. Prog. Nucl. Magn. Reson. Spect. 2009;54:141–165. doi: 10.1016/j.pnmrs.2008.06.002. [DOI] [PMC free article] [PubMed] [Google Scholar]
- 2.Spera S, Bax A. Empirical Correlation between Protein Backbone Conformation and C-Alpha and C-Beta C-13 Nuclear-Magnetic-Resonance Chemical-Shifts. J. Am. Chem. Soc. 1991;113:5490–5492. [Google Scholar]
- 3.Dedios AC, Pearson JG, Oldfield E. Secondary and Tertiary Structural Effects on Protein Nmr Chemical-Shifts - an Abinitio Approach. Science. 1993;260:1491–1496. doi: 10.1126/science.8502992. [DOI] [PubMed] [Google Scholar]
- 4.Seidel K, Etzkorn M, Schneider R, Ader C, Baldus M. Comparative analysis of NMR chemical shift predictions for proteins in the solid phase. Solid State Nucl. Magn. Reson. 2009;35:235–242. doi: 10.1016/j.ssnmr.2008.12.008. [DOI] [PubMed] [Google Scholar]
- 5.Yao XL, Hong M. Determination of Ca chemical shift tensor orientation in peptides by dipolar-modulated chemical shift recoupling NMR spectroscopy. J. Am. Chem. Soc. 2002;124:2730–2738. doi: 10.1021/ja017137p. [DOI] [PubMed] [Google Scholar]
- 6.Wi S, Sun HH, Oldfield E, Hong M. Solid-state NMR and quantum chemical investigations of C-13(alpha) shielding tensor magnitudes and orientations in peptides: Determining phi and psi torsion angles. J. Am. Chem. Soc. 2005;127:6451–6458. doi: 10.1021/ja042935b. [DOI] [PubMed] [Google Scholar]
- 7.Wylie BJ, Sperling LJ, Frericks HL, Shah GJ, Franks WT, Rienstra CM. Chemical-shift anisotropy measurements of amide and carbonyl resonances in a microcrystalline protein with slow magic-angle spinning NMR spectroscopy. J. Am. Chem. Soc. 2007;129:5318–5319. doi: 10.1021/ja0701199. [DOI] [PubMed] [Google Scholar]
- 8.Wylie BJ, Franks WT, Graesser DT, Rienstra CM. Site-specific 13C chemical shift anisotropy measurements in a uniformly 15N,13C-labeled microcrystalline protein by 3D Magic-Angle Spinning NMR spectroscopy. J. Am. Chem. Soc. 2005;127:11946–11947. doi: 10.1021/ja053862e. [DOI] [PubMed] [Google Scholar]
- 9.Wylie BJ, Schwieters CD, Oldfield E, Rienstra CM. Protein structure refinement using 13Ca chemical shift tensors. J. Am. Chem. Soc. 2009;131:985–992. doi: 10.1021/ja804041p. [DOI] [PMC free article] [PubMed] [Google Scholar]
- 10.Hong M, Gross JD, Hu W, Griffin RG. Determination of the peptide torsion angle phi by N-15 chemical shift and C-13(alpha)-H-1(alpha) dipolar tensor correlation in solid-state MAS NMR. J. Magn. Reson. 1998;135:169–177. doi: 10.1006/jmre.1998.1573. [DOI] [PubMed] [Google Scholar]
- 11.Costa PR, Gross JD, Hong M, Griffin RG. Solid-state NMR measurement of Psi in peptides: a NCCN 2Q-heteronuclear local field experiment. Chemical Physics Letters. 1997;280:95–103. [Google Scholar]
- 12.Hong M, Gross JD, Griffin RG. Site-resolved determination of peptide torsion angle phi from the relative orientations of backbone N-H and C-H bonds by solid-state NMR. J. Phys. Chem. B. 1997;101:5869–5874. [Google Scholar]
- 13.Castellani F, van Rossum B, Diehl A, Schubert M, Rehbein K, Oschkinat H. Structure of a protein determined by solid-state magic-angle-spinning NMR spectroscopy. Nature. 2002;420:98–102. doi: 10.1038/nature01070. [DOI] [PubMed] [Google Scholar]
- 14.Franks WT, Wylie BJ, Schmidt HLF, Nieuwkoop AJ, Mayrhofer RM, Shah GJ, Graesser DT, Rienstra CM. Dipole tensor-based atomic-resolution structure determination of a nanocrystalline protein by solid-state NMR. Proc. Natl. Acad. Sci., USA. 2008;105:4621–4626. doi: 10.1073/pnas.0712393105. [DOI] [PMC free article] [PubMed] [Google Scholar]
- 15.Gardiennet C, Loquet A, Etzkorn M, Heise H, Baldus M, Bockmann A. Structural constraints for the Crh protein from solid-state NMR experiments. J. Bio. NMR. 2008;40:239–250. doi: 10.1007/s10858-008-9229-3. [DOI] [PMC free article] [PubMed] [Google Scholar]
- 16.Loquet A, Bardiaux B, Gardiennet C, Blanchet C, Baldus M, Nilges M, Malliavin T, Boeckmann A. 3D structure determination of the Crh protein from highly ambiguous solid-state NMR restraints. J. Am. Chem. Soc. 2008;130:3579–3589. doi: 10.1021/ja078014t. [DOI] [PubMed] [Google Scholar]
- 17.Grommek A, Meier BH, Ernst M. Distance information from proton-driven spin diffusion under MAS. Chem. Phys. Lett. 2006;427:404–409. [Google Scholar]
- 18.Crocker E, Patel AB, Eilers M, Jayaraman S, Getmanova E, Reeves PJ, Ziliox M, Khorana HG, Sheves M, Smith SO. Dipolar assisted rotational resonance NMR of tryptophan and tyrosine in rhodopsin. J. Biomol. NMR. 2004;29:11–20. doi: 10.1023/B:JNMR.0000019521.79321.3c. [DOI] [PubMed] [Google Scholar]
- 19.Lange A, Luca S, Baldus M. Structural constraints from proton-mediated rare-spin correlation spectroscopy in rotating solids. J. Am. Chem. Soc. 2002;124:9704–9705. doi: 10.1021/ja026691b. [DOI] [PubMed] [Google Scholar]
- 20.Lange A, Seidel K, Verdier L, Luca S, Baldus M. Analysis of proton-proton transfer dynamics in rotating solids and their use for 3D structure determination. J. Am. Chem. Soc. 2003;125:12640–12648. doi: 10.1021/ja034555g. [DOI] [PubMed] [Google Scholar]
- 21.De Paepe G, Lewandowski JR, Loquet A, Bockmann A, Griffin RG. Proton assisted recoupling and protein structure determination. J. Chem. Phys. 2008;129:245101. doi: 10.1063/1.3036928. [DOI] [PMC free article] [PubMed] [Google Scholar]
- 22.Lewandowski JR, De Paepe G, Eddy MT, Griffin RG. N-15-N-15 Proton Assisted Recoupling in Magic Angle Spinning NMR. J. Am. Chem. Soc. 2009;131:5769–5776. doi: 10.1021/ja806578y. [DOI] [PMC free article] [PubMed] [Google Scholar]
- 23.Heise H, Seidel K, Etzkorn M, Becker S, Baldus M. 3D NMR spectroscopy for resonance assignment and structure elucidation of proteins under MAS: novel pulse schemes and sensitivity considerations. J. Magn. Reson. 2005;173:64–74. doi: 10.1016/j.jmr.2004.11.020. [DOI] [PubMed] [Google Scholar]
- 24.Zhou DHH, Kloepper KD, Winter KA, Rienstra CM. Band-selective C-13 homonuclear 3D spectroscopy for solid proteins at high field with rotor-synchronized soft pulses. J. Bio. NMR. 2006;34:245–257. doi: 10.1007/s10858-006-0026-6. [DOI] [PubMed] [Google Scholar]
- 25.Ganz T. Defensins: Antimicrobial peptides of innate immunity. Nat. Rev. Immunol. 2003;3:710–720. doi: 10.1038/nri1180. [DOI] [PubMed] [Google Scholar]
- 26.Ganz T, Selsted ME, Szklarek D, Harwig SS, Daher K, Bainton DF, Lehrer RI. Defensins. Natural peptide antibiotics of human neutrophils. Journal of Clinical Investigation. 1985;76:1427–1435. doi: 10.1172/JCI112120. [DOI] [PMC free article] [PubMed] [Google Scholar]
- 27.Gabay JE, Scott RW, Campanelli D, Griffith J, Wilde C, Marra MN, Seeger M, Nathan CF. Antibiotic proteins of human polymorphonulear leukocytes. Proceedings of the National Academy of Sciences of the United States of America. 1989;86:5610–5614. doi: 10.1073/pnas.86.14.5610. [DOI] [PMC free article] [PubMed] [Google Scholar]
- 28.Jones DE, Bevins CL. Paneth cells of the human small intestine express an antimicrobial peptide gene. Journal of Biological Chemistry. 1992;267:23216–23225. [PubMed] [Google Scholar]
- 29.Jones DE, Bevins CL. Defensin-6 mRNA in human Paneth cells: implications for antimicrobial peptides in host defense of the human bowel. FEBS Letters. 1993;315:187–192. doi: 10.1016/0014-5793(93)81160-2. [DOI] [PubMed] [Google Scholar]
- 30.Yang D, Biragyn A, Hoover DM, Lubkowski J, Oppenheim JJ. Multiple roles of antimicrobial defensins, cathelicidins, and eosinophil-derived neurotoxin in host defense. Annu. Rev. Immunol. 2004;22:181–215. doi: 10.1146/annurev.immunol.22.012703.104603. [DOI] [PubMed] [Google Scholar]
- 31.Selsted ME, Ouellette AJ. Mammalian defensins in the antimicrobial immune response. Nature Immunol. 2005;6:551–557. doi: 10.1038/ni1206. [DOI] [PubMed] [Google Scholar]
- 32.Lehrer RI. Primate defensins. Nat. Rev. Microbiol. 2004;2:727–738. doi: 10.1038/nrmicro976. [DOI] [PubMed] [Google Scholar]
- 33.Hill CP, Yee J, Selsted ME, Eisenberg D. Crystal-structure of defensin HNP-3, an amphiphilic dimer - mechanisms of membrane permeabilization. Science. 1991;251:1481–1485. doi: 10.1126/science.2006422. [DOI] [PubMed] [Google Scholar]
- 34.Szyk A, Wu ZB, Tucker K, Yang D, Lu WY, Lubkowski J. Crystal structures of human alpha-defensins HNP4, HD5, and HD6. Protein Sci. 2006;15:2749–2760. doi: 10.1110/ps.062336606. [DOI] [PMC free article] [PubMed] [Google Scholar]
- 35.Zou GZ, de Leeuw E, Li C, Pazgier M, Li CQ, Zeng PY, Lu WY, Lubkowski J, Lu WY. Toward understanding the cationicity of defensins - Arg and Lys versus their noncoded analogs. J. Biol. Chem. 2007;282:19653–19665. doi: 10.1074/jbc.M611003200. [DOI] [PubMed] [Google Scholar]
- 36.Xie C, Prahl A, Ericksen B, Wu ZB, Zeng PY, Li XQ, Lu WY, Lubkowski J, Lu WY. Reconstruction of the conserved beta-bulge in mammalian defensins using D-amino acids. J. Biol. Chem. 2005;280:32921–32929. doi: 10.1074/jbc.M503084200. [DOI] [PubMed] [Google Scholar]
- 37.Zhang Y, Doherty T, Li J, Lu WY, Barinka C, Lubkowaki J, Hong M. Resonance Assignment and Three-Dimensional Structure Determination of a Human alpha-Defensin, HNP-1, by Solid-State NMR. 2009 doi: 10.1016/j.jmb.2010.01.030. Submitted. [DOI] [PMC free article] [PubMed] [Google Scholar]
- 38.Schwieters CD, Kuszewski JJ, Tjandra N, Clore GM. The Xplor-NIH NMR molecular structure determination package. J. Magn. Reson. 2003;160 doi: 10.1016/s1090-7807(02)00014-9. PII S1090-7807(02)00014-9. [DOI] [PubMed] [Google Scholar]
- 39.Schwieters CD, Kuszewski JJ, Clore GM. Using Xplor-NIH for NMR molecular structure determination. Prog. Nucl. Magn. Reson. Spect. 2006;48:47–62. doi: 10.1016/s1090-7807(02)00014-9. [DOI] [PubMed] [Google Scholar]
- 40.Castellani F, van Rossum BJ, Diehl A, Rehbein K, Oschkinat H. Determination of solid-state NMR structures of proteins by means of three-dimensional 15N-13C-13C dipolar correlation spectroscopy and chemical shift analysis. Biochemistry. 2003;42:11476–11483. doi: 10.1021/bi034903r. [DOI] [PubMed] [Google Scholar]
- 41.Cornilescu G, Delaglio F, Bax A. Protein backbone angle restraints from searching a database for chemical shift and sequence homology. J. Bio. NMR. 1999;13:289–302. doi: 10.1023/a:1008392405740. [DOI] [PubMed] [Google Scholar]
- 42.Ericksen B, Wu Z, Lu W, Lehrer RI. Antibacterial activity and specificity of the six human {alpha}-defensins. Antimicrobial Agents and Chemotherapy. 2005;49:269–275. doi: 10.1128/AAC.49.1.269-275.2005. [DOI] [PMC free article] [PubMed] [Google Scholar]


