

Abstract
We employ real-time PCR to allow us to quantify the sensitivity of chromatin to digestion by DNaseI. This approach has three clear advantages over the more conventional use of the Southern hybridization assay: the accuracy of quantification is improved; the resolution of the assay is enhanced, by designing primers to amplify small amplicons it is possible to analyze sequences both co-incident and proximal to sites of DNaseI-hypersensitivity; less material is needed, as little as 5 ng of treated genomic DNA. We applied this method in an analysis of the chromatin structure of the previously described mouse β-globin locus control region (LCR) using fetal liver cells. The four hypersensitive sites of the canonical mouse LCR, HS1 to HS4, are shown to have kinetics of digestion consistent with these sequences being nucleosome-free in vivo. A different pattern was seen for HS6, a recently described “weak” hypersensitive site. The site was also rapidly lost but more of the sites proved resistant, we interpreted this to show that this hypersensitive was only forming in a portion of the erythroid cells. This finding implies that in vivo the LCR is structurally heterogeneous. Sequences proximal to the hypersensitive sites show a third pattern of intermediate sensitivity, consistent with the chromatin being unfolded but the sites still bound by a continual nucleosomal array. Our results demonstrate that this method has the potential to achieve accurate and detailed mapping of chromatin structure from small amounts of tissue samples.
Keywords: DNaseI-sensitivity, globin, LCR, real-time PCR, DNaseI-hypersensitive
Introduction
DNaseI-sensitivity assays have been used to demonstrate that chromatin structure can be a dynamic determinant of the transcriptional programme.1 The bulk of the eukaryotic genomes are transcriptionally inert and occluded into tightly condensed chromatin that is insensitive to digestion by nucleases.2 Genes that are regulated in a tissue-specific or developmental-specific fashion, such as the murine proton-oncogenes c-fos and c-myc, undergo changes in general DNaseI-sensitivity that coincide with their transcriptional induction.3,4 Some sequences are extremely sensitive to digestion and are known as DNaseI-hypersensitive sites. The majority of these are gaps in the nucleosomal array that leave 200–400 bp of the underlying sequence vulnerable to digestion by DNaseI and their cognate restriction enzymes.5 Recent studies have suggested that some DNaseI-hypersensitive sites, such as that of the human ε-globin promoter, may still be bound by a nucleosome but with an altered structure.6 DNaseI-hypersensitivity is therefore a structural marker for the disruption of the regular nucleosomal array caused by the formation of specific nucleoprotein complexes by the co-operative binding of ubiquitous and tissue-specific transcription factors7,8 to exclude or modify nucleosomes. The high-density of transcription factors makes it likely that such sequences will be cis-acting regulatory elements, such as promoters and enhancers.
Clusters of hypersensitive sites can also form super-regulatory elements known as locus control regions (LCRs), which are capable of both regulating chromatin structure over large distances and enhancing transcription of a family of genes. To date, 25 LCRs have been identified in humans9 and for several of these, homologues have been found in other eukaryotes. The best studied of these is that associated with the β-globin locus which has, amongst others, a murine homologue. The human version consists of four tissue-specific DNaseI-hypersensitive sites, HS1 to HS4, within a 25 kb region upstream of the five β-globin-like genes.10–12 Proof that the LCR is necessary for directing transcription comes from two sources: naturally occurring deletions that remove the majority of the LCR, such as that giving rise to the Hispanic (γδβ)0-thalassaemic syndrome, lead to both a failure to express the intact genes and a loss of DNaseI-sensitivity in somatic hybrids containing the mutant chromosome;13,14 the presence of the LCR has been shown to be necessary for proper expression of human globin genes in transgenic mice,15 demonstrating its ability to counteract position-effect variegation.
The sequences of these four hypersensitive sites and their relative positions are highly conserved throughout the mammalian kingdom.16 However, between upstream sequences the degree of homology is not so strong17 and several of the additional DNaseI-hypersensitive sites have no homologues. Bender and colleagues recently described two “weak” sites in mouse, HS5 HS6, that so far have not been ascribed a function.18 The human HS5 is in a similar position, though it is not homologous to either of these sites, and has been shown to have chromatin insulator function.19 The characterization of such new hypersensitive sites is important, as they may be as yet uncharacterized regulatory elements, which contribute to the suggested functional differences of the two LCRs.20
The accurate quantification of conventional DNaseI-sensitivity assay is difficult. Southern hybridization assays are sensitive to many variables, such as probe choice, efficiency of transfer of the target DNA to the membrane and annealing efficiency to targets of different size. Also, the DNaseI-generated sub-band can be diffuse, and difficult to quantify, if the site of digestion is disperse. Quantitative PCR has previously been used to assess sensitivity,21 and the application of real-time PCR has the advantages of even greater accuracy and sensitivity. The double-strand DNA-specific fluorescent dye SYBR Green is used to detect the accumulation of PCR products as a function of the number of rounds of amplification. Primers are designed to separately amplify similar-sized products either from the LCR or a known DNaseI-insensitive gene, Nf-M (which is used as an internal control for the amount of template), from a series of genomic DNAs isolated from DNa-seI-treated nuclei. By reference to a standard curve, it is possible to calculate the number of amplicons destroyed as a function DNaseI concentration. These data allow an examination of the kinetics of digestion for each site and an accurate determination of the proportion of sites which proved DNaseI-insensitive. We use this approach here to investigate the chromatin structure of the murine β-globin locus.
Results and Discussion
Quantification of DNaseI-digestion by real-time PCR
Previous studies have used semi-quantitative PCR to estimate the extent of DNaseI-sensitivity in the HPRT gene of tissue culture cells.21 With the development of real-time PCR it has become possible to perform routinely more accurate and reproducible quantitative PCR. We use SYBR Green as a generic probe for double-stranded DNA and are able to detect as little as 20 % different in the number of templates present in separate samples. The approach taken was to separately amplify fragments of interest from 50 ng of DNaseI-treated DNA, and calculate the amount of template destroyed in the sample by reference to a standard curve. Primers were designed to amplify 450 bp fragments throughout the mouse β-globin LCR (Figure 1), including the DNaseI-hypersensitive sites and intervening sequences. The genomic DNA samples that were tested had been harvested from mouse fetal liver nuclei that had been treated with increasing amounts of DNaseI, in order to establish the sensitivity of their chromatin structure to digestion. Typically, 50 ng of genomic DNA was used for each reaction but it was possible to use as little as 5 ng. A serial dilution of undigested genomic DNA was also analyzed (using 0.5 ng of material as the earliest point) in order to produce a standard curve so that the number of copies of template in each of the samples could be calculated. In order to correct for small differences in the amount of DNA, the separate amplifcation of a similarly sized fragment from a known DNaseI-insensitive gene, Nf-M,22 was used as an internal control for the amount of DNA present in the reaction. A Southern hybridization assay confirmed that there was no detectable digestion of this gene under the conditions used (date not shown).
Figure 1.
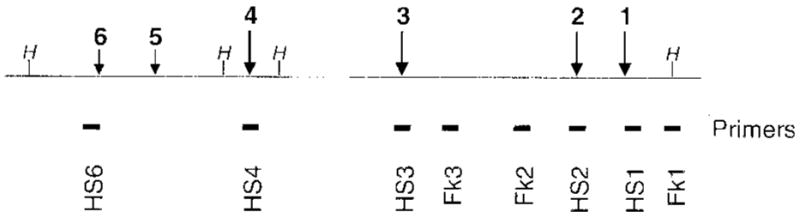
Map of the LCR of the murine β-globin locus. DNaseI-hypersensitive sites are shown by vertical arrows, the estimated strengths which are represented by their relative thickness and length. The position of restriction sites for HpaI are marked as a vertical line topped with an H. The names and positions of the amplicons that the real-time primers are designed to amplify are shown. The letters HS designate the hypersensitive sites and Fk the flanking sequences.
Chromatograms from the Roche Molecular Biochemical’s Lightcycler Instrument are shown in Figure 2 for the amplification of (a) Nf-M and (b) HS2. Each experiment contains reactions to calculate a standard curve (using 0.5, 5 and 50 ng of untreated genomic DNA), 50 ng of samples from each of the digestion points of the DNaseI series (using 0.25, 0.5, 1, 2, 4 and 8 units of enzyme) and a negative control with water added instead of template DNA. The machine measures the gain in fluorescence due to the proportional binding of SYBR Green to the PCR product, and plots the log of this value as a function of cycle number. The more copies of amplicon present in the sample, the fewer cycles of PCR will be needed to achieve a threshold value of fluorescence (indicated by the horizontal green line and set to include the first values above background). T his number of cycles, the CT value, is calculated by extrapolation from the linear part of the curve (identified by the two grey crosses) where amplification is exponential and plots the intercept with the threshold line, represented by the red crosses. Hence, the data used to generate the standard curve for each experiment (the intercept is identified with the amount of template used) show a regular increase in the CT value as the amount of template is decreased by a factor of 10. A plot of the log of concentration of template against CT value generates a straight line that is used to calculate the percentage of remaining amplicons in the DNAseI-digested samples (Figure 3(c)).
Figure 2.
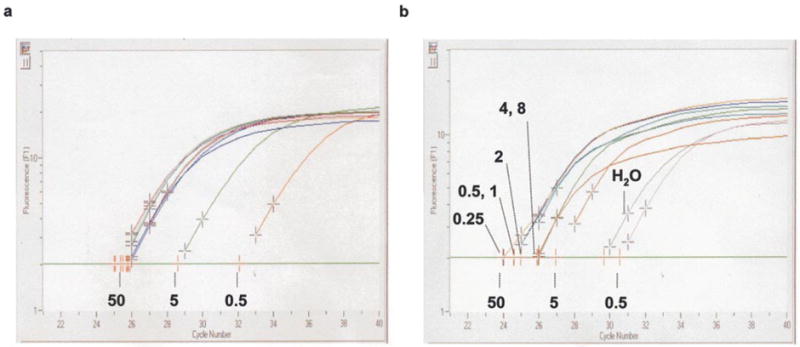
DNaseI-sensitivity of Nf-M and HS2 in mouse fetal liver. Chromatograms were generated on the Lightcycler system (Roche) following real-time quantitative PCR experiments performed on a series of genomic DNAs isolated from DNaseI-digested fetal liver nuclei amplifying (a) Nf-M and (b) HS2. Each panel shows the progress of the PCR reactions plotted as a gain in fluorescence (on a logarithmic scale), due to the binding of the dsDNA-specific SYBR Green dye to the PCR product, as a function of the number of cycles. Analysis using the manufacturer’s software extrapolates from that part of the curve (using the grey crosses) where amplification is exponential to determine the number of cycles of PCR after which the fluorescent signal reached a threshold value (green line). The position of the intercepts from the standard curve samples are labeled with the amount of template used (ng), and the standard curves generated are plotted in Figure 3(c). The other intercepts are from DNaseI-digested samples, and the units of DNaseI used in the digestion labeled in (b). It is evident from (a) that there was no digestion of the Nf-M amplicon, as these intercepts are clustered around that of 50 ng. (b) The intercepts for HS2 are more widely distributed between that of 50 and 5. Both experiments contained a negative control (amplification with no template) and a signal is gained from this reaction in (b), marked H2O. Analysis confirmed that this signal was due to primer-dimers formed in the absence of template DNA (Figure 3(a) and (b)). The calculated DNaseI-digestion profile of HS2 is shown in Figure 4.
Figure 3.

Analysis of the specificity and sensitivity of real-time PCR with SYBR Green. (a) Melting curve analysis of the PCR products generated in Figure 2. Following the final step of amplification, the samples were melted by increasing the temperature slowly to 95 °C and monitoring the fluorescent signal continually. The rate of change of fluorescence is shown as a function of temperature. Two major peaks occur, centred at 84 °C and 88 °C, due to the melting of the HS2 and Nf-M PCR products, respectively. The smaller peak at 79 °C, marked H2O, is derived from the negative control run in Figure 3(b). These results are consistent with the primer pairs amplifying a single product from template DNA and the HS2 pair less stable primer-dimers in the absence of template. (b) Agarose gel electrophoresis of the PCR products of Nf-M, HS2 and the negative control. Single bands of the same size (450 bp) are evident for the template-dependent PCRs, whereas for the negative control no single band is seen. (c) Standard curves generated from Figure 2 for (□) HS2 and (◆) Nf-M. The data generated are linear over a range of 0.5 to 50 ng of template.
In Figure 2(a), all of the DNaseI-treated samples have CT values close to that of the value for 50 ng of untreated DNA, consistent with none of the amplicons being lost due to digestion by DNaseI. The pattern for HS2 is different. Less and less amplicons remain intact as increasing amounts of DNaseI were used to treat the samples. This is consistent with the HS2 site being destroyed preferentially by DNaseI digestion.
In order to confirm that the signals recorded were due to the amplification of the desired product, melting curve analysis (Figure 3(a)) and agarose gel electrophoresis (Figure 3(b)) were performed. Melting curve analysis denatures the PCR product after the final step of PCR by raising the temperature and continually monitors the dissociation of DNA strands by measuring the loss of fluorescent signal. The melting curve for each of the PCR products consisted of a single peak (centred at 84 °C and 88 °C, representing the HS2 and Nf-M products, respectively) consistent with the presence of a single species of product. The positive signal for water recorded in the HS2 experiment is shown to have a much lower melting temperature than that of the HS2 product (79 °C), suggesting that these products are non-specific primer-dimers. Agarose gel electrophoresis of samples recovered from the experiments confirmed this, the products of Nf-M and HS2 were single bands of 450 bp, which was not evident in the HS2 negative control.
The digestion profile can be seen by plotting the percentage of copies of HS2 remaining, corrected for DNA content, against the number of units of DNaseI used in the digestion of nuclei (Figure 4). Two general features of the curve are apparent; the initial rate of loss of copies is very fast and the curve reaches a plateau, representing the number of sites that are not accessible to digestion. The first property is an indication of the level of sensitivity of the site to digestion (a less accessible site would be expected to digest more slowly, leading to a slower rate). Whilst the second establishes the proportion of material that remains inaccessible, due to the cells being derived from the non-erythroid compartment of the tissues where the hypersensitive site does not form.
Figure 4.

A plot of the DNaseI-digestion of fetal liver HS2. The standard curves in Figure 3(c) were used to calculate the percentage of copies of the HS2 amplicon remaining in 50 ng of DNaseI-treated genomic DNA. The amount of template DNA was standardized by correcting for amplification of the DNaseI-insensitive Nf-M sequence.
Comparison of digestion profiles
The experiments were repeated using the primer pairs spanning the LCR region and their digestion profiles are shown in Figure 5. It can be seen that there are four distinct types of profiles. The simplest is that of Nf-M (Figure 5(a)), which under these conditions remains undigested so that there are no copies of the amplicon lost. If the amount of nuclease used was steadily increased, then these Nf-M sites would eventually be destroyed. In contrast to this profile, the primers directed towards the DNaseI-hypersensitive sites (HS1, HS2, HS3 and HS4) show rapid loss of copy number to a stable number (Figure 5(a)). As discussed previously, it is believed that this represents the rapid loss of accessible sites and the persistence of inaccessible sites. The sites are most likely inaccessible as the formation of DNaseI-hypersensitivity is erythroid-dependent and the fetal liver will be composed of approximately 20 % non-erythroid cells at the time of harvest (12.5 dpc).
Figure 5.

Plots of the DNaseI-digestion profiles of amplicons throughout the mouse β-globin LCR. The plots were generated as described in the legend to Figure 4. The primer pairs used were those shown in Figure 1; (a) Nf-M and the DNaseI-hypersensitive sites HS1 to HS4 and (b) the flanking sequences Fk1 to Fk3 and the “weak” HS6.
The profiles of the intervening sequences (Fk1–3) are all similar and are plotted in a shaded compartment of Figure 5(b). They show a less steep rate of loss of copy number than with the hypersensitive sites and the curve plateaus later and at a higher level. The final profile recorded is that of the weak DNaseI-hypersensitive HS6 (Figure 5(b)); the rate of loss is similar to that of the other hypersensitive sites and it reaches a plateau early, but it is at a higher level. All four types of profile are plotted together in Figure 6.
Figure 6.

A plot of all the DNaseI-digestion profiles generated in this study. Four distinct classes of profiles are evident and are labeled as described in the text.
The two properties of these profiles, rate of digestion and proportion of insensitive material, can be interpreted to reveal the underlying structure of the chromatin. A fast rate of digestion is consistent with the site being extremely accessible in the nuclei to digestion, as is expected to occur at a hypersensitive site where the nucleosomal array is interrupted or altered to expose the DNA and allow the DNaseI enzyme free access to cut. As shown in Figure 7(a) the enzyme can independently cut twice to completely destroy the site. A slower rate of digestion is presumably caused by the site being blocked in vivo creating competition with DNaseI for access to the site (Figure 7(b)). If cutting does occur here it may be more likely to be a single-stranded nick. This will be detected by quantitative PCR (as 50 % of the template has been destroyed) but would not be detected in a Southern hybridization assay (as the nicked molecule would migrate through the gel as a duplex). In the case of the inaccessible site, the nucleosome does not have a fast on-and-off rate, as it is a tightly folded part of the chromatin fibre, and it effectively blocks access for DNaseI (Figure 7(c)).
Figure 7.

A diagram to account for how DNaseI probes accessibility. The consequence of competition between DNaseI (shown as a filled circle) and a nucleosome (an open oval) for the extent of restriction of a molecule of duplex DNA in the case of (a) naked DNA, (b) partially bound and (c) covered DNA.
This interpretation would led to the conclusion that the hypersensitive sites HS1 to HS4 are DNa-seI-hypersensitive in the vast majority of erythroid tissue. The intervening sequences are part of an “open” nucleosomal array, where nucleosomes compete with DNaseI for access to underlying sequences. As the nuclease will only nick the DNA, the high plateau reached in their profiles does not represent a higher proportion of entirely inaccessible sequences but all the sites in erythroid tissues receiving a single cut. These interpretations allow us to determine the structure of HS6. The relative weakness of this site could be due to either it forming in only half of the erythroid cells or forming in all the erythroid cells but there being competition for access to the site. The data presented here demonstrate that the former conclusion is correct; crucially, the site is degraded rapidly, consistent with it not being covered, implying that the higher plateau truly represents a greater proportion of inaccessible sites.
The structure of the mouse β-globin LCR
The data presented here establish that the DNa-seI-hypersensitive sites HS1 to HS4 are formed in all the erythroid cells of mouse fetal liver. This is an important observation, as it was possible that individual sites may have formed with different efficiencies. If such were the case it would imply that the canonical LCR in erythroid tissue could be functionally heterogeneous, as transgenic studies that delete individual hypersensitive sites from the human β-globin locus show that these deleted LCRs sponsor altered transcriptional programmes.23,24 In order to address the question of whether the hypersensitive sites form independently or co-operatively, it would be necessary to use a system where the sites form sub-optimally. The approach that we are taking is to study transgenic mice carrying a deletion of one of the DNaseI-hypersensitive sites. In this system the level of expression is lower and not all hypersensitive sites form. We are also using this improved method to determine whether the hypersensitive sites of the human β-globin LCR form full in an homogeneous population of cells, the human erythroid cell line K562. If so, key hypersensitive sites could be detected as markers for certain cell types in a heterogeneous population. If they do not form fully, the question will then arise as to whether some cells lack all four sites and, if so, whether these transcribe the associated β-globin genes.
Two features of DNaseI-hypersensitive sites are the extreme susceptibility to digestion and the constant position of the cut (hence the appearance of sub-bands in Southern gels). An interpretation consistent with these observations is that the hypersentivie sites occur within non-covered patches of DNA of the nucleoprotein complex. This implies that the rate of digestion would be the same between different hypersensitive sites, as the enzyme would be cutting naked DNA in each. The data presented here test this hypothesis directly and show it to be true; the rate of digestion is the same for sites HS1 to HS4. We also detected this signature property of rapid digestion for a smaller portion of the HS6 sites and interpreted this as showing that this hypersensitive site forms in approximately half of the erythroid tissue. This implies that the canonical LCR is structurally heterogeneous in vivo. However, it is not known whether this structural heterogeneity will have any functional consequences, as initial studies have yet to define any cis-acting regulatory role to HS6.18
Our study also allowed the investigation of the chromatin structure of sequences between the DNaseI-hypersensitive sites. The digestion profiles of these sequences was different from that of the hypersensitive sites, suggesting that the functional LCR could be imagined as being covered by an “open” nucleosomal array studded with gaps corresponding to the appearance of the hypersensitive sites. The formation of such gaps would be predicted to alter local chromatin structure, as folding of the chromatin fibre involves nucleosome-nucleosome contact. This localized loosening of chromatin structure may play a role in domain-wide alterations associated with LCR activity. The increase in accessibility of sequences in the LCR may allow binding of histone acetyl-transferases or chromatin-modifying complexes25 capable of propagating the chromatin-opening activity.
Materials and Methods
DNaseI-digestion of mouse fetal liver
Tweny foetal livers were harvested from 11.5–12.5 dpc mouse embryos, they were pooled and dispersed in a loose-fitting homogenizer in 5 ml of buffer A (15 mM Tris HCl (pH 7.6), 60 mM KCl, 15 mM NaCl, 1 mM EDTA, 0.5 mM EGTA, 0.5 mM spermidine, 0.15 mM sperminine). Cells were lysed in the presence of 0.5 % (v/v) NP40, and nuclei were collected and resuspended in digestion buffer (buffer A supplemented with 3 mM CaCl2, 75 mM NaCl) at a concentration of 800 ng/ml chromatin. Digestions were carried out at 37 °C with 0.25–8 units of DNaseI (Sigma) for three minutes before being stopped by the addition of an equal volume of stop buffer (0.1 M NaCl, 0.1 % (w/v) SDS, 50 mM Tris-HCl (pH 8.0), 100 mM EDTA). The samples were treated with proteinase K overnight and DNA recovered after extraction with phenol/chloroform and precipitation in ethanol. The DNA was then dialysed against two changes of TE buffer (10 mM Tris-HCl (pH 8.0), 1 mM EDTA), re-precipitated and diluted in water to a concentration of 50 ng/μl as measured by DNA fluormetry.
DNaseI-sensitivity studies
Real-time quantitative PCR was performed on the DNA samples using the Roche Molecular Biochemical’s Lightcycler system. PCR reactions were performed using the manufacturer’s SYBR Green master kit optimized for use with the following primer pairs (see Figure 1 for the positions of the amplicons within the β-globin LCR; the co-ordinates of the sequence of the amplified fragment and the GI accession number of the sequence file are shown): HS1f, 5′-AGA TTA TAT TGC CAT GGT ACA CTT GAA-3′ and HS1r, 5′-ACT GGA CCA ATT TTC TCC CTC C-3′ (2971–3441; GI: 50150); Fk1f, 5′-GGC TTT TGA GGC AAC ACT AT-3′ and Fk1r, 5′-CAT TGG CAG AAA GCT CTC ATA CA-3′ (5709–6179; GI: 50150); Fk2F5′-GGA TTT TAC TAT ATA ACT ATG CTA TCA-3′ and Fk2r 5′-AGA AAG TAA GGG ATCACG TGT AAT ACA AC-3′ (11130–11601; GI: 50150); HS2f, 5′-AGT GTC AGC ATA TTA CCG-ATG-TTC C-3′ and HS2r, 5′-CAC ACA GCA AGG CAG GGT C-3′ (11767–12237; GI: 50150) HS3f, 5′-TGT AAG TGT AAA TTT TGG AGC ACA GG-3′ and HS3r, 5′-CTG AAA GAC TAA AGT TCC CGG C-3′ (5639–6119; 50515); Fk3 5′-GTA CCA TGT GTT TGT GTG AAG TAG A-3′ and Fk3r 5′-TTT TTG AGG ATT TCC ATC AGC AT-3′ (7423–7943; GI: 505150; HS4f, 5′-TGT TTG TGG TTT TTC TGT TGT ATG TTT-3′ and HS4r, 5′-AAG AGC AGA AAG GAA TTA AAT ACA CAC A-3′ (62758–63257; GI: 11908223); HS6f, 5′-CAG AGC ATT GTT GAA AGA TGA GGA-3′ and HS6r, 5′-GGG TTA GCA GAA ATG TAG AGC TCC-3′ (57283–577733; GI: 11908223); Nf-Mf5′-GCT GGG TGA TGC TTA CGA CC-3′ and Nf-Mr, 5′-GCG GCA TTT GAA CCA CTC TT-3′ (988–1438; GI: 53357). PCR was performed using the FastStart DNA SYBR Green kit (Roche) as per the manufacturer’s instructions. The reactions were performed in a volume of 10 μl with 0.5, 5 and 50 ng of genomic DNAs isolated from the mouse erythroleukemia line (MEL) in order to prepare standard curves for each of the amplicons, or 50 ng of sample from each DNaseI-digestion point. The number of copies of target remaining intact, corrected for the size of the fragment, was calculated by reference to the standard curve. These data were then plotted versus the units of DNaseI used to digest the nuclei.
Abbreviations used
- LCR
locus control region
- dpc
days post conception
References
- 1.Felsenfeld G. Chromatin as an essential part of transcriptionally active genes. Nature. 1992;355:219–224. doi: 10.1038/355219a0. [DOI] [PubMed] [Google Scholar]
- 2.Sperling K, Kerem BS, Goitein R, Kottusch V, Cedar H, Marcus M. DNaseI sensitivity in faculative and constituitive heterochromatin. Chromosoma. 1985;93:38–42. doi: 10.1007/BF01259444. [DOI] [PubMed] [Google Scholar]
- 3.Chen TA, Allfrey VG. Rapid and reversible changes in the nucleosome structure accompany the activation, repression and superinduction of the murine proto-oncogenes c-fos and c-myc. Proc Natl Acad Sci USA. 1987;84:5252–5256. doi: 10.1073/pnas.84.15.5252. [DOI] [PMC free article] [PubMed] [Google Scholar]
- 4.Chen TA, Sterner R, Cozzolino A, Allfrey VG. Reversible and irreversible changes in nucleosomal structure along the c-fos and c-myc oncogenes following inhibition of transcription. J Mol Biol. 1990;212:481–493. doi: 10.1016/0022-2836(90)90327-I. [DOI] [PubMed] [Google Scholar]
- 5.Elgin SCR. The formation and function of DNaseI hypersensitive sites in the process of gene activation. J Biol Chem. 1988;263:19259–19262. [PubMed] [Google Scholar]
- 6.Gui CY, Dean A. Acetylation of a specific promoter nucleosome accompanies activation of the epsilon-globin gene by the beta-globin locus control region. Mol Cell Biol. 2001;21:1155–1163. doi: 10.1128/MCB.21.4.1155-1163.2001. [DOI] [PMC free article] [PubMed] [Google Scholar]
- 7.Stamatoyannopoulos JA, Goodwin A, Joyce T, Lowrey CH. NF-E2 and GATA binding motifs are required for the formation of DNaseI-hypersensitive site 4 of the human beta-globin locus control region. EMBO J. 1995;14:106–116. doi: 10.1002/j.1460-2075.1995.tb06980.x. [DOI] [PMC free article] [PubMed] [Google Scholar]
- 8.Adams CC, Workman JL. Binding of disparate transcriptional activators to nucleosomal DNA is inherently cooperative. Mol Cell Biol. 1995;15:1405–1421. doi: 10.1128/mcb.15.3.1405. [DOI] [PMC free article] [PubMed] [Google Scholar]
- 9.Li Q, Haru S, Peterson KR. Locus control regions: coming of age at a decade plus. Trends Genet. 1999;15:403–408. doi: 10.1016/s0168-9525(99)01780-1. [DOI] [PubMed] [Google Scholar]
- 10.Tuan D, Solomon W, Li Q, London M. The β-like globin gene domain in human eruthroid cells. Proc Natl Acad Sci USA. 1985;82:6384–6388. doi: 10.1073/pnas.82.19.6384. [DOI] [PMC free article] [PubMed] [Google Scholar]
- 11.Forrester WC, Thompson C, Elder JT, Groudine M. A developmentally stable chromatin structure in the human β-globin gene cluster. Proc Natl Acad Sci USA. 1986;83:1359–1363. doi: 10.1073/pnas.83.5.1359. [DOI] [PMC free article] [PubMed] [Google Scholar]
- 12.Forrester W, Takagawa S, Papayannopoulou T, Stamatoyannoponlos G, Groudine M. Evidence for a locus activation regions: the formation of developmentally stable hypersensitive sites in globin-expressing hybrids. Nucl Acids Res. 1987;15:10159–10177. doi: 10.1093/nar/15.24.10159. [DOI] [PMC free article] [PubMed] [Google Scholar]
- 13.Driscoll MC, Dobkin CS, Alter BP. γδβ-Thalassemia due to a de novo mutation deleting the 5′ β-globin gene activation-region hypersensitive sites. Proc Natl Acad Sci USA. 1989;86:7470–7474. doi: 10.1073/pnas.86.19.7470. [DOI] [PMC free article] [PubMed] [Google Scholar]
- 14.Forrester WC, Epner E, Driscoll MC, Enver T, Brice M, Papayannopoulou T, Groudine M. A deletion of the human β-globin locus activation region causes a major alteration in chromatin structure and replication across the entire β-globin locus. Genes Dev. 1990;4:1637–1649. doi: 10.1101/gad.4.10.1637. [DOI] [PubMed] [Google Scholar]
- 15.Grosveld F, van Assendelft GB, Greaves DR, Kollias G. Position-independent, high level expression of the human β-globin gene in transgenic mice. Cell. 1987;51:975–985. doi: 10.1016/0092-8674(87)90584-8. [DOI] [PubMed] [Google Scholar]
- 16.Hardison R, Slightom JL, Gumucio DL, Goodman M, Stojanovic N, Miller W. Locus control regions of mammalian beta-globin gene clusters: combining phylogenetic analyses and experimental results to gain functional insights. Gene. 1997;205:73–94. doi: 10.1016/s0378-1119(97)00474-5. [DOI] [PubMed] [Google Scholar]
- 17.Bulger M, von Doorninek JH, Saitoh N, Telling A, Farrell C, Bender MA, et al. Conservation of sequence and structure flanking the mouse and human β-globin loci: β-globin genes are embedded within an array of odorant receptor genes. Proc Natl Acad Sci USA. 1999;96:5129–5134. doi: 10.1073/pnas.96.9.5129. [DOI] [PMC free article] [PubMed] [Google Scholar]
- 18.Bender MA, Reik A, Close J, Telling A, Epner E, Fiering S, et al. Description and targeted deletion of 5′ hypersensitive site 5 and 6 of the mouse β-globin locus control regions. Blood. 1998;92:4394–4403. [PubMed] [Google Scholar]
- 19.Li Q, Stamatoyannopoulos G. Hypersensitive site 5 of the human beta-globin locus control region functions as a chromatin insulator. Blood. 1994;84:1399–1401. [PubMed] [Google Scholar]
- 20.Higgs DR. Do LCRs open chromatin domains? Cell. 1998;95:299–302. doi: 10.1016/s0092-8674(00)81761-4. [DOI] [PubMed] [Google Scholar]
- 21.Pikaart M, Feng J, Villponteau B. The polyomavirus enhancer activates chromatin accessibility on integration into the HPRT gene. Mol Cell Biol. 1992;12:5785–5792. doi: 10.1128/mcb.12.12.5785. [DOI] [PMC free article] [PubMed] [Google Scholar]
- 22.Gribnau J, Didrech K, Pruzina S, Calzolari R, Fraser P. Intergenic transcription and developmental remodelling of chromatin subdomains in the human β-globin locus. Mol Cell. 2000;5:377–386. doi: 10.1016/s1097-2765(00)80432-3. [DOI] [PubMed] [Google Scholar]
- 23.Peterson KR, Clegg CH, Navas PA, Norton EJ, Kimbrough TG, Stamatoyannopoulos G. Effect of deletion of 5′HS3 or 5′HS2 of the human beta-globin locus control region on the developmental regulation of globin gene expression in beta-globin locus yeast artificial chromosome transgenic mice. Proc Natl Acad Sci USA. 1996;93:6605–6609. doi: 10.1073/pnas.93.13.6605. [DOI] [PMC free article] [PubMed] [Google Scholar]
- 24.Navas PA, Peterson KR, Li Q, Skarpidi E, Rohde A, Shaw SE, et al. Developmental specificity of the interaction between the locus control region and embryonic or fetal globin genes in transgenic mice with an HS3 core deletion. Mol Cell Biol. 1998;18:4188–4196. doi: 10.1128/mcb.18.7.4188. [DOI] [PMC free article] [PubMed] [Google Scholar]
- 25.Travers A. Chromatin modification by DNA tracking. Proc Natl Acad Sci USA. 1999;93:13634–13637. doi: 10.1073/pnas.96.24.13634. [DOI] [PMC free article] [PubMed] [Google Scholar]