

Abstract
Background
Inflammatory demyelination and axon damage in the corpus callosum are prominent features of multiple sclerosis (MS) and may partially account for impaired performance on complex tasks.
Objective
To characterize quantitative callosal MRI abnormalities and their association with disability.
Methods
In 69 participants with MS and 29 healthy volunteers, lesional and extralesional callosal MRI indices were estimated via diffusion tensor tractography. Expanded disability status scale (EDSS) and MS functional composite (MSFC) scores were recorded in 53 of the participants with MS.
Results
All tested callosal MRI indices were diffusely abnormal in MS. EDSS score was correlated only with age (r=0.51). Scores on the overall MSFC and its paced serial auditory addition test (PASAT) and 9-hole peg test components were correlated with callosal fractional anisotropy (r=0.27, 0.35, 0.31, respectively) and perpendicular diffusivity (r=−0.29, −0.30, and −0.31) but not with overall callosal volume or callosal lesion volume; the PASAT score was more weakly correlated with callosal magnetization-transfer ratio (r=0.21). Anterior callosal abnormalities were associated with impaired PASAT performance and posterior abnormalities with slow performance on the 9-hole peg test.
Conclusion
Abnormalities in the corpus callosum can be assessed with quantitative MRI and are associated with cognitive and complex upper-extremity dysfunction in MS.
Search terms: multiple sclerosis, magnetic resonance imaging, diffusion tensor imaging, magnetization transfer imaging, corpus callosum, cognition
INTRODUCTION
The corpus callosum is the largest fiber tract in the brain, forms the major connection between the two cerebral hemispheres, and is involved in the performance of complex tasks [1]. It is abnormal in most cases of multiple sclerosis (MS) [2], where it has been shown to be involved in functions such as cognition and sensory integration [3].
Cognitive dysfunction in MS affects approximately 50% of patients [4] and is characterized by attention deficits, memory decline, slowed information processing, and impaired executive skills and visual-spatial abilities. Although highly relevant to patient well-being, cognitive deficits are often subtle, can fluctuate over time, and may be overlooked during routine clinical evaluation. Consequently, reliable surrogate markers of cognitive dysfunction are necessary both for routine care and as outcome measures in clinical trials. Compared to healthy volunteers, cognitively impaired individuals with MS have lower scores on the paced auditory serial addition test (PASAT) [5], a commonly used test of attention and working memory in MS [6]. Demyelinating lesions, diffuse tissue damage, and neural connectivity abnormalities within white matter have been related to cognitive decline in MS, and these findings are particularly prominent in the corpus callosum [7–9].
Although arm strength is relatively preserved in MS [10], weakness can result from damage to motor tracts in the brain and spinal cord. Successful performance of the 9-hole peg test, which measures the time taken to fill and empty a pegboard with each hand, requires both strength and dexterity. Previous work has demonstrated that pathways connecting the supplementary motor areas, which traverse the central portion of the corpus callosum, may play a role [11].
From an imaging point of view, the corpus callosum is an excellent structure in which to evaluate injury to the normal appearing white matter -- areas of white matter that do not harbor discrete lesions on conventional MRI but that are abnormal on quantitative imaging studies [12, 13]. This is due to high fiber-orientation coherence and reasonably well-defined rostral and caudal borders, features that limit inadvertent mixing of different tissue types. Moreover, callosal atrophy correlates with functional impairment of interhemispheric transfer [14] and may reflect Wallerian degeneration due to remote tissue damage.
Diffusion tensor imaging (DTI) [15] has been widely used in MS and enables noninvasive evaluation of white matter in diseases in which myelin and/or axon integrity is disrupted [12, 13, 16–18]. Indices derived from DTI are sensitive to macroscopic and microscopic tissue disruption and appear to have higher specificity for the more destructive aspects of MS pathology than conventional imaging [19]. DTI with fiber tractography [20] is a valuable technique for delineating the approximate anatomy of individual white matter tracts within the brain and works particularly well in highly coherent fiber bundles such as the corpus callosum. DTI can identify abnormal values of MRI indices in specific white-matter tracts that may underlie clinical disability in MS, and the integration of information derived from other imaging sequences (such as magnetization-transfer imaging, which is particularly sensitive to myelin integrity) can increase the pathologic specificity of those abnormalities [21].
This paper focuses on the association between callosal damage, assessed by quantitative MRI in a diverse MS cohort, and scores on standard disability scales including the expanded disability status scale (EDSS) [22] and multiple sclerosis functional composite (MSFC) [23]. We expected to find that callosal damage is more strongly and specifically associated with tests of cognition and praxis than with more automatic behaviors such as walking.
PATIENTS AND METHODS
Cohort and setting
The study group consisted of 29 healthy volunteers and 69 participants with MS; demographics are provided in Table 1. Participants with MS were recruited form the Johns Hopkins MS Center and healthy volunteers from a variety of sources. The diagnosis of MS was made by the treating physician according to the McDonald criteria [24], and prospective participants were excluded if they had additional diagnoses that could confound MRI interpretation. MRI scans were performed at least once per year and more frequently in selected cases. We did not select participants based on therapy, and only a small fraction of the participants were undergoing relapses at the time of scanning. Study data were collected over a nearly 5-year period, between March, 2004, and January, 2009. (Note that despite several upgrades to the scanner during this period, we did not detect gross changes in callosal MRI indices with time: p-values for the regression of MRI index on scan date were all > 0.05.) Clinical data were collected at the Johns Hopkins University and scans at the F. M. Kirby Research Center for Functional Brain Imaging at the affiliated Kennedy Krieger Institute.
Table 1.
Cohort characteristics at baseline.
| all MS | RRMS | SPMS | PPMS | healthy volunteers | |
|---|---|---|---|---|---|
| total # of participants | 69 | 35 | 20 | 14 | 29 |
| # female | 45 (65%) | 24 (69%) | 13 (65%) | 8 (57) | 19 (66%) |
| mean age in years (range) | 45 (22–66) | 40 (22–58) | 51 (40–66) | 50 (29–66) | 34 (22–63) |
| mean disease duration in years (range) | 10 (0–42) | 6 (0–22) | 19 (4–37) | 8 (1–42) | |
| mean scans per participant | 3.3 | 3.5 | 3.2 | 3 | 1.6 |
| # of participants with disability scores | 53 | 28 | 13 | 12 | |
| # female | 33 (62%) | 18 (64%) | 7 (54%) | 8 (67%) | |
| mean age in years (range) | 46 (22–66) | 40 (22–58) | 52 (44–62) | 53 (39–66) | |
| mean disease duration in years (range) | 11 (0–42) | 7 (0–22) | 20 (4–35) | 9 (1–42) | |
| mean scans per participant | 2.2 | 2.4 | 2 | 2 | |
| EDSS median score (range) | 3.5 (0–7) | 3 (0–6) | 6.5 (3.5–7) | 3.5 (1.5–6.5) | |
| MSFC mean z-score (standard deviation) | −0.4 (1.6) | 0.2 (0.7) | −1.7 (2.5) | −0.1 (0.8) | |
| median 25-foot walk time, sec (interquartile range) | 4.8 (4.0–6.3) | 4.4 (3.9–5.1) | 7.9 (4.6–27) | 5.5 (4.4–7.6) | |
| median 9-hole peg time, sec (interquartile range) | 24 (20–29) | 21 (19–24) | 30 (26–41) | 24 (23–31) | |
| median PASAT-3 score, max=60 (interquartile range) | 46 (34–54) | 49 (36–55) | 38 (30–54) | 49 (36–56) | |
| # cognitively impaired (PASAT-3 score ≤32) | 11 (21%) | 5 (18%) | 4 (31%) | 2 (17%) |
Abbreviations. RRMS, relapsing remitting multiple sclerosis. SPMS, secondary progressive multiple sclerosis. PPMS, primary progressive multiple sclerosis. EDSS, expanded disability status scale. MSFC, multiple sclerosis functional composite. PASAT-3, paced auditory serial-addition test, 3 second version.
Standard protocol approvals, registrations, and patient consents
Written, informed consent was obtained from all participants. Protocols were approved by the Institutional Review Boards at the two study institutions.
Disability scores
All available data were used to compare the MS and healthy-volunteer groups. In a subset of 53 participants with MS, the MSFC [23] -- consisting of the PASAT-3, a timed 25-foot walk, and a timed 9-hole peg test -- and the EDSS [22] were performed within 30 days of several of the MRI scans (mean ± standard deviation: 1.3 ± 2.1 days). We used the protocol prescribed in the National Multiple Sclerosis Society’s MSFC Administration and Scoring Manual [25] to administer the individual MSFC components and to calculate the final MSFC z-score based on the averages and standard deviations of test scores measured at baseline. By convention, the signs of the z-scores were assigned so that lower z-scores correspond to worse disability. On the PASAT-3, scores of 32 correct (out of 60 possible points) or less were taken as evidence of cognitive dysfunction [26]. (Although scores between 32 and 35 are considered abnormal in individuals with more than 12 years of education, data on education level were not available in our cohort, so we adopted the more conservative threshold.) Disability scores were not measured for healthy volunteers.
MRI
Details of our MRI acquisition protocol have been described [27]. Briefly, on a single 3-Tesla Philips Intera scanner, we obtained the following axial, whole-brain sequences using (for reception) either a 6-channel head coil or the 8 head elements of a 16-channel neurovascular coil: DTI (acquired resolution: 2.2 × 2.2 × 2.2 mm; TE: 69 ms; TR: automatically calculated; SENSE factor: 2.5; diffusion directions: 32; b-value: 700 s/mm2; averages: 2); magnetization transfer (acquired resolution: 1.5 × 1.5 × 2.2 mm; TE: 15 ms; TR: 64 ms; SENSE factor: 2; MT pulse: sinc-shaped, 1.5 kHz off-resonance; averages: 3); fluid-attenuated inversion recovery (FLAIR; acquired resolution: 0.8 × 0.8 × 2.2 or 4.4; TE: 68 ms; TR: 11 s; TI: 2.8 s; SENSE factor: 2; averages: 1); and 3D magnetization-prepared rapid gradient echo (MPRAGE; acquired resolution: 1.1 × 1.1 × 1.1 mm; TE: 6 ms; TR: ~10 ms; flip angle: 8 deg; SENSE factor: 2; averages: 1). We coregistered the diffusion-weighted and magnetization-transfer scans to the minimally diffusion-weighted scan from the first DTI sequence using a rigid-body transformation implemented in the Automatic Image Registration program [28].
Tract reconstruction
We used the DTI data and the fiber assignment by continuous tractography method [20] to reconstruct the central portion of the corpus callosum in each participant. Within DtiStudio [29], regions of interest were placed over the corpus callosum in the midline and, in separate steps, at the right- and left-lateral borders of the lateral ventricles as visualized on sagittal and coronal reconstructions of the DTI color maps (Figure 1). Reconstructed tracts were terminated when fractional anisotropy (FA), an index of fiber-orientation coherence [30], fell below 0.13, or when the turning angle from one voxel to the next was more than 30 degrees. Note that this FA threshold is well below typical callosal FA values, even in participants with MS (see Results). Fibers that ran between the midline and either of the lateral borders were combined for further analysis.
Figure 1. Tractography of the corpus callosum.
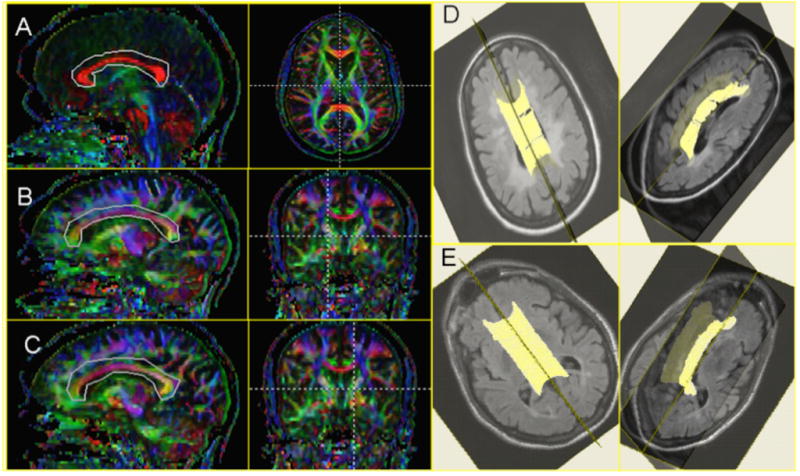
Regions of interest used for diffusion-tensor-imaging-based tractography were drawn around the corpus callosum on mid-sagittal reformations of the axially acquired data (A) and at the level of the right (B) and left (C) lateral borders of the lateral ventricles. Only the portions of the fibers that traversed these regions of interest were further analyzed. Three-dimensional views of the reconstructed corpus callosum overlaid on FLAIR images in (D) a 36-year-old woman with primary-progressive MS and marked cognitive dysfunction (PASAT-3 score: 27 out of a possible 60) and (E) a 52-year-old man with secondary-progressive MS and even more severe cognitive dysfunction (PASAT-3 score: 15).
Across the voxels that comprised the reconstructed corpus callosum, we measured callosal volume as well as median values of the following MRI indices: FA, mean diffusivity (MD), parallel diffusivity (λ||), perpendicular diffusivity (λ⊥), and magnetization-transfer ratio (MTR). We also created spatially normalized tract profiles [21] to visualize the variation in each of these MRI indices as a function of normalized position along the tract. These calculations were performed with custom software written in Matlab (The Mathworks, Natick, MA).
Subdivision of the corpus callosum
We implemented a standard, semiautomated segmentation subdivision of the corpus callosum [31] that results in 6 distinct segments, the borders of which were drawn on the midsagittal plane: genu and rostrum (demarcated together), rostral midbody, anterior midbody, posterior midbody, isthmus, and splenium. We subdivided each of these segments into 20 equal subsegments to generate the spatially normalized tract profiles [21] and to assess the correlation between MRI abnormalities in each subdivision and disability scores.
Brain volume and whole-brain MRI indices
We used the DTI images to calculate supratentorial brain and cerebrospinal-fluid volumes. To do this, we first removed the skull using the Brain Extraction Tool [32] (http://www.fmrib.ox.ac.uk/fsl/). We then used an affine transformation implemented in the Automatic Image Registration program [28] to register a volume consisting of the average of all diffusion-weighted images to the corresponding volume of a single-subject DTI atlas (“JHU_MNI_SS”) that is available for download (http://www.mristudio.org). This atlas, which contains 1 mm isotropic voxels in a field-of-view of 181 × 217 × 181 mm, has been registered to the standard Montreal Neurological Institute-152 atlas. We then selected for analysis a standard portion of the brain between the mammillary bodies inferiorly and the centrum semiovale superiorly (coordinates 54 ≤ z ≤ 124) and removed a small section of the anterior frontal lobes (y ≤ 37) that was particularly susceptible to echo-planar-imaging-related distortion. Cerebrospinal-fluid segmentation was accomplished by selecting voxels with MD ≥ 1.7 μm2/ms. We used the resulting brain parenchymal and cerebrospinal-fluid masks to calculate compartmental volumes and median values of the same MRI indices that were measured in the corpus callosum. Callosal volume fraction was defined as the ratio of callosal volume, derived from the tractography results, to the combined volume of brain parenchyma and cerebrospinal fluid in the selected portion of the brain.
Lesion segmentation
We used an automatic lesion-segmentation routine, Lesion-TOADS, to delineate the location of T2 lesions [33]. This algorithm uses both MPRAGE and FLAIR data and relies on both statistical and topological atlases to separate lesions from gray matter, white matter, and cerebrospinal fluid. In separate work, we have compared the performance of this algorithm to manual lesion segmentation by an neuroradiologist, with favorable results [33]. Here, we focused on lesions that overlapped the reconstructed corpus callosum, and as a measure of callosal lesion burden, we calculated the fraction of the reconstructed callosal volume that consisted of lesions. The extralesional portions of the corpus callosum were termed the normal-appearing corpus callosum (NACC).
Statistical analysis
Statistical calculations were performed in Stata 9.0 (Stata LP, College Station, TX). We performed two different types of analysis: (1) an analysis of the baseline data (one scan per participant) using fixed-effects regression models; and (2) an analysis of all data using mixed-effects regression models. The fixed-effects analysis is straightforward and produces regression coefficients and partial-correlation estimates to quantify the association between dependent and independent variables. However, it does not take advantage of all of the available data. The mixed-effects analysis, for which we used generalized least-squares random-effects models, accounts for the multiple observations per participant that we obtained and produces estimates of the within- and between-participant variation [34]. By using all available data, we obtain tighter interval estimates for the regression parameters. Note that the mixed-effects analysis does not require an equal number of observations per participant or that those observations be equally spaced in time.
To assess the significance of differences in MRI indices between the MS and healthy-volunteer groups, we used a multiple linear regression model that accounts for age and allows for a different relationship between MRI index and age for the two groups. Specifically, for the mixed-effects analysis, we fit the following model:
| (1) |
where yi,t is the MRI index for participant i at time t, the βj’s are the regression coefficients, di is the diagnosis (1 for MS, 0 for healthy volunteers), ai,0 is the age at baseline for participant i, ai,t is the age at time t for participant i, ā0 is the average age across the entire cohort at baseline, ui is the random effect for participant i, and wi,t is the error term. For the fixed-effects model, we simply set β4=ui=0 and performed a standard regression. For both analyses, the p-value associated with β1 represents the statistical significance of the difference between the two groups intercepts. The parameter β3 represents group differences in the relationship between cross-sectional age and MRI index. Note that the fixed-effects model only considers cross-sectional variation between the groups whereas the mixed-effects model considers both cross-sectional ages and longitudinal aging. We considered the potential need for an interaction of diagnosis with the longitudinal aging term but omitted it in the interest of parsimony.
We used a two-stage procedure to assess the association of MRI indices with disability scores. First, we performed stepwise regressions, using only the baseline data, to search for MRI indices that were most strongly associated with disability scores. Variables that could enter the model included age, callosal volume fraction, callosal lesion fraction, and both whole-brain and callosal MRI indices. Sex was not included in the models as it did not play a significant role in a preliminary analysis (data not shown). We performed separate regressions for each combination of disability score and age/MRI indices, requiring a p-value of < 0.1 for a variable to enter the model. As these stepwise regression models yielded either zero or one significantly associated MRI index (or age) for each disability score, we assessed the strength of the associations by calculating univariate correlation coefficients and their significance with both fixed-effects (using the baseline data) and mixed-effects (using all available data) models.
For comparisons between the MS and healthy-volunteer groups and between lesional and extralesional MRI indices, we analyzed 6 different MRI indices (volume, FA, MD, λ||, λ ⊥, and MTR) and therefore set our threshold significance level to a Bonferroni-corrected 0.008. For the correlational analysis, we tested 5 disability scores (EDSS, MSFC, 9-hole peg test, 25-foot walk, and PASAT-3), adopting, therefore, a threshold significance level of 0.01.
RESULTS
Callosal reconstruction
Tractography typically yielded complete reconstructions of the central corpus callosum, including in many individuals with cognitive dysfunction (see Figure 1E, for example). In a minority of MS scans, however -- typically those of individuals with more severe disability -- but in none of the healthy-volunteer scans, small holes were evident in the reconstruction (14% of MS scans had one hole and 2% had two or more holes as in Figure 1D). There were no scans in which tractography failed entirely.
Callosal and whole-brain MRI abnormalities
After adjusting for age differences between the MS and healthy-volunteer groups, MD and λ ⊥ were found to be significantly (p<0.008) increased in MS, and MTR significantly decreased, in both the whole brain and corpus callosum (Table 2; nearly identical results were obtained when the analysis was restricted to the 53 MS cases for which disability scores were available, as shown in the Supplementary Table). Callosal FA was also significantly decreased in MS. Differences in whole-brain FA and λ|| and callosal λ||, while present, did not quite reach the Bonferroni-corrected threshold for statistical significance. As expected, the p-values derived from mixed-effects regression models, which used all available data, were lower than p-values derived from fixed-effects regression models, which used only the baseline data.
Table 2.
Mean (standard deviation) of supratentorial-brain and callosal MRI indices. Differences between the healthy-volunteer and MS groups were assessed with both fixed-effects (using only the baseline data) and mixed-effects (using all available data) models, and p-values for both models are reported. As there were 6 comparisons per group, we considered p<0.008 to denote significance. Differences between lesions and normal-appearing corpus callosum (NACC) were assessed using a two-tailed, paired t-test on the baseline data. Standard deviations were derived from the overall mixed-effects model and account for both across- and within-participant variability. Volume data are expressed as percentage of intracranial cavity (for supratentorial brain and whole corpus callosum) and percentage of callosal volume (for lesions and NACC).
| supratentorial brain | whole corpus callosum | lesions vs. NACC | |||||||||
|---|---|---|---|---|---|---|---|---|---|---|---|
| healthy volunteers | multiple sclerosis | p-value | healthy volunteers | multiple sclerosis | p-value | lesions | NACC | p-value | |||
| baseline data | all data | baseline data | all data | ||||||||
| volume (%) | 90.6 (4.0) | 85.4 (4.7) | 0.031 | 0.024 | 2.36 (0.28) | 2.05 (0.36) | 0.006 | 0.004 | 1.43 (1.59) | 98.57 (1.59) | <0.001 |
| FA | 0.225 (0.012) | 0.227 (0.014) | 0.022 | 0.018 | 0.719 (0.032) | 0.664 (0.050) | <0.001 | <0.001 | 0.426 (0.115) | 0.666 (0.049) | <0.001 |
| MD (μm2/ms) | 0.828 (0.017) | 0.850 (0.032) | 0.019 | 0.006 | 0.828 (0.027) | 0.894 (0.058) | <0.001 | <0.001 | 1.067 (0.212) | 0.893 (0.058) | <0.001 |
| λ|| (μm2/ms) | 1.096 (0.022) | 1.123 (0.033) | 0.039 | 0.012 | 1.693 (0.056) | 1.748 (0.082) | 0.014 | 0.011 | 1.634 (0.248) | 1.749 (0.082) | <0.001 |
| λ ⊥ (μm2/ms) | 0.702 (0.016) | 0.720 (0.033) | 0.009 | 0.003 | 0.413 (0.039) | 0.494 (0.072) | <0.001 | <0.001 | 0.801 (0.229) | 0.492 (0.071) | <0.001 |
| MTR | 0.416 (0.006) | 0.409 (0.012) | <0.001 | <0.001 | 0.471 (0.011) | 0.454 (0.021) | <0.001 | <0.001 | 0.429 (0.033) | 0.455 (0.021) | <0.001 |
Abbreviations: CC, corpus callosum. NACC, normal-appearing corpus callosum. FA, fractional anisotropy. MD, mean diffusivity. λ||, parallel diffusivity. λ⊥, perpendicular diffusivity. MTR, magnetization transfer ratio.
Differences in brain parenchymal fraction, which was lower in the MS group, did not reach significance after adjusting for age. However, callosal volume, normalized by the volume of the supratentorial intracranial cavity (brain parenchyma + cerebrospinal fluid), was significantly lower in MS. The regression coefficients in eq. (1) associated with baseline age (β2 and β3) were not significantly different from 0 for any of the callosal MRI indices examined, indicating that the influence of age differences between the MS and healthy-volunteer groups was dwarfed by the influence of the disease. However, the coefficient associated with baseline age was significant for models that assessed brain parenchymal fraction and whole-brain FA, partially explaining the lack of a significant difference for those indices.
Lesions vs. NACC
Across the MS cohort, an average of only 1.4% of the reconstructed callosal volume consisted of T2 lesions (Table 2). Generally, MRI indices were significantly more abnormal within lesions than within the NACC, with higher values of MD and λ ⊥ and lower values of FA and MTR. An interesting exception was λ||, which was lower within MS lesions than in the NACC and lower even than λ|| in the corpus callosum of healthy volunteers.
Spatial variation of callosal MRI abnormalities
Figure 2 shows average spatially normalized callosal tract profiles for the MS and healthy-volunteer cohorts, depicting the spatial variation in MRI indices along the corpus callosum. We used the β2 and β3 coefficients from eq. (1), derived from regressions of median callosal MRI indices, to adjust the values of these tract profiles to the mean age in our cohort (41.7 years), although these adjustments had only a small effect. The profiles demonstrate abnormalities in MS (black) compared to healthy volunteers (gray) for all MRI indices examined, and FA and MTR were associated with the largest differences between the two groups. The abnormalities were more prominent in the body and isthmus than in the rostrum, genu, and splenium.
Figure 2. Callosal MRI abnormalities in multiple sclerosis.

Average spatially normalized tract profiles of the corpus callosum for the healthy-volunteer (gray) and MS (black) cohorts at baseline. Values are adjusted to the average age in our cohort (41.7 years). The horizontal axis uses normalized distance units and is divided into 6 sections corresponding to the different callosal segments; each segment contains 20 equal subsegments. Error bars denote standard errors of the mean. MD, mean diffusivity; λ||, parallel diffusivity; λ⊥, perpendicular diffusivity; FA, fractional anisotropy; MTR, magnetization transfer ratio.
Correlation with disability scores
Eleven of the 53 participants with MS (21%) had cognitive dysfunction at baseline, defined by a PASAT-3 score of 32 or less [26]. There was no significant difference in age between these two groups (2-tailed t-test, p=0.75), nor were there significant group differences in baseline MRI indices, normalized callosal volume, or callosal lesion fraction (p>0.05 in all cases).
Correlations between raw callosal MRI indices and disability scores are presented in Table 3. Higher EDSS scores were strongly associated with advanced age but not with whole-brain or callosal MRI indices (including normalized callosal volume and lesion fraction). On the other hand, the overall MSFC score and z-scores on two of the three MSFC components -- the PASAT-3 and the 9-hole peg test -- were significantly correlated with callosal MRI indices but not with age, whole-brain MRI indices, normalized callosal volume, or callosal lesion fraction. Note that the z-scores were constructed so that lower values correspond to greater disability, as specified in the MSFC Administration and Scoring Manual [25]. Figure 3A shows the association between baseline callosal FA and PASAT-3 score, with lower FA corresponding to worse performance on this task; there were no clear distinctions between the different MS subtypes. Figure 3B demonstrates that this association depended more on FA within the NACC than on FA within callosal lesions.
Table 3.
Univariate correlation coefficients of disability scores with age and callosal MRI indices; in parentheses, the corresponding p-values for both fixed-effects (baseline data) and mixed-effects (all data) models. For the MSFC and its components, z-scores, constructed so that lower values correspond to greater disability, were used. As there were 5 disability scores tested, p<0.01 for the mixed-effects model denotes significance (boldface).
| EDSS | MSFC (z-scores) | ||||
|---|---|---|---|---|---|
| combined score | 25-foot walk | 9-hole peg test | PASAT-3 | ||
| age | 0.51 (<0.001; <0.001) | −0.20 (0.14; 0.04) | −0.18 (0.21; 0.09) | −0.19 (0.17; 0.04) | −0.12 (0.40; 0.21) |
| callosal FA | −0.14 (0.29; 0.21) | 0.27 (0.05; 0.004) | 0.14 (0.31; 0.11) | 0.31 (0.02; 0.001) | 0.35 (0.01; <0.001) |
| callosal MD | 0.18 (0.19; 0.35) | −0.29 (0.04; 0.003) | −0.21 (0.13; 0.04) | −0.31 (0.02; 0.006) | −0.23 (0.10; 0.006) |
| callosal λ|| | 0.16 (0.26; 0.90) | −0.13 (0.35; 0.12) | −0.13 (0.34; 0.15) | −0.13 (0.36; 0.49) | −0.02 (0.91; 0.36) |
| callosal λ⊥ | 0.18 (0.19; 0.28) | −0.29 (0.04; 0.004) | −0.18 (0.19; 0.08) | −0.31 (0.02; 0.003) | −0.30 (0.03; 0.001) |
| callosal MTR | −0.12 (0.42; 0.91) | 0.06 (0.67; 0.56) | −0.05 (0.75; 0.74) | 0.17 (0.24; 0.25) | 0.21 (0.14; 0.009) |
Abbreviations: FA, fractional anisotropy. MD, mean diffusivity. λ⊥, perpendicular diffusivity. EDSS, expanded disability status score. PASAT-3, paced auditory serial addition task, 3 second version.
Figure 3. Association between callosal fractional anisotropy (FA) and disability scores at baseline.

Disability scores were measured within 30 days of MRI scanning in the MS cohort. (A) Paced auditory serial-addition task, 3-second version (PASAT-3). Each data point represents a single participant, and values are averaged across up to 6 scans per participant. Squares, relapsing-remitting MS; circles, secondary-progressive MS; triangles, primary-progressive MS. (B) Association of PASAT-3 with callosal FA within (solid symbols) and outside (open symbols with center dot) callosal lesions. (C) Callosal disability map. Columns represent the z statistic from regressions of disability scores against FA in the whole corpus callosum and individual callosal segments. Negative z statistics correspond to inverse correlations, and the horizontal lines on the plot delineate p=0.05.
Disability scores and callosal segments
Figure 3C shows that the anterior body and splenium of the corpus callosum contributed most strongly to the association between FA and PASAT-3, with smaller contributions from the rostrum, genu, and isthmus. For the association with 9-hole peg-test time, on the other hand, the isthmus and splenium contributed most strongly. There was no specific segment of the corpus callosum in which FA was associated with 25-foot walking time or EDSS.
DISCUSSION
In this study, we demonstrated significant abnormalities of MRI indices along the corpus callosum in MS. The specific associations between callosal abnormalities and disability, particularly PASAT-3 score and 9-hole peg-test time, could not be explained by the extent of demyelinating lesions within the corpus callosum, callosal volume, or whole-brain MRI indices. Thus, quantitative, tract-specific MRI can capture some of the structural damage that is associated with complex disability in MS.
Callosal imaging abnormalities in MS
MRI indices were diffusely abnormal along the corpus callosum (Figure 2), even after accounting for differences in age between the MS and healthy-volunteer groups. Specifically, diffusivity (both mean and directional) was elevated, and both FA and MTR were decreased. Spatially normalized tract-profile analysis localized the most abnormal segments to the body and isthmus, with relative sparing of the rostrum and genu. These results are consistent with recent reports [8, 35].
As expected, we found that MRI abnormalities within callosal lesions were more pronounced than in the extralesional NACC. The one exception to this rule was parallel diffusivity (λ||), which we found to be significantly lower within MS lesions than in the NACC of participants with MS and the normal corpus callosum of healthy volunteers. Parallel diffusivity is commonly decreased in animal models of MS [36–39], but human studies in chronic MS have generally demonstrated an elevation [21, 40]. However, a recent study reported decreased λ|| in the optic nerves of individuals with acute optic neuritis who subsequently recovered poorly, suggesting that decreased λ||, when present, may relate to axon destruction [16]. Our finding of decreased lesional λ|| may have the same interpretation, although understanding directional diffusivity in the setting of tissue destruction remains problematic [41]. Taken together, our results from both diffusion-weighted and magnetization-transfer-weighted imaging suggest a multifocal and diffuse disorder affecting both axons and myelin in the MS corpus callosum.
Callosal imaging abnormalities and cognitive dysfunction
Callosal structural integrity has been linked to high-level tasks in various domains, including cognition. The PASAT-3 is sensitive to several aspects of cognition, including auditory information processing speed, attention, working memory, and calculation [5]. It is a component of both a standard MS global disability scale, the MSFC [23], and of the minimal assessment of cognitive function in MS [42].
In relapsing-remitting MS, one study reported a negative correlation of PASAT-3 scores with callosal MD but no association with callosal T2 lesion volume [43], and a follow-up study from the same group reported a positive correlation with callosal MTR [44]. In a recent statistical-parametric-mapping study of individuals with so-called benign MS [45], PASAT-3 scores were significantly correlated with callosal T2 lesion volume, FA within callosal lesions and NACC, and MD in the NACC. In individuals with clinically isolated syndromes, decreased MTR in the splenium of the corpus callosum was associated with lower PASAT-3 scores [46]. Our study generally found weaker correlations than these other studies. The differences may in part be technical even with respect to the most similar studies [43, 44], which also used DTI tractography to define the corpus callosum but which included more lateral portions of the tract than we did. In addition, we studied individuals with more advanced MS than any of the other studies, and it is possible that the relationship between callosal MRI abnormalities and cognitive dysfunction is different in this group.
Audoin et al. [47, 48] investigated the ways in which individuals with early MS and healthy volunteers use different cortical regions -- particularly several areas in the bilateral frontal lobes -- to perform the PASAT-3. They suggested that in some cases, functional plasticity could preserve cognitive performance in the face of damage to cortical areas, or to axons projecting from those areas, that are normally involved in performing the task. Such plasticity appeared to arise from a combination of white-matter structural changes and cortical functional reorganization and also appeared to involve connections to the thalamus. Our results indirectly support the notion that damage to the connections between gray-matter areas used to perform the PASAT-3 may be involved in this reorganization. Such damage is particularly prominent in the anterior body of the corpus callosum, which has been shown to project to some of the frontal areas and subcortical nuclei that are involved in task performance [49]. Involvement of the splenium, which primarily carries visual information, is more difficult to explain; one possibility is that individuals use an implicit visual representation to solve this task.
Callosal damage and noncognitive dysfunction
Callosal damage in MS can also cause functional deficits outside of the realm of cognition. For example, people with MS perform poorly on a bimanual motor-coordination task that relies on interhemispheric communication via the corpus callosum [3, 50]. Callosal DTI abnormalities -- specifically, decreased FA and increased MD -- have been associated with poor performance on this task [51].
The results of our study, captured in Table 3, demonstrate that callosal abnormalities are most strongly associated with PASAT-3 but that there is a similar association with 9-hole peg-test time. Compared to other components of the MSFC, the 9-hole peg test more specifically involves pathways that connect the supplementary motor areas, which traverse the corpus callosum, and performance on that task has been associated with increased λ⊥ in those pathways [11]. We found that decreased FA and increased MD and λ⊥ were associated with impairments on this task, and that these abnormalities were most prominent in the isthmus and splenium, consistent with the multimodality (somatosensory, motor, and visual) nature of this task. Our localization is posterior to, but perhaps overlapping with, the segment that was previously found to be associated with task performance [11].
We found no correlations of callosal MRI indices with EDSS score and 25-foot walking time, and nearly all of the variation in EDSS that we could explain was due to age. The EDSS is the primary clinical outcome for evaluating MS in clinical trials, and it remains a useful tool for classifying MS patients according to disease severity. However, cognitive and noncognitive impairment do not always develop in parallel in MS, and the EDSS is heavily weighted toward simple motor disability; therefore, the poor observed correlations with EDSS are not particularly surprising. Similarly, walking is a highly automatic function that may not require the corpus callosum.
Although significant, callosal abnormalities only accounted for a relatively small fraction of the variation in PASAT-3 performance, 9-hole peg-test time, and overall MSFC score, with absolute values of partial correlation coefficients ranging from 0.25–0.35. These tasks are mediated by many different regions in the brain and spinal cord, and it is perhaps surprising that a single area can have as large a contribution as we have demonstrated. Other reasons for the inability to find stronger associations include the limited sensitivity afforded by a small set of MRI indices and the intrinsically high within-participant variability of the disability scores.
Limitations
An important limitation of our study is the intrinsic variability of DTI-based tractography to reliably identify tracts in their entirety. In individuals with disease, tractography can lead to exclusion of some of the most affected fibers, thereby potentially reducing the correlation with disability. An example of this can be seen in Figure 1D, in which there are small holes in the reconstructed corpus callosum in an individual with cognitive dysfunction (although callosal reconstructions in many individuals with even more severe cognitive dysfunction were often complete; see, for example, Figure 1E). We partially compensated for this possibility by selecting a low FA threshold in the tractography algorithm, and reconstructed tracts typically passed through the lesions rather than stopped at them: only a minority of callosal reconstructions -- 16% -- contained small holes, and of these 88% contained a single hole. Recently, we demonstrated that an alternative, atlas-based approach to segmenting the corpus callosum yields MRI indices that are similarly correlated with disability scores in the same cohort, suggesting that the presence of these holes does not substantially affect the results [52]. Moreover, the exclusion of heavily damaged portions of the corpus callosum is conservative in the sense that it is likely to reduce our ability to detect abnormalities in MS and correlations with disability scores.
A second limitation is that the healthy volunteers were generally younger than the MS participants. Although we included age as a covariate in our regression analyses, the effect of age might be even more complex than is accounted for in our models. In addition, the study was performed over an extended period of time, and scanner hardware and software changes during that period could have impacted our results (although regression analysis did not detect any such effects in our data). Finally, despite our application of a Bonferroni correction in adjudicating statistical significance, the potential for false discovery induced by multiple comparisons remains. Therefore, prospective studies would be necessary to assess the true significance, and clinical relevance, of the abnormalities and correlations reported here.
CONCLUSION
Quantitative MRI abnormalities in the corpus callosum -- especially the portions outside T2 lesions -- partially account for cognitive and upper-extremity dysfunction in MS. Since cognitive disability is particularly difficult to measure at the bedside, and since cognitive and noncognitive disability may proceed at different rates, the ability to associate cognitive impairment with imaging data may ultimately be useful for monitoring patients and assessing response to therapy in clinical trials. Future studies will address whether quantitative MRI indices in the corpus callosum can predict future cognitive disability in a clinically useful fashion.
Acknowledgments
We thank Sheena Farrell, Terri Brawner, Kathleen Kahl, Ivana Kusevic, Scott Newsome, and John Ratchford for assistance with data collection, and Susan Courtney, Jonathan Farrell, Bennett Landman, Susumu Mori, and Peter van Zijl for helpful comments. The study was supported by National Multiple Sclerosis Society grants CA1029A2 and TR3760A3; NIH grants K99NS064098, P41RR015241, R01AG020012, and K01EB009120; and the Nancy Davis Center without Walls.
References
- 1.Gazzaniga MS. Cerebral specialization and interhemispheric communication: does the corpus callosum enable the human condition? Brain. 2000;123 ( Pt 7):1293–326. doi: 10.1093/brain/123.7.1293. [DOI] [PubMed] [Google Scholar]
- 2.Evangelou N, Konz D, Esiri MM, Smith S, Palace J, Matthews PM. Regional axonal loss in the corpus callosum correlates with cerebral white matter lesion volume and distribution in multiple sclerosis. Brain. 2000;123 ( Pt 9):1845–9. doi: 10.1093/brain/123.9.1845. [DOI] [PubMed] [Google Scholar]
- 3.Larson EB, Burnison DS, Brown WS. Callosal function in multiple sclerosis: bimanual motor coordination. Cortex. 2002;38:201–14. doi: 10.1016/s0010-9452(08)70650-6. [DOI] [PubMed] [Google Scholar]
- 4.Bobholz JA, Rao SM. Cognitive dysfunction in multiple sclerosis: a review of recent developments. Curr Opin Neurol. 2003;16:283–8. doi: 10.1097/01.wco.0000073928.19076.84. [DOI] [PubMed] [Google Scholar]
- 5.Gronwall DM. Paced auditory serial-addition task: a measure of recovery from concussion. Percept Mot Skills. 1977;44:367–73. doi: 10.2466/pms.1977.44.2.367. [DOI] [PubMed] [Google Scholar]
- 6.Huijbregts SC, Kalkers NF, de Sonneville LM, de Groot V, Polman CH. Cognitive impairment and decline in different MS subtypes. J Neurol Sci. 2006;245:187–94. doi: 10.1016/j.jns.2005.07.018. [DOI] [PubMed] [Google Scholar]
- 7.Ranjeva JP, Audoin B, Au Duong MV, Confort-Gouny S, Malikova I, Viout P, Soulier E, Pelletier J, Cozzone PJ. Structural and functional surrogates of cognitive impairment at the very early stage of multiple sclerosis. J Neurol Sci. 2006;245:161–7. doi: 10.1016/j.jns.2005.09.019. [DOI] [PubMed] [Google Scholar]
- 8.Ge Y, Law M, Johnson G, Herbert J, Babb JS, Mannon LJ, Grossman RI. Preferential occult injury of corpus callosum in multiple sclerosis measured by diffusion tensor imaging. J Magn Reson Imaging. 2004;20:1–7. doi: 10.1002/jmri.20083. [DOI] [PubMed] [Google Scholar]
- 9.Simon JH, Jacobs L, Kinkel RP. Transcallosal bands: A sign of neuronal tract degeneration in early MS? Neurology. 2001;57:1888–90. doi: 10.1212/wnl.57.10.1888. [DOI] [PubMed] [Google Scholar]
- 10.Schwid SR, Thornton CA, Pandya S, Manzur KL, Sanjak M, Petrie MD, McDermott MP, Goodman AD. Quantitative assessment of motor fatigue and strength in MS. Neurology. 1999;53:743–50. doi: 10.1212/wnl.53.4.743. [DOI] [PubMed] [Google Scholar]
- 11.Lowe MJ, Horenstein C, Hirsch JG, Marrie RA, Stone L, Bhattacharyya PK, Gass A, Phillips MD. Functional pathway-defined MRI diffusion measures reveal increased transverse diffusivity of water in multiple sclerosis. Neuroimage. 2006;32:1127–33. doi: 10.1016/j.neuroimage.2006.04.208. [DOI] [PubMed] [Google Scholar]
- 12.Werring DJ, Clark CA, Barker GJ, Thompson AJ, Miller DH. Diffusion tensor imaging of lesions and normal-appearing white matter in multiple sclerosis. Neurology. 1999;52:1626–32. doi: 10.1212/wnl.52.8.1626. [DOI] [PubMed] [Google Scholar]
- 13.Guo AC, MacFall JR, Provenzale JM. Multiple sclerosis: diffusion tensor MR imaging for evaluation of normal-appearing white matter. Radiology. 2002;222:729–36. doi: 10.1148/radiol.2223010311. [DOI] [PubMed] [Google Scholar]
- 14.Rao SM, Leo GJ, Haughton VM, St Aubin-Faubert P, Bernardin L. Correlation of magnetic resonance imaging with neuropsychological testing in multiple sclerosis. Neurology. 1989;39:161–6. doi: 10.1212/wnl.39.2.161. [DOI] [PubMed] [Google Scholar]
- 15.Basser PJ, Mattiello J, LeBihan D. MR diffusion tensor spectroscopy and imaging. Biophys J. 1994;66:259–67. doi: 10.1016/S0006-3495(94)80775-1. [DOI] [PMC free article] [PubMed] [Google Scholar]
- 16.Naismith RT, Xu J, Tutlam NT, Snyder A, Benzinger T, Shimony J, Shepherd J, Trinkaus K, Cross AH, Song SK. Disability in optic neuritis correlates with diffusion tensor-derived directional diffusivities. Neurology. 2009;72:589–94. doi: 10.1212/01.wnl.0000335766.22758.cd. [DOI] [PMC free article] [PubMed] [Google Scholar]
- 17.Ciccarelli O, Werring DJ, Wheeler-Kingshott CA, Barker GJ, Parker GJ, Thompson AJ, Miller DH. Investigation of MS normal-appearing brain using diffusion tensor MRI with clinical correlations. Neurology. 2001;56:926–33. doi: 10.1212/wnl.56.7.926. [DOI] [PubMed] [Google Scholar]
- 18.Fox RJ, McColl RW, Lee JC, Frohman T, Sakaie K, Frohman E. A preliminary validation study of diffusion tensor imaging as a measure of functional brain injury. Arch Neurol. 2008;65:1179–84. doi: 10.1001/archneur.65.9.1179. [DOI] [PubMed] [Google Scholar]
- 19.Filippi M, Cercignani M, Inglese M, Horsfield MA, Comi G. Diffusion tensor magnetic resonance imaging in multiple sclerosis. Neurology. 2001;56:304–11. doi: 10.1212/wnl.56.3.304. [DOI] [PubMed] [Google Scholar]
- 20.Mori S, Crain BJ, Chacko VP, van Zijl PC. Three-dimensional tracking of axonal projections in the brain by magnetic resonance imaging. Ann Neurol. 1999;45:265–9. doi: 10.1002/1531-8249(199902)45:2<265::aid-ana21>3.0.co;2-3. [DOI] [PubMed] [Google Scholar]
- 21.Reich DS, Smith SA, Zackowski KM, Gordon-Lipkin EM, Jones CK, Farrell JA, Mori S, van Zijl PC, Calabresi PA. Multiparametric magnetic resonance imaging analysis of the corticospinal tract in multiple sclerosis. Neuroimage. 2007;38:271–9. doi: 10.1016/j.neuroimage.2007.07.049. [DOI] [PMC free article] [PubMed] [Google Scholar]
- 22.Kurtzke JF. Rating neurologic impairment in multiple sclerosis: an expanded disability status scale (EDSS) Neurology. 1983;33:1444–52. doi: 10.1212/wnl.33.11.1444. [DOI] [PubMed] [Google Scholar]
- 23.Cutter GR, Baier ML, Rudick RA, Cookfair DL, Fischer JS, Petkau J, Syndulko K, Weinshenker BG, Antel JP, Confavreux C, Ellison GW, Lublin F, Miller AE, Rao SM, Reingold S, Thompson A, Willoughby E. Development of a multiple sclerosis functional composite as a clinical trial outcome measure. Brain. 1999;122 ( Pt 5):871–82. doi: 10.1093/brain/122.5.871. [DOI] [PubMed] [Google Scholar]
- 24.McDonald WI, Compston A, Edan G, Goodkin D, Hartung HP, Lublin FD, McFarland HF, Paty DW, Polman CH, Reingold SC, Sandberg-Wollheim M, Sibley W, Thompson A, van den Noort S, Weinshenker BY, Wolinsky JS. Recommended diagnostic criteria for multiple sclerosis: guidelines from the International Panel on the diagnosis of multiple sclerosis. Ann Neurol. 2001;50:121–7. doi: 10.1002/ana.1032. [DOI] [PubMed] [Google Scholar]
- 25.Fischer JS, Jak AJ, Kniker JE, Rudick RA, Cutter G. Multiple Sclerosis Functional Composite Adminsitration and Scoritng Manual. New York: National Multiple Sclerosis Society; 2001. Revised. ed. [Google Scholar]
- 26.Rao SM, Leo GJ, Bernardin L, Unverzagt F. Cognitive dysfunction in multiple sclerosis. I. Frequency, patterns, and prediction. Neurology. 1991;41:685–91. doi: 10.1212/wnl.41.5.685. [DOI] [PubMed] [Google Scholar]
- 27.Reich DS, Smith SA, Jones CK, Zackowski KM, van Zijl PC, Calabresi PA, Mori S. Quantitative characterization of the corticospinal tract at 3T. AJNR Am J Neuroradiol. 2006;27:2168–78. [PMC free article] [PubMed] [Google Scholar]
- 28.Woods RP, Grafton ST, Holmes CJ, Cherry SR, Mazziotta JC. Automated image registration: I. General methods and intrasubject, intramodality validation. J Comput Assist Tomogr. 1998;22:139–52. doi: 10.1097/00004728-199801000-00027. [DOI] [PubMed] [Google Scholar]
- 29.Jiang H, van Zijl PC, Kim J, Pearlson GD, Mori S. DtiStudio: resource program for diffusion tensor computation and fiber bundle tracking. Comput Methods Programs Biomed. 2006;81:106–16. doi: 10.1016/j.cmpb.2005.08.004. [DOI] [PubMed] [Google Scholar]
- 30.Pierpaoli C, Basser PJ. Toward a quantitative assessment of diffusion anisotropy. Magn Reson Med. 1996;36:893–906. doi: 10.1002/mrm.1910360612. [DOI] [PubMed] [Google Scholar]
- 31.Witelson SF. Hand and sex differences in the isthmus and genu of the human corpus callosum. A postmortem morphological study. Brain. 1989;112 ( Pt 3):799–835. doi: 10.1093/brain/112.3.799. [DOI] [PubMed] [Google Scholar]
- 32.Smith SM. Fast robust automated brain extraction. Hum Brain Mapp. 2002;17:143–55. doi: 10.1002/hbm.10062. [DOI] [PMC free article] [PubMed] [Google Scholar]
- 33.Shiee N, Bazin P-L, Ozturk A, Reich DS, Calabresi PA, Pham DL. A topology preserving approach to the segmentation of brain images with multiple sclerosis lesions. Neuroimage. 2009 doi: 10.1016/j.neuroimage.2009.09.005. in press. [DOI] [PMC free article] [PubMed] [Google Scholar]
- 34.Verbeke G, Molenberghs G. Linear Mixed Models for Longitudinal Data. 2. New York: Springer; 2009. [Google Scholar]
- 35.Hasan KM, Gupta RK, Santos RM, Wolinsky JS, Narayana PA. Diffusion tensor fractional anisotropy of the normal-appearing seven segments of the corpus callosum in healthy adults and relapsing-remitting multiple sclerosis patients. J Magn Reson Imaging. 2005;21:735–43. doi: 10.1002/jmri.20296. [DOI] [PubMed] [Google Scholar]
- 36.DeBoy CA, Zhang J, Dike S, Shats I, Jones M, Reich DS, Mori S, Nguyen T, Rothstein B, Miller RH, Griffin JT, Kerr DA, Calabresi PA. High resolution diffusion tensor imaging of axonal damage in focal inflammatory and demyelinating lesions in rat spinal cord. Brain. 2007;130:2199–210. doi: 10.1093/brain/awm122. [DOI] [PubMed] [Google Scholar]
- 37.Budde MD, Kim JH, Liang HF, Russell JH, Cross AH, Song SK. NMR Biomed. 2007. Axonal injury detected by in vivo diffusion tensor imaging correlates with neurological disability in a mouse model of multiple sclerosis. [DOI] [PMC free article] [PubMed] [Google Scholar]
- 38.Sun SW, Liang HF, Trinkaus K, Cross AH, Armstrong RC, Song SK. Noninvasive detection of cuprizone induced axonal damage and demyelination in the mouse corpus callosum. Magn Reson Med. 2006;55:302–8. doi: 10.1002/mrm.20774. [DOI] [PubMed] [Google Scholar]
- 39.Zhang J, Jones M, DeBoy CA, Reich DS, Farrell JAD, Hoffman PN, Griffin JW, Sheikh KA, Miller MI, Mori S, Calabresi PA. Diffusion tensor magnetic resonance imaging of Wallerian degeneration in rat spinal cord after dorsal root axotomy. J Neurosci. 2009;29:3160–71. doi: 10.1523/JNEUROSCI.3941-08.2009. [DOI] [PMC free article] [PubMed] [Google Scholar]
- 40.Roosendaal SD, Geurts JJ, Vrenken H, Hulst HE, Cover KS, Castelijns JA, Pouwels PJ, Barkhof F. Regional DTI differences in multiple sclerosis patients. Neuroimage. 2008 doi: 10.1016/j.neuroimage.2008.10.026. [DOI] [PubMed] [Google Scholar]
- 41.Wheeler-Kingshott CAM, Cercignani M. About “axial” and “radial” diffusivities. Magnetic Resonance in Medicine. 2009 doi: 10.1002/mrm.21965. in press:NA. [DOI] [PubMed] [Google Scholar]
- 42.Benedict RH, Fischer JS, Archibald CJ, Arnett PA, Beatty WW, Bobholz J, Chelune GJ, Fisk JD, Langdon DW, Caruso L, Foley F, LaRocca NG, Vowels L, Weinstein A, DeLuca J, Rao SM, Munschauer F. Minimal neuropsychological assessment of MS patients: a consensus approach. Clin Neuropsychol. 2002;16:381–97. doi: 10.1076/clin.16.3.381.13859. [DOI] [PubMed] [Google Scholar]
- 43.Lin X, Tench CR, Morgan PS, Niepel G, Constantinescu CS. ‘Importance sampling’ in MS: use of diffusion tensor tractography to quantify pathology related to specific impairment. J Neurol Sci. 2005;237:13–9. doi: 10.1016/j.jns.2005.04.019. [DOI] [PubMed] [Google Scholar]
- 44.Lin X, Tench CR, Morgan PS, Constantinescu CS. Use of combined conventional and quantitative MRI to quantify pathology related to cognitive impairment in multiple sclerosis. J Neurol Neurosurg Psychiatry. 2008;79:437–41. doi: 10.1136/jnnp.2006.112177. [DOI] [PubMed] [Google Scholar]
- 45.Mesaros S, Rocca MA, Riccitelli G, Pagani E, Rovaris M, Caputo D, Ghezzi A, Capra R, Bertolotto A, Comi G, Filippi M. Corpus callosum damage and cognitive dysfunction in benign MS. Hum Brain Mapp. 2009 doi: 10.1002/hbm.20692. in press. [DOI] [PMC free article] [PubMed] [Google Scholar]
- 46.Ranjeva JP, Audoin B, Au Duong MV, Ibarrola D, Confort-Gouny S, Malikova I, Soulier E, Viout P, Ali-Cherif A, Pelletier J, Cozzone P. Local tissue damage assessed with statistical mapping analysis of brain magnetization transfer ratio: relationship with functional status of patients in the earliest stage of multiple sclerosis. AJNR Am J Neuroradiol. 2005;26:119–27. [PMC free article] [PubMed] [Google Scholar]
- 47.Audoin B, Au Duong MV, Ranjeva JP, Ibarrola D, Malikova I, Confort-Gouny S, Soulier E, Viout P, Ali-Cherif A, Pelletier J, Cozzone PJ. Magnetic resonance study of the influence of tissue damage and cortical reorganization on PASAT performance at the earliest stage of multiple sclerosis. Hum Brain Mapp. 2005;24:216–28. doi: 10.1002/hbm.20083. [DOI] [PMC free article] [PubMed] [Google Scholar]
- 48.Audoin B, Guye M, Reuter F, Au Duong MV, Confort-Gouny S, Malikova I, Soulier E, Viout P, Cherif AA, Cozzone PJ, Pelletier J, Ranjeva JP. Structure of WM bundles constituting the working memory system in early multiple sclerosis: a quantitative DTI tractography study. Neuroimage. 2007;36:1324–30. doi: 10.1016/j.neuroimage.2007.04.038. [DOI] [PubMed] [Google Scholar]
- 49.Huang H, Zhang J, Jiang H, Wakana S, Poetscher L, Miller MI, van Zijl PC, Hillis AE, Wytik R, Mori S. DTI tractography based parcellation of white matter: application to the mid-sagittal morphology of corpus callosum. Neuroimage. 2005;26:195–205. doi: 10.1016/j.neuroimage.2005.01.019. [DOI] [PubMed] [Google Scholar]
- 50.Pelletier J, Suchet L, Witjas T, Habib M, Guttmann CR, Salamon G, Lyon-Caen O, Cherif AA. A longitudinal study of callosal atrophy and interhemispheric dysfunction in relapsing-remitting multiple sclerosis. Arch Neurol. 2001;58:105–11. doi: 10.1001/archneur.58.1.105. [DOI] [PubMed] [Google Scholar]
- 51.Warlop NP, Achten E, Debruyne J, Vingerhoets G. Diffusion weighted callosal integrity reflects interhemispheric communication efficiency in multiple sclerosis. Neuropsychologia. 2008;46:2258–64. doi: 10.1016/j.neuropsychologia.2008.02.010. [DOI] [PubMed] [Google Scholar]
- 52.Reich DS, Smith SA, Ozturk A, Gordon-Lipkin EM, Farrell SK, van Zijl PCM, Calabresi PA, Mori S. International Society for Magnetic Resonance in Medicine. Honolulu, HI: 2009. Automated vs. conventional tractography in multiple sclerosis: Variability and correlation with disability. [Google Scholar]