

Abstract
The polymorphic inversion on 17q21, sometimes called the microtubular associated protein tau (MAPT) inversion, is an ∼900 kb inversion found primarily in Europeans and Southwest Asians. We have identified 21 SNPs that act as markers of the inverted, i.e., H2, haplotype. The inversion is found at the highest frequencies in Southwest Asia and Southern Europe (frequencies of ∼30%); elsewhere in Europe, frequencies vary from < 5%, in Finns, to 28%, in Orcadians. The H2 inversion haplotype also occurs at low frequencies in Africa, Central Asia, East Asia, and the Americas, though the East Asian and Amerindian alleles may be due to recent gene flow from Europe. Molecular evolution analyses indicate that the H2 haplotype originally arose in Africa or Southwest Asia. Though the H2 inversion has many fixed differences across the ∼900 kb, short tandem repeat polymorphism data indicate a very recent date for the most recent common ancestor, with dates ranging from 13,600 to 108,400 years, depending on assumptions and estimation methods. This estimate range is much more recent than the 3 million year age estimated by Stefansson et al. in 2005.1
Introduction
What was shown to be an inversion on 17q21 by Stefansson et al. had initially been shown to be an ∼100 kb region of complete linkage disequilibrium encompassing the microtubule-associated protein tau gene (MAPT [MIM 157140]).1 Baker et al. named the most common haplotype H1 and the less common haplotype H2.2 Later, Pastor et al. extended the region of known complete disequilibrium to ∼700 kb.3 Stefansson et al. then showed that the H1 and H2 haplotypes showed complete disequilibrium because H2 was inverted with respect to H1, the common human reference sequence, and actually extends ∼900 kb.1 The inversion encompasses a number of genes within its 900 kb extent. The MAPT gene is one of the most studied of these because of its association with neurodegenerative disorders (see below). Many of the other genes are also associated with neural function and development. Absence of recombination between the inverted and the noninverted chromosomes has resulted in two families of chromosomes: H1 chromosomes, which comprise the common human noninverted gene order, and H2 haplotype, which comprises the inverted gene order. The H1 family of haplotypes has been associated with a number of tauopathies, diseases marked by the accumulation of MAPT neurofibrillary tangles in nerve cells, such as sporadic frontotemporal dementia (FTD [MIM 600274]), Alzheimer disease (AD [MIM 104300]), Parkinson disease (MIM 168600), and progressive supranuclear palsy (PSP [MIM 601104]).4 The H2 haplotype has also been associated with familial FTD by one group, though this association has yet to be replicated.5 H2 chromosomes also seem to be susceptible to de novo deletions that lead to developmental delay and learning difficulties.6–8 Moreover, the promoter region of MAPT in H1 chromosomes is more efficient at driving transcription than the promoter sequence on the H2 haplotype.9 This has been shown to be particularly true with the H1c subhaplotype.10
Most work in this region has been focused on disease susceptibility and protection associated with the H2 haplotypes; only a few studies have looked at the population genetics of the inversion. On the basis of our data, previously deposited in ALFRED, on two SNPs associated with the inversion, Stefansson et al.1 estimated the inversion haplotype frequency to be 20% in Europeans, 6% in Africans, and < 1% in East Asians. They also used maximum-parsimony trees to suggest that the H1 and H2 lineages diverged approximately 3 million years ago, a pre-Homo sp. origin of the inversion. It would be odd (though not impossible) for a polymorphism such as this to remain polymorphic through such a long series of speciations. Finally, they used reproductive rates in Icelanders to suggest that the H2 lineage is under positive selection in Europeans. They showed that women who have at least one copy of the inversion have more children than those who do not, though the difference is less than one child per woman. They favored a balancing selection model but were unable to rule out a dominant model of selection.1
Work has begun on the organization of this region in nonhuman primates (NHPs). Holzer et al.11 resequenced the exons and flanking intronic regions of MAPT, as well as Saitohin (STH [MIM 607067]), a gene that is found in intron 9 of the MAPT gene in chimpanzees, gorillas, and gibbons. They also partially sequenced cynomolgus macaque (Macaca fascicularis) and green monkey (Chlorocebus sabaeus). They typed eight inversion markers in the NHPs and found that seven corresponded to the H2 allele in humans. They concluded that NHPs had the H2 version of the MAPT gene and that this agrees with the finding that NHPs seem less susceptible to tauopathies than do H1 humans.11 More recently, Zody et al. used fluorescence in situ hybridization (FISH) to study the orientation of this region in NHPs. They found that the inversion is highly polymorphic in both Pan species as in Pongo, whereas the H2 inverted orientation is predominant in Macaca. They proposed that this region is susceptible to recurrent inversion throughout the primate lineage. They concluded that in the human lineage, an inversion event occurred on an ancestral primate H2 chromosome ∼2.3 million years ago. The resulting H1 orientation then rose to extremely high frequencies in humans, almost completely replacing the ancestral H2 inverted orientation. The H2 inverted orientation then rose to higher frequencies in Europe by means of selection or a founder effect.12
Here, we present our results on the global distribution of haplotypes by using SNPs and short tandem repeat polymorphisms (STRPs). We provide a detailed description of the distributions of both the H2 family of haplotypes, including the individual haplotypes within this family, and the H1 haplotypes. We describe these haplotypes and their component SNPs in NHPs. Finally, we estimate a time period for the most recent common ancestor (MRCA) of the MAPT H2 chromosome by using STRP haplotypes. Our data and analyses argue that the H2 chromosome inversion in humans arose in Africa or Southwest Asia and may be younger than previously believed.
Material and Methods
Population Samples
We typed SNPs in 3135 individuals from a global sample of 66 populations. The populations represent the regions of Africa (13 populations), Southwest Asia (5), Europe (16), Central Asia (9), East Asia (10), the Pacific Islands (4), North America (4), and South America (5) (Table 1). STRPs were typed in a subset of these population samples. We also typed 15 NHPs: three each of chimpanzee (Pan troglodytes), bonobo (Pan paniscus), gorilla (Gorilla gorilla), orangutan (Pongo pygmaeus), and gibbon (Hylobates). Moreover, we included published data on other populations in some of our analyses: those in the Human Genome Diversity Panel (HGDP),13,14 English,15 Icelandic,1 Norwegian,16 German,17 Serbian,17 and Brescia Italian.5 Smaller HGDP population samples were combined with closely related populations to form larger samples for our analyses (Table 1).
Table 1.
Populations
| Population | Abbrev. | N |
|---|---|---|
| Africa (15)a | ||
| Biaka | BIA | 70 |
| Mbuti | MBU | 39 |
| Lisongo | LIS | 8 |
| Yoruba | YOR | 78 |
| Ibo | IBO | 48 |
| Hausa | HAS | 39 |
| Mandenka | MND | 24 |
| Masai | MAS | 22 |
| Chagga | CGA | 45 |
| Sandawe | SND | 40 |
| Zaramo | ZRM | 40 |
| Somali | SOM | 22 |
| Ethiopian Jews | ETJ | 32 |
| African Americans | AAM | 90 |
| Mozabite | MZB | 30 |
| Siberia (3)a | ||
| Komi Zyriane | KMZ | 47 |
| Khanty | KTY | 50 |
| Yakut | YAK | 51 |
| Europe (26)a | ||
| Ashkenazi Jews | ASH | 83 |
| Greeks | GRK | 56 |
| Sardinians | SRD | 35 |
| Roman Jews | RMJ | 27 |
| Toscani | TOS | 90 |
| ITALIANS | ITL | 22 |
| Brescia Italiansb | BIT | 50 |
| Catalan | CAT | 42 |
| Spanish Basque | SPB | 76 |
| French Basque | FRB | 24 |
| French | FRE | 29 |
| Adygei | ADY | 54 |
| Chuvash | CHV | 42 |
| Hungarians | HGR | 87 |
| Russians, Vologda | RUV | 48 |
| Russians, Archangelsk | RUA | 34 |
| Finns | FIN | 36 |
| Serbsc | SRB | 156 |
| Germansc | GER | 162 |
| Norwegiand | NOR | 68 |
| Danes | DAN | 51 |
| Englishe | ENG | 169 |
| Irish | IRI | 118 |
| Orcadians | ORC | 16 |
| Icelandicf | ICE | 1,880 |
| European Americans | EAM | 92 |
| Central Asia (12)a | ||
| Balochi | BAL | 25 |
| Brahui | BRH | 25 |
| Negroid Makrani | NMK | 28 |
| Sindhi | SIN | 25 |
| Pathan | PTH | 23 |
| Burusho | BRS | 25 |
| Kalash | KAL | 25 |
| Hazara | HAZ | 32 |
| Mohanna | MOH | 54 |
| Thoti | THT | 14 |
| Keralite | KER | 30 |
| Kachari | KCH | 17 |
| Pacific Islands (4)a | ||
| Nasioi Melanesians | NAS | 23 |
| Paupa-New Guineans | PNG | 22 |
| Micronesians | MCR | 37 |
| Samoans | SMN | 8 |
| East Asia (14)a | ||
| Malaysians | MLY | 11 |
| Laotians | LAO | 119 |
| Cambodians | CBD | 25 |
| Chinese, San Fransisco | CHS | 60 |
| Chinese, Taiwan | CHT | 49 |
| Hakka | HKA | 41 |
| MONGOL | MNG | 19 |
| MANCHU | MNC | 28 |
| LOLO | LOL | 39 |
| HMONG | HMG | 20 |
| Koreans | KOR | 66 |
| Japanese | JPN | 51 |
| Ami | AMI | 40 |
| Atayal | ATL | 42 |
| North America (4)a | ||
| Cheyenne | CHY | 56 |
| Pima, Arizona | PMA | 51 |
| Pima, Mexico | PMM | 50 |
| Maya | MAY | 52 |
| South America (5)a | ||
| Guihiba | GHB | 13 |
| Quechua | QUE | 22 |
| Ticuna | TIC | 65 |
| Rondonian Surui | SUR | 47 |
| Karitiana | KAR | 57 |
| Southwest Asia (6)a | ||
| Yemenite Jews | YMJ | 43 |
| Kuwaiti | KWT | 16 |
| Druze | DRU | 95 |
| Samaritans | SAM | 41 |
| Palestinians | PAL | 51 |
| Palestinian Arabs | PLA | 66 |
Italicized population data was taken from the HGDP data unless otherwise stated.
ITALIANS: HGDP Northern Italians and Tuscans.
MONGOL: HGDP Mongolian and Daur.
MANCHU: HGDP Hezhen, Orogen, and Xibo.
LOLO: HGDP Lahu, Naxi, Tujia, and Yiza.
HMONG: HGDP Miaozu and She.
Population region. Number in parentheses denotes number of populations.
Ghidoni et al.5
Winkler et al.17
Skipper et al.16
Pittman et al.15
Stefansson et al.1
DNA samples for 57 populations were extracted from lymphoblastoid cell lines. The cell lines were established and/or maintained in the lab of Kenneth K. and Judith R. Kidd at Yale University, via common techniques described elsewhere.18,19 Some cell lines were established by the Coriell Cell Repositories and others by the National Laboratory for the Genetics of Israeli Populations at Tel-Aviv University. The DNA for nine other populations samples were obtained as DNA only from colleagues or the Coriell Cell Repositories. All samples were collected with informed consent by participants and with approval by all relevant institutional review boards.
SNPs
We typed a total of 90 SNPs covering approximately 600 Kb within the boundaries of the inversion with an average of one SNP every 6.6 Kb. Of the 90 SNPs, 39 were typed with Applied Biosystems TaqMan assays and the other 51 were typed on a custom Illumina bead array (Table S1, available online). All TaqMan markers were typed on 46 populations. Some samples from additional populations were typed for a subset of the markers either because only a limited amount of DNA was available or because the samples were included to extend initial findings. These additional populations include Lisongo, Zaramo, Somali, Kuwaiti, Greeks, Toscani, Roman Jews, Sardinians, Spanish Basque, Catalan, Mohanna, Negroid Makrani, Hazara, Thoti, Kachari, Papua-New Guineans, Samoans, Malaysians, and Guihiba. Illumina markers were typed on all populations with the exception of the Spanish Basque, Catalan, and Malaysians. TaqMan assays were performed in 384 well plates with the use of ∼50–100 ng of DNA per well. Results were analyzed with the ABI Prism Sequence Detection System.
FiberFISH
We confirmed the presence of an inverted chromosome in a single heterozygous Irish sample by using fiberFISH. DNA was obtained from a lymphoblastoid cell line during interphase. The interphase chromosomes were then probed with two bacterial artificial chromosomes (BACs) within the boundaries of the inversion (413P22 and 243L6) and with another probe that fell outside of the inversion (79O18). In noninverted chromosomes 243L6 is situated next to 79O18, and in inverted chromosomes 413P22 is situated next to 79O18.
STRPs
We typed four STRPs within the boundaries of the inversion (Table S2). STRPs were identified by Tandem Repeat Finder. STRPs were typed via PCR with the use of fluorescently labeled primers (Table S2). Lengths of PCR products were determined on an Applied Biosystems 3100 sequencer.
Analyses
Haplotypes based on SNPs were estimated with fastPHASE;20 haplotypes incorporating STRPs were estimated with PHASE.21,22 The MRCA of the inversion was estimated via the technique described by Stephens et al.23
Results
SNPs within the Inversion Region
The allele frequencies for all 90 SNPs in all 46 populations are available in ALFRED. On the basis of the 2005 Stefansson et al. study and disease-association studies, we used alleles at 21 SNPs (Table 2) to identify inversion (H2) chromosomes. LD between the SNPs defining the inversion, i.e., the H2 haplotype (Table 2), and haplotypes including all SNPs allowed us to identify the allelic configuration on the inverted chromosomes in each population (Figure 1). Of the 90 SNPs, 65 (72.2%) were polymorphic on the H1 chromosomes but monomorphic on the H2 inversion chromosomes (Table S1). For five of these 65 SNPs, the H2 allele was rare on the H1 chromosomes. For 21 of the 90 SNPs (23.3%), one allele was specific to the H1 chromosomes and the other was specific to the H2 inversion chromosomes. Only one of the 90 SNPs that we typed, rs1724427, is monomorphic on the H1 chromosomes and polymorphic on the H2 chromosomes. Three of the 90 SNPs (3.3%) appeared to be polymorphic on both the H1 and H2 chromosomes. Although the typing results for these three SNPs are reproducible, this may not represent true polymorphism on H2 chromosomes, because almost all evidence is based on SNP “homozygosity” even though there was clear H1/H2 haplotype heterozygosity. A polymorphism directly nearby that interferes with the probe or a deletion at this site on the H2 chromosome leading to effective hemizygosity could also explain the data. More studies of these instances will need to be undertaken.
Table 2.
Twenty-One Inversion-Marking SNPs
| SNP Name | H2 Allele | H1 Allele |
UCSC Absolute Position (bp) |
No. of Populations With Data |
|---|---|---|---|---|
| rs241039 | T | A | 41,070,456 | 62 |
| rs434428 | A | G | 41,081,467 | 49 |
| rs241027 | G | A | 41,091,261 | 46 |
| rs2049515 | T | C | 41,117,639 | 49 |
| rs10491144 | C | A | 41,128,907 | 49 |
| rs10514879 | A | G | 41,158,754 | 63 |
| rs2902662 | A | G | 41,162,708 | 46 |
| rs11079718 | T | A | 41,195,723 | 46 |
| rs1396862 | A | G | 41,258,778 | 46 |
| rs1078830 | C | T | 41,301,901 | 46 |
| rs916793 | A | G | 41,310,477 | 55 |
| rs17650901 | C | T | 41,395,527 | 46 |
| rs17651213 | A | G | 41,407,760 | 46 |
| rs1052553 | G | A | 41,429,725 | 46 |
| E_TAUIVS11_10 | C | T | 41,447,563 | 46 |
| rs9468 | C | T | 41,457,408 | 63 |
| rs12150447 | C | A | 41,483,977 | 59 |
| rs2838 | G | A | 41,497,167 | 63 |
| rs1468241 | C | A | 41,551,932 | 46 |
| rs1528075 | G | T | 41,576,231 | 46 |
| rs1528072 | A | C | 41,592,502 | 58 |
Figure 1.
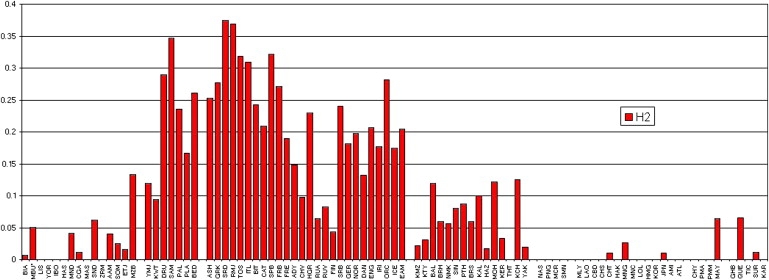
MAPT Inversion Frequencies
This graph shows the frequencies of the H2 (red) haplotype in 90 populations. The populations are grouped by regions: Africa, Southwest Asia, Europe, Central Asia, the Pacific, East Asia, North America, and South America. As we see, the H2 haplotype is found most predominantly in Southwest Asia, Europe, and Central Asia. All four Mbuti inversion chromosomes have the H1 allele at site rs9468, and two have the H1 allele at rs2049515. In rs9468, the H1 allele is found in P. paniscus but the H2 allele is found in P. troglodytes and G. gorilla. In rs2049515, the H1 allele is found in all of our NHPs.
It should be noted that we assume that all chromosomes with the H2 haplotype are in fact in the inverted orientation. As mentioned earlier, the molecular equivalence of the inversion and the H2 haplotype was first identified by Stefansson et al.1 They used the RB-11 BAC clone library, which they identified as being an H1/H2 heterozygote by using the dinucleotide marker DG17S142 and a 238 bp deletion that identified H2 chromosomes. Gijselinck et al., using FISH on mechanically stretched metaphase chromosomes, first visualize the inversion in H2/H2 homozygous individuals compared to H1/H1 homozygous indivduals.24 Zody et al.12 used metaphase FISH to confirm the association between two known H2 marker SNPs and an actual inversion phenotype in 25 HapMap cell lines (three of the chromosomes were H2). We have used a tricolor fiberFISH method to cytogenetically confirm the inversion in a heterozygous Irish sample (Figure 2). Thus, several H2-specific markers have been shown to cytogenetically identify the inversion in the different studies involving five H2 chromosomes and 47 H1 chromosomes. Unfortunately, these cases all represent Northwestern Europeans, or an individual of unknown ancestry, in the case of the RP-11 BAC. We feel confident that these results can be extrapolated throughout the rest of Europe and into Southwest Asia and North Africa; however, furthur confirmation in these regions is desirable. For the present, we are considering the H2 haplotype and the inversion to be equivalent.
Figure 2.
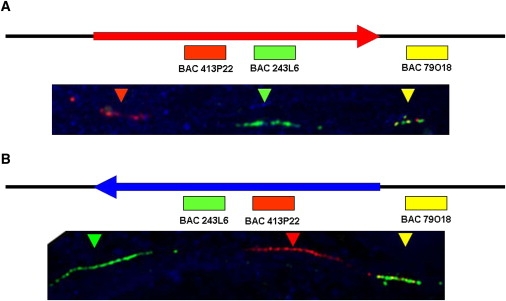
FiberFISH in a Single Inversion-Heterozygous Individual from Ireland
(A) The H1 orientation with a schematic at the top. The red and green probes fall within the inversion, and the yellow probe is outside the inversion. The H1 orientation is, from left to right, BAC 413P22 (red), BAC 243L6 (green), BAC 79O18 (yellow).
(B) The H2 orientation with a schematic at the top. The H2 orientation is, from left to right, BAC 243L6 (green), BAC 413P22 (red), BAC 79O18 (yellow).
The Comparable Chromosome Region in Nonhuman Primates
We also typed all 90 SNPs on 15 NHPs. Using our 21 inversion-marking SNPs, we compiled a consensus haplotype for NHPs at this region. For the most part the NHPs were monomorphic at these 21 sites (only three heterozygotes: one Gorilla and two Pongo). In general the alleles were consistent across all five species, with a few minor exceptions. The consensus haplotype has 13 SNPs with alleles identical to the H1 haplotype, seven that are identical to the H2 haplotype, and one that could not be determined (Table S2). The alleles do not seem to be randomly interspersed, and there are runs of H1 alleles and runs of H2 alleles. The longest H2 run occurs in the region of the MAPT gene, in agreement with the findings of Holzer et al.11 Looking at the two Pan species, we see that both are homozygous for the H1 allele at 11 sites and that P. troglodytes is homozygous for H2 at six sites whereas P. paniscus is homozygous for H2 at five sites. The alleles at four sites in P. troglodytes and five sites in P. paniscus are unknown because we were unable to type those sites in these species. One interesting aspect of the two Pan species is that at site rs9468 P. troglodytes is homozygous for the H2 allele whereas P. paniscus is homozygous for the H1 allele. Gorilla is also homozygous for the H2 allele at this site, and we were unable to type rs9468 in the other two NHP species. Pongo differs from the rest of the NHPs at two sites (rs11079718 and rs1396862). Both sites are homozygous for the H2 allele in Pongo and homozygous for H1 in the other species that we have data on. Hylobates differs from the NHP consensus of inversion marker SNPs at one site (rs1528072), which is homozygous for the H1 allele, whereas all other NHP in this study were homozygous for the H2 allele at this site.
Also in the NHP, we looked at the SNPs that are polymorphic only on H1 chromosomes and compared the results to see whether the allele in NHP was the same allele that is found on the human inversion. We were able to type some of the NHPs at 62 of the 65 sites. All but four of the 62 H1 polymorphic sites had the same genotype in all species. At two sites (rs171443 and rs2066899), Hylobates and Pongo differed from the Gorilla and Pan samples. At another site (rs2301732), Hylobates alone was different in comparison to the other four species. At the final site (rs878917), Gorilla differed from all other species. At 55 of the 62 sites, the NHP allele was the same as the H2 allele, suggesting that the inversion arose on a chromosome that was mostly ancestral but that a few mutations accumulated before the inversion occurred. Of the SNPs that are polymorphic only on human H1 chromosomes, five showed a pattern in which the allele found on H2 chromosomes was rare on the H1 chromosomes. The H2 allele was also the allele that was identified as ancestral in four out of five of these SNPs. These results support the hypothesis that the inversion initially arose on an ancient chromosome or is the ancient chromosome (Table S3).
Inversion Distribution
On the basis of haplotypes composed of SNPs that have an inversion-specific allele in our populations as well as in 24 additional populations found in the literature1,5,13–15,17 (Figure 3), we show that the inversion is primarily found in Europeans and Southwest Asians. Other studies in the literature duplicate inference on some samples with the use of different SNPs.25,26 It also is observed at low levels in Africans, Northwest Asians, Central Asians, Siberians, and Amerindians. The inversion is almost completely absent in East Asia and the Pacific Islands.
Figure 3.
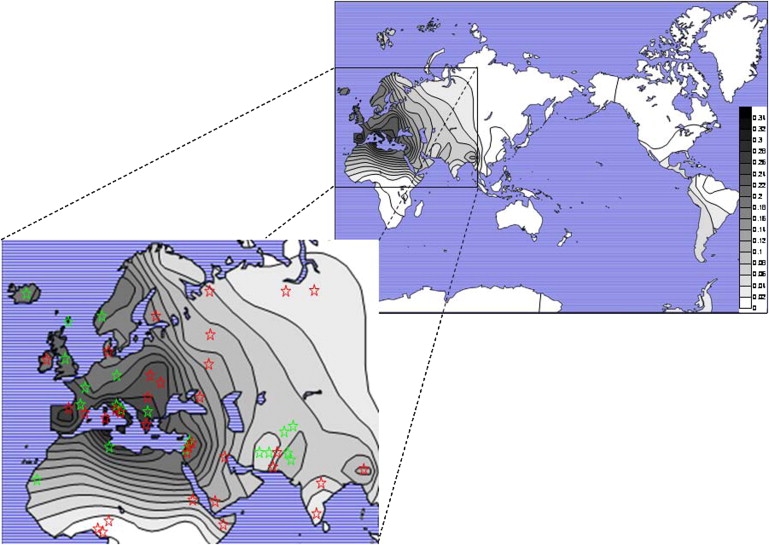
Global Distribution of the MAPT Inversion
The global distribution of H2 frequencies graphed on a world map, with an enlarged section showing Europe, Northern Africa, and Central Asia. In the enlarged map, populations are marked with stars; red stars represent data on populations typed in the Kidd lab, and green stars represent frequencies taken from the literature.
The inversion haplotype is found at highest frequency in Mediterranean regions of Southwest Asia and Europe (31.6% in Druze, 31% in Samaritans, 23.5% in Palestinians, 26% in Bedouins, 23.9% in French Basques, 32.2% in Spanish Basques, 20.9% in Catalans, 27.7% in Greeks, 37.5% in Sardinians, 31.9% in Toscani, and 36.8% in Roman Jews) and at moderately high levels in Northern Africa (13.3% in the Mozabite). It is also found at a high frequency in Ashkenazi Jews (25.6%), which we have shown to group with the Southwest Asians.27 Elsewhere in Europe, we see that the frequency is high in Western, Central, and Southeast Europe (18.9% in French, 15% in Danes, 17.7% in the Irish, 28% in Orcadians, 21.4% in European Americans, 23.9% in Hungarians, and 15.7% in the Adygei) and much lower in Eastern and Northern Europe (9.8% in the Chuvash, 6% in the Archangel Russians, 9.4% in the Vologda Russians, and 4.3% in the Finns) and on the Arabian Peninsula (11.9% in the Yemenite Jews and 9.4% in Kuwaitis).
Outside of Europe and Southwest Asia, the inversion haplotype is found at low frequencies. In Africa it occurs in Mandenka (4%), Biaka Pygmies (0.7%), Mbuti Pygmies (5.1%), Chagga (1.1%), Sandawe (6.3%), Somali (2.5%), and Ethiopian Jews (1.6%); it is also seen in African Americans (4%), probably from European admixture, given that it is not seen in our Nigerian samples. The presence of the inversion haplotype in Africans can be explained in three ways: by the inversion initially arising in Africa (or having persisted in the ancestral primate orientation, as suggested by Zody et al.12) and drifting to high levels in Europe; by being introduced by gene flow from Europe; or by being the ancestral haplotype to the inversion but being in the noninverted orientation. A combination of all three is also possible. However, more evidence is needed to determine whether or not the inversion originated in Africa.
The presence of the inversion in the Komi Zyrianes (2.2%), Khanty (3%), Balochi (12%), Brahui (6%), Sindhi (8%), Pathan (8.7%), Burusho (6%), Kalash (10%), Mohanna (12.2%), Negroid Makrani (5.6%), Hazara (3.3%), and Keralites (3.3%) is consistent with a clinal distribution across Asia. In East Asia it is seen only at extremely low frequencies in three populations (Mongols, Taiwan Chinese, and Japanese) and could be the result of admixture or just a very low frequency in the region, making it unlikely to be seen in any sample of only about 100 chromosomes. In Amerindians, the inversion is seen in the Maya (6.4%), Quechua (6.5%), and Rondonian Surui (1.1%). Again, this is probably the result of European admixture, especially in our samples of Maya and Quechua, in which many other loci also indicate small amounts of historic (not recent) European admixture.
Inversion Origin
To better understand the origin of the inversion, we determined on which H1 background it initially arose. We studied 11-SNP haplotypes that contained three inversion marker SNPs and eight SNPs that are polymorphic only on H1 chromosomes (Figure 4). We chose the eight SNPs because they showed the greatest difference in allele frequency between Africa and Southwest Asia, the two most likely regions in which the inversion may have arisen given its distribution. We identified an H1 haplotype (blue stripes) that differs from the H2 haplotype (red stripes) only at the inversion marker sites and is therefore the likely haplotype on which the inversion initially arose. This haplotype is found throughout the world at an average frequency of 7.8%. It is most frequent in Africa ranging from 6.9% in the Mbuti Pygmies to 25% in the Biaka Pygmies with an average frequency of 14.8%. It is much less frequent in Southwest Asia, ranging from 4.8%–9.2% with an average frequency of 6.5%. These data support an African origin of the inversion, but are not sufficient to rule out a Southwest Asian origin.
Figure 4.
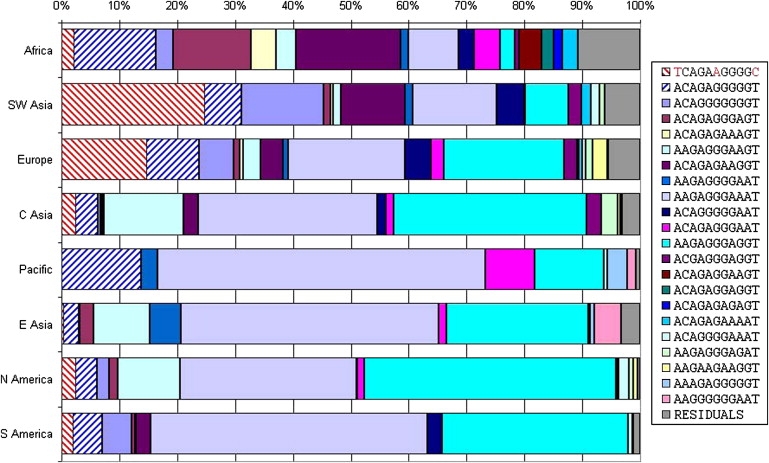
Eight H1 Polymorphic SNPs and Three Inversion-Marking SNPs
The frequencies of haplotypes composed of eight H1 polymorphic SNPs that display a difference in frequency between Africa and Southwest Asia and three inversion marking SNPs. The inversion (red stripes) is most similar to the blue-striped haplotype (different only at the three inversion-marking sites). The blue-striped haplotype is more common in Africa than in Southwest Asia. The three inversion-marking SNPs are rs11079718, rs1396862, and rs1078830, with alleles marked in red for the inversion. The eight other SNPs, in order, are: rs242924, rs242940, rs171440, rs173365, rs171443, rs4616318, rs962885, and rs242933.
Most Recent Common Ancestor of the Inversion
We used four STRPs that fall within the inversion region (Table 3) to estimate the date of the MRCA of the inversion. Haplotype frequencies were estimated with the use of the four STRPs and six of the inversion-marking SNPs, for a total of 3968 total chromosomes. There were 3657 H1 chromosomes and 311 H2 chromosomes. There were 360 different H1 haplotypes and 47 H2 haplotypes, for a total of 407 different haplotypes. Of the 47 H2 haplotypes, we found that there are two possible ancestral haplotypes: the most common haplotype and another haplotype that accounts for most of the African inversion chromosomes. The two possible ancestral haplotypes have a one-repeat difference at one STRP. Both STRP alleles can also be found on H1 chromosomes. The most common H2 haplotype of the 311 inversion chromosomes was found at a frequency of 0.519. On the other hand, the most common haplotype in Africa accounts for six out of seven of the non-African-American African H2 chromosomes. It also accounts for 23.7% of the Southwest Asian H2 chromosomes. To calculate the number of generations to the MCRA, we estimated the STR mutation rate to fall in the range of 0.0005–0.001 and, given that the STRPs fall within the inversion, we set the recombination rate at 0. If we assume that the most common haplotype is the ancestral haplotype, we get an estimate of 656.8–1313.6 generations. Assuming an average generation time of 25 years, this puts the MCRA at 16,400–32,800 years ago. However, if we assume that the African haplotype is the ancestral haplotype, we get an estimate of 2167.4–4334.7 generations. With 25 years per generation, this puts the MCRA at 54,200–108,400 years ago.
Table 3.
STRPs in 17q21 Inversion
| STRP | Base Position | Base-Pair Repeats | Distance to Next STRP (bp) | No. of Populations | Size Range | Most-Common H2 |
|---|---|---|---|---|---|---|
| MAPT07 | 41,328,075 | 2 | 7979 | 46 | 15–25 | 19 |
| MAPT08 | 41,320,096 | 4 | 16,495 | 46 | 7–13 | 11 |
| MAPT09 | 41,303,601 | 2 | 139,891 | 46 | 13–23 | 14 |
| MAPT14 | 41,163,710 | 4 | 46 | 10–20 | 10 |
This recent date for the MRCA is also supported by our SNP data. Of the 90 SNPs typed, only four were variable on the H2 chromosomes, whereas 68 of the 90 are variable on the H1 chromosomes. This lack of polymorphism on the H2 chromosomes in comparison to H1 chromosomes would suggest that the H2 inversion is younger than the H1 orientation.
Discussion
Global Distribution of Inversion
We show that the 17q21 inversion, often thought to be found at levels of ∼20% throughout Europe, actually shows a great range of frequencies within Europe (∼ 5%–37.5%). The H2 haplotype identifies the inversion and shows that the inversion is most frequent around the Mediterranean and decreases outward in all directions (Figure 2). The H2 haplotype is found at its highest African frequency in the Mozabite of North Africa, at low levels in Northwest Africa, Central Africa, and Eastern Africa, and is absent in West Africa, except in the Mandenka. In Central Asia, we see very low (< 5%) frequencies in Northern regions and in India, with the exception of the Kachari. In Pakistan, we see frequencies similar to those in Northern and Eastern Europe. The inversion is practically absent in East Asia and the Pacific (three chromosomes total, one each in Chinese from Taiwan, Mongolians, and Japanese). In Amerindians, the H2 haplotype is seen predominantly in the Maya and the Quechua, two population samples in which we have evidence of European admixture. A caveat is that we are inferring the inversion from haplotypes and not actually detecting the inversion directly through cytogenetics. Given the distinct allelic-haplotype pattern for the H2 haplotype, the restricted STRP alleles, and the cytogenetic validation in four studies—Steffanson et al.,1 Gijselinck et al.24 Zody et al.,12 and ours—this seems justified.
It should be noted that related pairs occur in the HGDP sample but the inclusion of related individuals does not bias allele-frequency estimates. The likely related sets as estimated by Rosenberg in 2006 have been checked, and their genotypes are summarized in Table S5.28
Inversion Origin
Zody et al. proposed a model suggesting that the H2 orientation is the ancestral orientation by using FISH to determine orientation in NHPs.12 We attempted to confirm whether the H1 or the H2 haplotype was ancestral by using SNPs in 15 NHPs. Using our 21 inversion-marker SNPs, we see both runs (contiguous intervals) of H2 alleles and runs of H1 alleles. The longest run of H2 covers the MAPT gene. We also looked at the 65 SNPs that are only polymorphic on the H1 chromosome in humans. Most of the NHP alleles matched the allele found on the H2 chromosomes. Some of the SNPs showed different alleles across the different species, including differences between the two Pan species (see Supplemental Data). These results are inconclusive in determining the ancestral orientation of this region; however, the results with the 65 H1 polymorphic SNPs on H2 chromosomes suggest that the H2 inversion is on an ancient haplotype. This confirms the caveat mentioned by Iyengar et al. that using NHP genotypes to determine the ancestral alleles for Homo sapiens may not always be an effective method.29
Given the global distribution described here combined with the data of Zody et al., we propose a model in which the H2 orientation is the NHP ancestral orientation; however, the H1 orientation is ancestral in humans. Under this theory, sometime after the divergence of Pan and Homo the region inverted to the H1 orientation in the Homo line. The H1 then rose to fixation. Then, in modern humans the inversion occurred once again, leading to the H2 chromosomes found in humans. Zody et al. showed that the region is susceptible to inversion, so it is not impossible to imagine an inversion occurring twice on the Homo line, and this model may also explain the difference in the structure between the H2-oriented chromosomes in Homo and Pan (the duplication region flanking the human H2 is 331.5 kb larger than the nonhuman primate H2, whereas the human H1 duplication region is only 59.5 kb larger than the nonhuman primate H2).12 Completion of the Neanderthal genome may be able to supply more evidence with respect to these models.
Our data can support an African or Southwest Asian origin for the inversion. In the African scenario, the inversion event occurred in Africa (likely an East or Central African population). It then crossed into Southwest Asia, where it rose to high frequencies either by genetic drift or by positive selection, and it then entered Europe, where it exists at low to moderate levels. This scenario is supported by the presence of an African-specific haplotype of SNPs polymorphic on the inversion background that is identical to the most common H1 haplotype (Figure 3). We also looked at which H1-only polymorphic SNP haplotype background is most similar to the H2 inversion haplotype. The background haplotype matching the inversion is more common in Africa compared to Southwest Asia. This result adds support to an African origin (Figure 4 and Figure S1). The other scenario, a Southwest Asian origin, argues that the inversion occurred in Southwest Asia, where it rose to moderately high frequencies, then entered Europe. Under this scenario, the presence of the H2 haplotype in Africa could be explained in either or both of two ways. The first is via gene flow back into Africa. The second is that the H2 haplotype chromosomes in Africa are actually in the H1 noninverted orientation. Cytogenetic determination in African chromosomes would be needed to test for this possibility. Under either scenario, the occurrence of the inversion in Europe is probably due to the Neolithic inversion.
A third theory has been posited for the origin of the inversion. Hardy et al. suggested that the H2 orientation may have been introduced to humans by Neanderthal.30 This model would fit with a Southwest Asian model of origination, because some of the highest frequencies of the inversions are found in Israel and Neanderthal fossils have been found in Israel. Though we think that this scenario is unlikely, more evidence is needed with respect to Neanderthal's genetic contribution to modern humans before any strong conclusion can be made. Once again, this scenario can best be addressed once the Neanderthal genome is completed.
Selection or Neutral Evolution?
Stefansson et al. proposed that high frequencies of the inversion in Europe are due to positive or balancing selection.1 Their analyses are limited to the Icelandic populations and are based on the fertility rate of women with at least one copy of the H2 chromosome compared to those without. Though the frequency of the H2 chromosome is high in Iceland, it is much higher in Southern Europe and Southwest Asia. It would be important to test these regions for selection in a similar manner to confirm the Icelandic result.
Though we cannot rule out selection occurring at this locus, the cline that we present here can just as easily be explained by a demographic event that occurred during the Neolithic expansion out of Southwest Asia into Europe without invoking natural selection.31 Under this neutral model, the inversion initially arose in Africa or Southwest Asia. It then rose to high levels in the Mediterranean region of Southwest Asia. From there, it entered Southern Europe. From Southern Europe, the frequencies lessened as migration carried the inversion throughout the rest of Europe.
The absence of the inversion in East Asia can be explained by the founder event(s) that eliminated alleles at multiple loci in the eastward expansion of modern humans from Southwest Asia. Alternatively, the origin in Southwest Asia could have occurred after this expansion.
Most Recent Common Ancestor
We estimated the MRCA of the extant inversion haplotypes to be 16,400–32,800 or 54,200–108,400 years, depending on where the inversion arose. If this estimate is correct, it contrasts sharply with the age estimates of Stefansson et al., Cruts et al., and Zody et al. of 3 million years, 3 million years, and 2.3 million years, respectively.1,12,32 The difference reflects the approaches and methods used. Stefansson et al. used SNPs and a maximum-parsimony tree, which estimates the age of the divergence of the DNA sequence of the H2 haplotype from that of H1 haplotypes. Zody et al. used a similar method.1,12 Our method, in contrast, estimates the MRCA of the extant inversion haplotypes. Both estimates can be correct. As seen by our analysis of the NHP alleles, the inversion probably arose on an ancient haplotype, which fits the Stefansson and Zody data.1,12 However, the restricted global distribution of the inversion and restricted STRP and SNP variation on the inversion support a more recent origin in Africa or Southwest Asia. These data support our dates for the MRCA. As stated above, we believe that it is possible that the H2 haplotype and order may be the ancestral orientation of the primate lineage as a whole, but that H1 is the ancestral allele in Homo sp., given the evidence of recurrence and the difference in structure of the human H2 inversion.12 Our data combined with that of Stefansson et al. and Zody et al. suggest that the inversion event occurred recently; however, the haplotype that it arose on was quite ancient.1,12
Conclusions
We have shown here that the 17q21 inversion is found at its highest frequencies in the Mediterranean region in Southern Europe, Southwest Asia, and North Africa. We have also shown that the MRCA of the inversion is much younger than the estimated date of divergence for the H1 and H2 haplotypes. Though we cannot rule out selection acting at the region, we think that both the restricted global distribution and the recent MRCA fit with a neutral model coinciding with an origin in Africa or Southwest Asia followed by demographic events occurring during the migration out of Africa into Southwest Asia and/or the Neolithic expansion out of Southwest Asia into Europe.
Acknowledgments
This research was funded in part by National Institutes of Health grant GM57672. We would like to thank Elena Grigorenko and Carolyn Yrigollen for providing help with the STRP typing. We would also like to thank all of the collaborators who helped to collect the samples, the National Laboratory for the Genetics of Israeli Populations at Tel-Aviv University, the Coriell Cell Repositories, and the thousands of individuals who contributed samples for studies like this.
Supplemental Data
Web Resources
The URLs for data presented herein are as follows:
The International HapMap Project, http://hapmap.org/
Online Mendelian Inheritance in Man, http://www.ncbi.nlm.nih.gov/Omim
Tandem Repeat Finder, http://tandem.bu.edu/trf/trf.html
References
- 1.Stefansson H., Helgason A., Thorleifsson G., Steinthorsdottir V., Masson G., Barnard J., Baker A., Jonasdottir A., Ingason A., Gudnadottir V.G. A common inversion under selection in Europeans. Nat. Genet. 2005;37:129–137. doi: 10.1038/ng1508. [DOI] [PubMed] [Google Scholar]
- 2.Baker M., Litvan I., Houlden H., Adamson J., Dickson D., Perez-Tur J., Hardy J., Lynch T., Bigio E., Hutton M. Association of an extended haplotype in the tau gene with progressive supranuclear palsy. Hum. Mol. Genet. 1999;8:711–715. doi: 10.1093/hmg/8.4.711. [DOI] [PubMed] [Google Scholar]
- 3.Pastor P., Ezquerra M., Tolosa E., Muñoz E., Martí M.J., Valldeoriola F., Molinuevo J.L., Calopa M., Oliva R. Further extension of the H1 haplotype associated with progressive supranuclear palsy. Mov. Disord. 2002;17:550–556. doi: 10.1002/mds.10076. [DOI] [PubMed] [Google Scholar]
- 4.Ballatore C., Lee V.M., Trojanowski J.Q. Tau-mediated neurodegeneration in Alzheimer's disease and related disorders. Nat. Rev. Neurosci. 2007;8:663–672. doi: 10.1038/nrn2194. [DOI] [PubMed] [Google Scholar]
- 5.Ghidoni R., Signorini S., Barbiero L., Sina E., Cominelli P., Villa A., Benussi L., Binetti G. The H2 MAPT haplotype is associated with familial frontotemporal dementia. Neurobiol. Dis. 2006;22:357–362. doi: 10.1016/j.nbd.2005.11.013. [DOI] [PubMed] [Google Scholar]
- 6.Koolen D.A., Vissers L.E., Pfundt R., de Leeuw N., Knight S.J., Regan R., Kooy R.F., Reyniers E., Romano C., Fichera M. A new chromosome 17q21.31 microdeletion syndrome associated with a common inversion polymorphism. Nat. Genet. 2006;38:999–1001. doi: 10.1038/ng1853. [DOI] [PubMed] [Google Scholar]
- 7.Sharp A.J., Hansen S., Selzer R.R., Cheng Z., Regan R., Hurst J.A., Stewart H., Price S.M., Blair E., Hennekam R.C. Discovery of previously unidentified genomic disorders from the duplication architecture of the human genome. Nat. Genet. 2006;38:1038–1042. doi: 10.1038/ng1862. [DOI] [PubMed] [Google Scholar]
- 8.Shaw-Smith C., Pittman A.M., Willatt L., Martin H., Rickman L., Gribble S., Curley R., Cumming S., Dunn C., Kalaitzopoulos D. Microdeletion encompassing MAPT at chromosome 17q21.3 is associated with developmental delay and learning disability. Nat. Genet. 2006;38:1032–1037. doi: 10.1038/ng1858. [DOI] [PubMed] [Google Scholar]
- 9.Kwok J.B., Teber E.T., Loy C., Hallupp M., Nicholson G., Mellick G.D., Buchanan D.D., Silburn P.A., Schofield P.R. Tau haplotypes regulate transcription and are associated with Parkinson's disease. Ann. Neurol. 2004;55:329–334. doi: 10.1002/ana.10826. [DOI] [PubMed] [Google Scholar]
- 10.Myers A.J., Pittman A.M., Zhao A.S., Rohrer K., Kaleem M., Marlowe L., Lees A., Leung D., McKeith I.G., Perry R.H. The MAPT H1c risk haplotype is associated with increased expression of tau and especially of 4 repeat containing transcripts. Neurobiol. Dis. 2007;25:561–570. doi: 10.1016/j.nbd.2006.10.018. [DOI] [PubMed] [Google Scholar]
- 11.Holzer M., Craxton M., Jakes R., Arendt T., Goedert M. Tau gene (MAPT) sequence variation among primates. Gene. 2004;341:313–322. doi: 10.1016/j.gene.2004.07.013. [DOI] [PubMed] [Google Scholar]
- 12.Zody M.C., Jiang Z., Fung H.C., Antonacci F., Hillier L.W., Cardone M.F., Graves T.A., Kidd J.M., Cheng Z., Abouelleil A. Evolutionary toggling of the MAPT 17q21.31 inversion region. Nat. Genet. 2008;40:1076–1083. doi: 10.1038/ng.193. [DOI] [PMC free article] [PubMed] [Google Scholar]
- 13.Li J.Z., Absher D.M., Tang H., Southwick A.M., Casto A.M., Ramachandran S., Cann H.M., Barsh G.S., Feldman M., Cavalli-Sforza L.L., Myers R.M. Worldwide human relationships inferred from genome-wide patterns of variation. Science. 2008;319:1100–1104. doi: 10.1126/science.1153717. [DOI] [PubMed] [Google Scholar]
- 14.Jakobsson M., Scholz S.W., Scheet P., Gibbs J.R., VanLiere J.M., Fung H.C., Szpiech Z.A., Degnan J.H., Wang K., Guerreiro R. Genotype, haplotype and copy-number variation in worldwide human populations. Nature. 2008;451:998–1003. doi: 10.1038/nature06742. [DOI] [PubMed] [Google Scholar]
- 15.Pittman A.M., Myers A.J., Duckworth J., Bryden L., Hanson M., Abou-Sleiman P., Wood N.W., Hardy J., Lees A., de Silva R. The structure of the tau haplotype in controls and in progressive supranuclear palsy. Hum. Mol. Genet. 2004;13:1267–1274. doi: 10.1093/hmg/ddh138. [DOI] [PubMed] [Google Scholar]
- 16.Skipper L., Wilkes K., Toft M., Baker M., Lincoln S., Hulihan M., Ross O.A., Hutton M., Aasly J., Farrer M. Linkage disequilibrium and association of MAPT H1 in Parkinson disease. Am. J. Hum. Genet. 2004;75:669–677. doi: 10.1086/424492. [DOI] [PMC free article] [PubMed] [Google Scholar]
- 17.Winkler S., König I.R., Lohmann-Hedrich K., Vieregge P., Kostic V., Klein C. Role of ethnicity on the association of MAPT H1 haplotypes and subhaplotypes in Parkinson's disease. Eur. J. Hum. Genet. 2007;15:1163–1168. doi: 10.1038/sj.ejhg.5201901. [DOI] [PubMed] [Google Scholar]
- 18.Anderson M.A., Gusella J.F. Use of cyclosporin A in establishing Epstein-Barr virus-transformed human lymphoblastoid cell lines. In Vitro. 1984;20:856–858. doi: 10.1007/BF02619631. [DOI] [PubMed] [Google Scholar]
- 19.Sambrook J., Fritsch E.F., Maniatis T. Quantitation of DNA and RNA. In: Ford N., Nolan C., Ferguson M., editors. Molecular cloning: a laboratory manual. Second Edition. Cold Spring Harbor Laboratory Press; Cold Spring Harbor, NY: 1989. [Google Scholar]
- 20.Scheet P., Stephens M. A fast and flexible statistical model for large-scale population genotype data: applications to inferring missing genotypes and haplotypic phase. Am. J. Hum. Genet. 2006;78:629–644. doi: 10.1086/502802. [DOI] [PMC free article] [PubMed] [Google Scholar]
- 21.Stephens M., Smith N.J., Donnelly P. A new statistical method for haplotype reconstruction from population data. Am. J. Hum. Genet. 2001;68:978–989. doi: 10.1086/319501. [DOI] [PMC free article] [PubMed] [Google Scholar]
- 22.Stephens M., Donnelly P. A comparison of bayesian methods for haplotype reconstruction from population genotype data. Am. J. Hum. Genet. 2003;73:1162–1169. doi: 10.1086/379378. [DOI] [PMC free article] [PubMed] [Google Scholar]
- 23.Stephens J.C., Reich D.E., Goldstein D.B., Shin H.D., Smith M.W., Carrington M., Winkler C., Huttley G.A., Allikmets R., Schriml L. Dating the origin of the CCR5-Delta32 AIDS-resistance allele by the coalescence of haplotypes. Am. J. Hum. Genet. 1998;62:1507–1515. doi: 10.1086/301867. [DOI] [PMC free article] [PubMed] [Google Scholar]
- 24.Gijselinck I., Bogaerts V., Rademakers R., van der Zee J., Van Broeckhoven C., Cruts M. Visualization of MAPT inversion on stretched chromosomes of tau-negative frontotemporal dementia patients. Hum. Mutat. 2006;27:1057–1059. doi: 10.1002/humu.20391. [DOI] [PubMed] [Google Scholar]
- 25.Evans W., Fung H.C., Steele J., Eerola J., Tienari P., Pittman A., Silva R., Myers A., Vrieze F.W., Singleton A., Hardy J. The tau H2 haplotype is almost exclusively Caucasian in origin. Neurosci. Lett. 2004;369:183–185. doi: 10.1016/j.neulet.2004.05.119. [DOI] [PubMed] [Google Scholar]
- 26.Fung H.C., Evans J., Evans W., Duckworth J., Pittman A., de Silva R., Myers A., Hardy J. The architecture of the tau haplotype block in different ethnicities. Neurosci. Lett. 2005;377:81–84. doi: 10.1016/j.neulet.2004.11.072. [DOI] [PubMed] [Google Scholar]
- 27.Kidd K.K., Kidd J.R. Human genetic variation of medical significance. Evolution in Health and Disease. In: Stearns S.C., Koella J.C., editors. Second Edition. Oxford University Press; New York: 2008. pp. 51–62. 363 pp. [Google Scholar]
- 28.Rosenberg N.A. Standardized subsets of the HGDP-CEPH Human Genome Diversity Cell Line Panel, accounting for atypical and duplicated samples and pairs of close relatives. Ann. Hum. Genet. 2006;70:841–847. doi: 10.1111/j.1469-1809.2006.00285.x. [DOI] [PubMed] [Google Scholar]
- 29.Iyengar S., Seaman M., Deinard A.S., Rosenbaum H.C., Sirugo G., Castiglione C.M., Kidd J.R., Kidd K.K. Analyses of cross species polymerase chain reaction products to infer the ancestral state of human polymorphisms. Mitochondrial DNA. 1998;8:317–327. doi: 10.3109/10425179809034076. [DOI] [PubMed] [Google Scholar]
- 30.Hardy J., Pittman A., Myers A., Gwinn-Hardy K., Fung H.C., de Silva R., Hutton M., Duckworth J. Evidence suggesting that Homo neanderthalensis contributed the H2 MAPT haplotype to Homo sapiens. Biochem. Soc. Trans. 2005;33:582–585. doi: 10.1042/BST0330582. [DOI] [PubMed] [Google Scholar]
- 31.Cavalli-Sforza L.L., Menozzi P., Piazza A. Princeton University Press; Princeton, New Jersey: 1994. The History and Geography of Human Genes. [Google Scholar]
- 32.Cruts M., Rademakers R., Gijselinck I., van der Zee J., Dermaut B., de Pooter T., de Rijk P., Del-Favero J., van Broeckhoven C. Genomic architecture of human 17q21 linked to frontotemporal dementia uncovers a highly homologous family of low-copy repeats in the tau region. Hum. Mol. Genet. 2005;14:1753–1762. doi: 10.1093/hmg/ddi182. [DOI] [PubMed] [Google Scholar]
Associated Data
This section collects any data citations, data availability statements, or supplementary materials included in this article.