

Abstract
In this issue of The Journal, an article by Schalkwyk et al.1 shows the landscape of allele-specific DNA methylation (ASM) in the human genome. ASM has long been studied as a hallmark of imprinted genes, and a chromosome-wide version of this phenomenon occurs, in a random fashion, during X chromosome inactivation in female cells. But the type of ASM motivating the study by Schalkwyk et al. is different. They used a high-resolution, methylation-sensitive SNP array (MSNP) method for genome-wide profiling of ASM in total peripheral-blood leukocytes (PBL) and buccal cells from a series of monozygotic twin pairs. Their data bring a new level of detail to our knowledge of a newly recognized phenomenon—nonimprinted, sequence-dependent ASM. They document the widespread occurrence of this phenomenon among human genes and discuss its basic implications for gene regulation and genetic-epigenetic interactions. But this paper and recent work from other laboratories2,3 raises the possibility of a more immediate and practical application for ASM mapping, namely to help extract maximum information from genome-wide association studies.
Main Text
Genome-wide association studies (GWAS) have been tremendously successful in localizing candidate genes for susceptibility to common diseases, but they are now coming up against two technical roadblocks: First, most (∼90%) of the suprathreshold disease-association signals are at noncoding SNPs.4–6 Among these statistical signals, which ones are due to bona fide functional regulatory SNPs (rSNPs), and how can these rSNPs be identified? Nowadays, by following GWAS to identify a SNP-tagged chromosomal region of interest, investigators resequence the region to identify all of the variants, and from there they seek to prioritize which ones might be functional. But when a nonsynonymous coding change is still not found, the essential problem remains. Second, because of multiple comparisons, the threshold for significance needs to be set stringently, typically at p < 10−7 or p < 5 × 10⁻⁸, so there are numerous subthreshold peaks that are difficult to interpret. Are some of these signals true positives that should not be discarded? This question can be partly addressed by meta-analyses across multiple GWAS, and in silico predictive methods are also promising.7 But a more direct approach would be to combine statistical genetic evidence from GWAS with functional evidence for the presence of rSNPS. There is good reason to think that such evidence can be provided by the type of mapping shown in the Schalkwyk et al. paper, with the use of the strategy diagrammed here in Figure 1.
Figure 1.
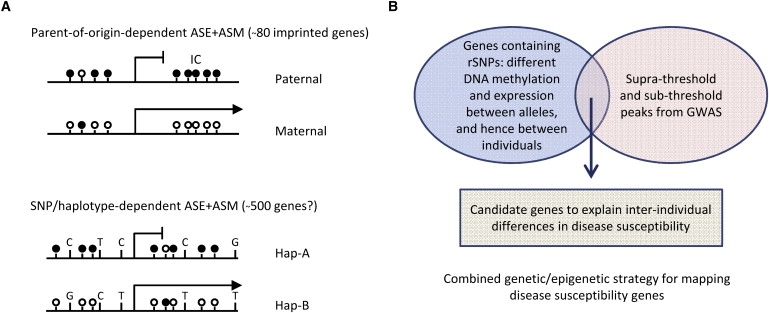
Sequence-Dependent ASM as a Tool for Extracting Maximum Information from GWAS
(A) In genomic imprinting, the ASM is established in gametogenesis and dictated by the parental origin of the allele, with weak or absent effects of local haplotypes. Some imprinted genes show hypermethylation on the paternal allele as shown here, whereas others show hypermethylation of the maternal allele. In successive generations, the imprint is erased and then reset appropriately in gametogenesis, according to the sex of the transmitting parent. Thus genomic imprinting is non-Mendelian. In contrast, SNP- or haplotype-dependent ASM is dictated in cis by the local DNA sequence, regardless of parent of origin. This type of ASM is transmitted in a Mendelian fashion, and its presence is an indication of nearby regulatory SNPs that function, by mechanisms still largely unknown, to confer the allelic asymmetry. Although the number of imprinted genes is reasonably well established, the number of genes with nonimprinted, sequence-dependent ASM is influenced both by tissue type and by the stringency of the cutoffs utilized for scoring the allelic asymmetry. Black circles indicate methylated CpG dinucleotides; white circles, unmethylated CpGs. IC denotes imprinting center.
(B) Schema for extracting maximum information from GWAS by overlapping association signals with data from mapping ASM and ASE. Most GWAS signals, even if they are true positives, are not likely to be the most important functional SNP, but rather serve to tag a functional rSNP nearby, which can confer ASE and/or ASM. Thus, genomic regions scoring as positive by both criteria (suprathreshold or subthreshold statistical associations in GWAS and ASE or ASM by appropriate assays) are likely to be true positives harboring bona fide causal rSNPs. Avoiding false positives will require using stringent criteria for recurrent genotype-dependent ASE and ASM and validating the high-throughput data from microarrays or Nextgen sequencing by independent locus-specific assays.
This idea has a strong precedent in studies of a related phenomenon—allele-specific RNA expression (ASE). In the simplest scenario, ASE, also called the allelic transcript ratio or ATR, can be measured by comparing relative levels of allelic transcripts within a sample by using gene-specific RT-PCR followed by conventional sequencing, Pyrosequencing, or SNaPshot assays, with PCR products from genomic DNA used as the standard for equal biallelic representation. This approach of cDNA-gDNA comparison has been a workhorse tool since the early 1990s in labs studying imprinted genes,8 and it was adapted in 2002 by Yan et al. to search for ASE in a set of nonimprinted genes.9 In their brief report, they described ASE (> 30% expression bias between the two alleles) in 6/13 genes examined, three of these genes showing ASE in > 10% of heterozygous individuals tested. They used lymphoblastoid cell lines from two Centre d'Étude du Polymorphisme Humain (CEPH) families to show that the ASE for two genes (PKD2 [MIM 173910] and CAPN10 [MIM 605286]) was transmitted as a Mendelian trait with the same allele relatively repressed in each informative family member, suggesting a role for cis-acting regulatory polymorphisms in dictating the ASE.
Shortly thereafter, several labs applied this type of analysis, or related methods correlating net mRNA expression with genotypes, in much larger genome-wide surveys.10–19 Recently, Verlaan et al. carried out ASE analysis on primary RNA transcripts by using both high-throughput conventional sequencing and 454/FLX massively parallel sequencing, thereby gaining access to informative intronic SNPs, which substantially increased the number of informative samples.20 As a tool for finding and validating rSNPs, measuring ASE has the major advantage of being internally controlled, comparing expression of the two alleles within one individual rather than measuring associations of SNP genotypes with net expression of the gene across subjects, which can suffer from the limited precision of Q-PCR and microarray assays and unpredictable effects of environmental and trans-acting influences. Still, both approaches are valid, and assessing correlations of haplotypes with net transcript levels arguably gets more directly at the biologically relevant outcome. From all of these studies, sufficient information is now available to allow general conclusions as to the frequency of ASE and the extent to which the allelic expression bias is dictated by cis-acting DNA polymorphisms. In all studies so far, the vast majority of ASE can be accounted for by cis-effects. Estimates of the frequency of ASE vary strongly, depending on the cutoff utilized for the strength of the expression bias and according to the types of cell lines or primary tissues examined; with moderately stringent thresholds, the frequency in some cell types can be up to 30% of genes surveyed.21 Finding the strongest and most-specific rSNPs will depend on examinining the bona fide biological target tissues of a given disease and setting the threshold for ASE more stringently. Using the genuine target tissue for analysis is critically important, because it is already clear that genotype-dependent mRNA expression can be highly tissue specific.19 For some diseases, such as type 2 diabetes mellitus (T2D [MIM #125853]), deciding on the critical target tissue will not be easy.22
As an important adjunct to these studies, Stranger et al. used transcriptome profiling in lymphoblastoid lines from individuals included in HapMap to sort out the relative contributions of SNPs and copy-number variants to interindividual differences in gene expression. They found that, although both SNPs and CNVs contributed, the majority of genotype-dependent expression variation (84%) in these cells was attributable to SNPs, which were not acting as surrogates for the CNVs.23
There is an interesting technical caveat in studying ASE, stemming from the curious phenomenon of random (mosaic) monoallelic expression (RME), which can be observed at certain loci on autosomes24–28 and can sometimes correlate with ASM.27 As pointed out by a recent study using X chromosome inactivation as a marker for clonality, a substantial percentage of human lymphoblastoid lines (from 1% to 25%, depending on the source) are nearly monoclonal.29 This clonal predominance can artifactually eliminate the randomness of RME, which can then be mistaken for ASE. Methods to monitor and correct for this problem have been developed and successfully applied,21 but now that the necessary methodologies for genome-wide profiling have been established with the use of lymphoblastoid lines as a renewable source of RNA, it is likely that future studies will be able to use mostly primary cells and tissues.
Beyond providing evidence for rSNPs being near a gene of interest, can mapping ASE help to close in on the precise positions of these functional SNPs? Proof of principle is starting to appear, and several examples (not intended to be a complete list) are useful to consider here. Forton et al. found recurrent ASE of the IL13 (MIM 147683) gene in lymphoblastoid cells and then used DNA from CEPH families to map the most strongly correlated SNPs, which turned out to be clustered 250 kb upstream of this gene.30 Another example was reported by Schadt et al., who surveyed the genotype dependence of mRNA expression in human livers and aligned their data on putative cis-acting rSNPs with statistically significant signals from multiple GWAS for type 1 diabetes mellitus (T1D [MIM %222100]), thereby arriving at the conclusion that RPS26 (MIM 603701), SORT1 (MIM 602458), and CELSR2 (MIM 604265) are strong candidates for influencing T1D susceptibility.18 Subsequently, Ge et al. generated a genome-wide map of ASE-associated SNPs by using cDNA-gDNA comparisons on high-density Illumina Human1M BeadChips. They tested for associations of haplotypes with the strength of the allelic expression imbalance and zeroed in on a 16 kb regulatory haplotype causing relative overexpression of FAM167A (MIM 610085; also known as C8orf13) and relative underexpression of its neighboring, autoimmune-disease-associated gene, BLK (MIM 191605).21 In an even more recent study, Heap et al. used Nextgen RNA sequencing (RNA-Seq) for genome-wide characterization of ASE in human T cells from four healthy individuals.15 They generated 20 million uniquely mapping 45 bp reads per sample and arrived at an estimate of about 4.6% of heterozygous SNPs showing an allelic representation bias in T cell RNA. They confirmed their conclusions for three loci by using gene-specific assays of PCR/cloning and direct sequencing comparing cDNA versus genomic DNA. Although not among the genes chosen for independent validations, an interesting locus with ASE via the primary sequencing data was CD6 (MIM 186720)—a candidate susceptibility gene for multiple sclerosis (MS [MIM #126200]) from prior GWAS.
Given these already successful outcomes of using ASE to find rSNPs, can mapping ASM make a useful contribution? DNA is a more stable molecule than RNA, and DNA methylation is easily and unambiguously scored by bisulfite sequencing. Moreover, measurements made on genomic DNA average evenly over the entire cell population and cannot be dominated by rare cells or cell types, as can happen with RNA expression. Last but not least, labs studying human genetics simply have more freezers full of DNA than of RNA. Therefore, mapping ASM and overlapping the data with genome-wide association signals is an attractive concept. The new study by Schalkwyk et al. has much to say about this possibility.1 As background to their paper, an important initial proof-of-principle study was done by Kerkel et al., who used MSNP on Affymetrix 250K StyI SNP arrays to examine several human tissues, including PBL, hematopoietic stem cells, and placenta. Their study identified recurrent ASM on various human chromosomes outside of imprinted loci and uncovered a strong correlation of this phenomenon with local SNP genotypes.2 That paper was quickly followed by several other reports, including a study by Zhang et al., who used extensive bisulfite sequencing of PBL DNA to document SNP-dependent ASM in CpG-rich sequences in or near four genes on human chromosome 21.3 In both of these studies, when sequence-dependent ASM was present at a given locus, its dependence on the genotype at closely adjacent SNP(s) was close to absolute. Extending this phenomenon to the well-controlled mouse model system, Schilling et al. did a genome-wide analysis in macrophages from two common laboratory strains (C57BL/6 and BALB/c). They found that ASM was frequent and widely distributed across the genome and that the allelic asymmetry in DNA methylation was largely attributable to cis-acting polymorphisms.31 The availability of dense SNP arrays for analyzing genetic variation in mice should facilitate more studies along these lines with even higher sample throughput.32
Enter the Schalkwyk et al. study, which presents the landscape of ASM in human PBL at sufficiently high resolution to warrant overlapping their gene lists with statistical peaks from GWAS. As noted above, they used MSNP on higher-density Affymetrix 6.0 SNP arrays for genome-wide profiling of ASM in blood leukocytes and buccal cells. They independently validated each of ten examples among the “hits” with ASM by using bisulfite conversion followed by SNaPshot assays. Not surprisingly, they confirmed ASM at several of the loci reported in the earlier study by Kerkel et al., but with the higher-resolution method they were able to compile a much larger list of candidate loci, which their validations strongly suggest are mostly true positives. As is often the case in genomics papers, one of their most useful tables is in the online data, namely Table S3, which shows that more than 150 ASM-associated SNPs, distributed across each of the human chromosomes, are significantly associated with the expression of nearby genes. It will also be useful to follow the convergence of data from independent studies of ASE and ASM; encouragingly, in the Schalkwyk et al. paper, a number of loci with ASM are also represented among the genes found to show ASE in the survey by Ge et al.21 So, from this and each of the other recent studies, ASM seems to be frequently, though not always, linked to ASE.
How can this field move forward? There are still clear limitations to all the available data sets: MSNP relies on methylation-sensitive restriction sites and does not survey all CpG dinucleotides. Also, microarray-based methods are limited by the annoying fact that only a subset of all SNPs is “chipable.” Microarrays, particularly those with custom designs, will still be very useful for high sample throughput, but Nextgen bisulfite sequencing will inevitably become the way to go for analyzing fewer samples at definitive single-base-pair resolution, ultimately eliminating false negatives from incomplete genomic coverage.33
Lastly, a good part of what we know about DNA methylation comes from work in cancer epigenetics, from which we know that most cancers have an altered epigenome, with gains of promoter methylation acting as an alternative to somatic mutation in inactivating tumor suppressor genes.34 In this context, another possibility with potentially broad applications will be opened up by studies combining GWAS and ASM mapping, namely that certain alleles, defined by SNPs, indels, and CNVs, may be more susceptible to becoming hypermethylated in the initiation and progression of human neoplasia. Specific evidence to this effect has already been produced by several labs, including those of Kang et al., who reported an association of p14ARF (CDKN2A [MIM 600160]) polymorphisms with the tendency of this gene to become methylated in colorectal cancers,35 Murrell et al., who found an association of IGF2 (MIM 147470) SNPs or haplotypes with Beckwith-Wiedemann syndrome (BWS [MIM #130650]),36 and Boumber et al., who showed that an indel polymorphism in the PDLIM4 gene (MIM 603422, also known as RIL) affects the propensity of this gene to become methylated in leukemia and colon cancer.37
Web Resources
The URL for data presented herein is as follows:
Online Mendelian Inheritance in Man (OMIM), http://www.ncbi.nlm.nih.gov/Omim/
References
- 1.Schalkwyk L.C., Meaburn E.L., Smith R., Dempster E.L. Am. J. Hum. Genet. 2010;86:196–212. doi: 10.1016/j.ajhg.2010.01.014. this issue. [DOI] [PMC free article] [PubMed] [Google Scholar]
- 2.Kerkel K., Spadola A., Yuan E., Kosek J., Jiang L., Hod E., Li K., Murty V.V., Schupf N., Vilain E. Nat. Genet. 2008;40:904–908. doi: 10.1038/ng.174. [DOI] [PubMed] [Google Scholar]
- 3.Zhang Y., Rohde C., Reinhardt R., Voelcker-Rehage C., Jeltsch A. Genome Biol. 2009;10:R138. doi: 10.1186/gb-2009-10-12-r138. [DOI] [PMC free article] [PubMed] [Google Scholar]
- 4.Nica A.C., Dermitzakis E.T. Hum. Mol. Genet. 2008;17:R129–R134. doi: 10.1093/hmg/ddn285. [DOI] [PMC free article] [PubMed] [Google Scholar]
- 5.Easton D.F., Eeles R.A. Hum. Mol. Genet. 2008;17:R109–R115. doi: 10.1093/hmg/ddn287. [DOI] [PubMed] [Google Scholar]
- 6.Lettre G., Rioux J.D. Hum. Mol. Genet. 2008;17:R116–R121. doi: 10.1093/hmg/ddn246. [DOI] [PMC free article] [PubMed] [Google Scholar]
- 7.Torkamani A., Schork N.J. Bioinformatics. 2008;24:1787–1792. doi: 10.1093/bioinformatics/btn311. [DOI] [PMC free article] [PubMed] [Google Scholar]
- 8.Zhang Y., Tycko B. Nat. Genet. 1992;1:40–44. doi: 10.1038/ng0492-40. [DOI] [PubMed] [Google Scholar]
- 9.Yan H., Yuan W., Velculescu V.E., Vogelstein B., Kinzler K.W. Science. 2002;297:1143. doi: 10.1126/science.1072545. [DOI] [PubMed] [Google Scholar]
- 10.Lo H.S., Wang Z., Hu Y., Yang H.H., Gere S., Buetow K.H., Lee M.P. Genome Res. 2003;13:1855–1862. doi: 10.1101/gr.1006603. [DOI] [PMC free article] [PubMed] [Google Scholar]
- 11.Pastinen T., Sladek R., Gurd S., Sammak A., Ge B., Lepage P., Lavergne K., Villeneuve A., Gaudin T., Brandstrom H. Physiol. Genomics. 2004;16:184–193. doi: 10.1152/physiolgenomics.00163.2003. [DOI] [PubMed] [Google Scholar]
- 12.Pastinen T., Ge B., Gurd S., Gaudin T., Dore C., Lemire M., Lepage P., Harmsen E., Hudson T.J. Hum. Mol. Genet. 2005;14:3963–3971. doi: 10.1093/hmg/ddi420. [DOI] [PubMed] [Google Scholar]
- 13.Pastinen T., Ge B., Hudson T.J. Hum. Mol. Genet. 2006;15(Spec No 1):R9–R16. doi: 10.1093/hmg/ddl044. [DOI] [PubMed] [Google Scholar]
- 14.Serre D., Gurd S., Ge B., Sladek R., Sinnett D., Harmsen E., Bibikova M., Chudin E., Barker D.L., Dickinson T. PLoS Genet. 2008;4:e1000006. doi: 10.1371/journal.pgen.1000006. [DOI] [PMC free article] [PubMed] [Google Scholar]
- 15.Heap G.A., Yang J.H., Downes K., Healy B.C., Hunt K.A., Bockett N., Franke L., Dubois P.C., Mein C.A., Dobson R.J. Hum. Mol. Genet. 2010;19:122–134. doi: 10.1093/hmg/ddp473. [DOI] [PMC free article] [PubMed] [Google Scholar]
- 16.Dermitzakis E.T., Stranger B.E. Mamm. Genome. 2006;17:503–508. doi: 10.1007/s00335-006-0005-y. [DOI] [PubMed] [Google Scholar]
- 17.Stranger B.E., Forrest M.S., Clark A.G., Minichiello M.J., Deutsch S., Lyle R., Hunt S., Kahl B., Antonarakis S.E., Tavare S. PLoS Genet. 2005;1:e78. doi: 10.1371/journal.pgen.0010078. [DOI] [PMC free article] [PubMed] [Google Scholar]
- 18.Schadt E.E., Molony C., Chudin E., Hao K., Yang X., Lum P.Y., Kasarskis A., Zhang B., Wang S., Suver C. PLoS Biol. 2008;6:e107. doi: 10.1371/journal.pbio.0060107. [DOI] [PMC free article] [PubMed] [Google Scholar]
- 19.Dimas A.S., Deutsch S., Stranger B.E., Montgomery S.B., Borel C., Attar-Cohen H., Ingle C., Beazley C., Gutierrez Arcelus M., Sekowska M. Science. 2009;325:1246–1250. doi: 10.1126/science.1174148. [DOI] [PMC free article] [PubMed] [Google Scholar]
- 20.Verlaan D.J., Ge B., Grundberg E., Hoberman R., Lam K.C., Koka V., Dias J., Gurd S., Martin N.W., Mallmin H. Genome Res. 2009;19:118–127. doi: 10.1101/gr.084798.108. [DOI] [PMC free article] [PubMed] [Google Scholar]
- 21.Ge B., Pokholok D.K., Kwan T., Grundberg E., Morcos L., Verlaan D.J., Le J., Koka V., Lam K.C., Gagne V. Nat. Genet. 2009;41:1216–1222. doi: 10.1038/ng.473. [DOI] [PubMed] [Google Scholar]
- 22.Doria A., Patti M.E., Kahn C.R. Cell Metab. 2008;8:186–200. doi: 10.1016/j.cmet.2008.08.006. [DOI] [PMC free article] [PubMed] [Google Scholar]
- 23.Stranger B.E., Forrest M.S., Dunning M., Ingle C.E., Beazley C., Thorne N., Redon R., Bird C.P., de Grassi A., Lee C. Science. 2007;315:848–853. doi: 10.1126/science.1136678. [DOI] [PMC free article] [PubMed] [Google Scholar]
- 24.Ohlsson R., Tycko B., Sapienza C. Trends Genet. 1998;14:435–438. doi: 10.1016/s0168-9525(98)01583-2. [DOI] [PubMed] [Google Scholar]
- 25.Gimelbrant A., Hutchinson J.N., Thompson B.R., Chess A. Science. 2007;318:1136–1140. doi: 10.1126/science.1148910. [DOI] [PubMed] [Google Scholar]
- 26.Guo L., Hu-Li J., Paul W.E. Immunity. 2005;23:89–99. doi: 10.1016/j.immuni.2005.05.008. [DOI] [PubMed] [Google Scholar]
- 27.Chan H.W., Kurago Z.B., Stewart C.A., Wilson M.J., Martin M.P., Mace B.E., Carrington M., Trowsdale J., Lutz C.T. J. Exp. Med. 2003;197:245–255. doi: 10.1084/jem.20021127. [DOI] [PMC free article] [PubMed] [Google Scholar]
- 28.Nutt S.L., Vambrie S., Steinlein P., Kozmik Z., Rolink A., Weith A., Busslinger M. Nat. Genet. 1999;21:390–395. doi: 10.1038/7720. [DOI] [PubMed] [Google Scholar]
- 29.Plagnol V., Uz E., Wallace C., Stevens H., Clayton D., Ozcelik T., Todd J.A. PLoS ONE. 2008;3:e2966. doi: 10.1371/journal.pone.0002966. [DOI] [PMC free article] [PubMed] [Google Scholar]
- 30.Forton J.T., Udalova I.A., Campino S., Rockett K.A., Hull J., Kwiatkowski D.P. Genome Res. 2007;17:82–87. doi: 10.1101/gr.5663007. [DOI] [PMC free article] [PubMed] [Google Scholar]
- 31.Schilling E., El Chartouni C., Rehli M. Genome Res. 2009;19:2028–2035. doi: 10.1101/gr.095562.109. [DOI] [PMC free article] [PubMed] [Google Scholar]
- 32.Yang H., Ding Y., Hutchins L.N., Szatkiewicz J., Bell T.A., Paigen B.J., Graber J.H., de Villena F.P., Churchill G.A. Nat. Methods. 2009;6:663–666. doi: 10.1038/nmeth.1359. [DOI] [PMC free article] [PubMed] [Google Scholar]
- 33.Meissner A., Mikkelsen T.S., Gu H., Wernig M., Hanna J., Sivachenko A., Zhang X., Bernstein B.E., Nusbaum C., Jaffe D.B. Nature. 2008;454:766–770. doi: 10.1038/nature07107. [DOI] [PMC free article] [PubMed] [Google Scholar]
- 34.Feinberg A.P., Tycko B. Nat. Rev. Cancer. 2004;4:143–153. doi: 10.1038/nrc1279. [DOI] [PubMed] [Google Scholar]
- 35.Kang M.Y., Lee B.B., Ji Y.I., Jung E.H., Chun H.K., Song S.Y., Park S.E., Park J., Kim D.H. Cancer. 2008;112:1699–1707. doi: 10.1002/cncr.23335. [DOI] [PubMed] [Google Scholar]
- 36.Murrell A., Heeson S., Cooper W.N., Douglas E., Apostolidou S., Moore G.E., Maher E.R., Reik W. Hum. Mol. Genet. 2004;13:247–255. doi: 10.1093/hmg/ddh013. [DOI] [PubMed] [Google Scholar]
- 37.Boumber Y.A., Kondo Y., Chen X., Shen L., Guo Y., Tellez C., Estecio M.R., Ahmed S., Issa J.P. PLoS Genet. 2008;4:e1000162. doi: 10.1371/journal.pgen.1000162. [DOI] [PMC free article] [PubMed] [Google Scholar]