

Abstract
The default mode network (DMN) comprises a set of regions that exhibit ongoing, intrinsic activity in the resting state and task-related decreases in activity across a range of paradigms. However, DMN regions have also been reported as task-related increases, either independently or coactivated with other regions in the network. Cognitive subtractions and the use of low-level baseline conditions have generally masked the functional nature of these regions. Using a combination of activation likelihood estimation, which assesses statistically significant convergence of neuroimaging results, and tools distributed with the BrainMap database, we identified core regions in the DMN and examined their functional heterogeneity. Meta-analytic coactivation maps of task-related increases were independently generated for each region, which included both within-DMN and non-DMN connections. Their functional properties were assessed using behavioral domain metadata in BrainMap. These results were integrated to determine a DMN connectivity model that represents the patterns of interactions observed in task-related increases in activity across diverse tasks. Subnetwork components of this model were identified, and behavioral domain analysis of these cliques yielded discrete functional properties, demonstrating that components of the DMN are differentially specialized. Affective and perceptual cliques of the DMN were identified, as well as the cliques associated with a reduced preference for motor processing. In summary, we used advanced coordinate-based meta-analysis techniques to explicate behavior and connectivity in the default mode network; future work will involve applying this analysis strategy to other modes of brain function, such as executive function or sensorimotor systems.
Introduction
A number of studies have examined spatially coherent, low-frequency correlations of resting state networks (RSNs) (Biswal et al., 1995; Beckmann et al., 2005). The emerging consensus is that these systems represent functional modules of the brain, which are active and coherent both at rest and while performing a task (Smith et al., 2009). Of RSNs, the most studied and readily extractable is the default mode network (DMN) (Raichle et al., 2001), which was originally discovered as a pattern of task-related decreases that are more active at “rest” than “task” (Shulman et al., 1997). Given the accumulating number of studies investigating the DMN, we sought to decompose this network using recently developed meta-analysis techniques to determine its underlying circuitry.
Quantitative meta-analysis of published neuroimaging results is a rapidly evolving field that has experienced a dramatic increase volume of peer-reviewed publications and the power of available analytic tools. Neuroimaging meta-analyses pool data published as statistically significant effects at locations specified by three-dimensional coordinates to create a concordance map of brain activations. These coordinate-based meta-analyses (CBMA) are most often applied to functional studies using similar paradigms, but an alternative application is to identify functional networks based on coactivation patterns across large numbers of studies (Koski and Paus, 2000; Postuma and Dagher, 2006; Toro et al., 2008) and behaviorally describe these networks by examining the tasks used to produce the coactivations (Robinson et al., 2009). In the present paper, we combine these multiple CBMA strategies to better define the network patterns and behavioral functions of the default mode network.
The default mode network can be reliably identified as temporal correlations in resting state data or task-related decreases in activation data. However, task-induced increases in DMN regions are observed across tasks involving emotional and social cognition, introspection and prospection, autobiographical memory, and external monitoring of environment stimuli (Gusnard and Raichle, 2001; Harrison et al., 2008; Spreng et al., 2009). This evidence suggests that the DMN is not responsible for a single function, but rather multiple constituent functions. Studies that examine the default mode in resting state data have been unable to comprehensively define these functions, given the uncontrolled nature of spontaneous thought, while task-based investigations are highly dependent on the cognitive processes associated with the selected task. We therefore asked two questions related to the function and interactions of default mode regions. First, what is the range of cognitive processes that can be attributed to DMN regions in the context of task-related increases in neural activity? We addressed this question in a series of large-scale CBMAs in which regions of the DMN were identified and their activation and deactivation patterns examined across a diverse array of tasks. Second, if the coactivation patterns across DMN regions are dissociable, can distinct subnetworks related to constituent DMN functions be extracted? Using behavioral domain meta-data archived in the BrainMap database, we examined contributing cognitive, perceptual, and motor processes to more conclusively address the functional modes of the circuits comprising this highly significant resting state network.
Materials and Methods
We performed a series of coordinate-based meta-analyses of the default mode network using the activation likelihood estimation (ALE) method (Turkeltaub et al., 2002; Laird et al., 2005b), in which the voxelwise correspondence of neuroimaging results is assessed across a large number of studies. ALE has been used to investigate the reliability of results in many studies of healthy brain function (Decety and Lamm, 2007; Costafreda et al., 2008; Chan et al., 2009; Soros et al., 2009) and mental disorders (Menzies et al., 2008; Minzenberg et al., 2009; Ragland et al., 2009) and is useful in generating new hypotheses (Price et al., 2005, Laird et al., 2008; Eickhoff et al., 2009a), identifying previously unspecified regions (Derrfuss et al., 2005), resolving conflicting views (Laird et al., 2005a), or validating new paradigms (McMillan et al., 2007).
The default mode network was originally identified when deactivations derived from subtraction analyses were consistently observed in the same set of regions, regardless of the nature of the stimuli associated with the activation condition (Shulman et al., 1997; Binder et al., 1999; Mazoyer et al., 2001). While other methods have been developed for identifying the DMN, such as correlation analysis (Greicius et al., 2003) and independent component analysis (Damoiseaux et al., 2006), the subtraction method remains a robust technique for isolating the DMN, with many task-related decreases reported in the literature across a wide range of paradigms. Therefore, we performed an ALE meta-analysis of reported deactivations in the literature as a means to objectively identify regions associated with the default mode network.
BrainMap search criteria.
Published task-independent deactivations were accessed using the BrainMap database (Fox and Lancaster, 2002; Laird et al., 2005c), which archives peak coordinates of activations and their corresponding metadata (e.g., number and diagnosis of subjects, analysis technique, paradigm, cognitive domain, etc.). At the time of the analysis, BrainMap contained 1711 neuroimaging publications that described analyses from 7920 experimental contrasts using 80 unique paradigm classes, yielding 64,135 locations (10 February, 2009). Each contrast in BrainMap is flagged as an “Activation” or “Deactivation” upon submission to the database. Activations include simple subtraction analyses (e.g., “Task − Control”) as well as more complex analyses (e.g., between-group comparisons, parametric analyses, correlations with an external variable, etc.). Deactivations are limited only to contrasts in which the observed signal during a baseline condition was relatively greater than during a task condition (e.g., “Control − Task”). Experimental contrasts are also flagged as using “Low-Level Control” or “High-Level Control” conditions. Low-level control conditions are strictly defined as either resting or fixation conditions. To identify experiments of interest, BrainMap was searched for all contrasts that were coded as a Deactivation using a Low-Level Control in the context of “Normal Mapping” (i.e., no subject populations diagnosed with a disease or disorder were included). Whole-brain locations were extracted in the form of stereotactic (x–z) coordinates from the contrasts matching our search criteria.
ALE meta-analysis of task-related decreases.
Using ALE, the identified literature coordinates were modeled with a three-dimensional Gaussian distribution, and their convergence across experiments was quantitatively assessed. Rather than using a prespecified FWHM as in the original ALE approach, an algorithm was used to model the spatial uncertainty of each focus using an estimation of the intersubject and interlaboratory variability typically observed in neuroimaging experiments. This algorithm limits the meta-analysis to an anatomically constrained space specified by a gray matter mask, and includes a method that calculates the above-chance clustering between experiments (i.e., random-effects analysis), rather than between foci (i.e., fixed-effects analysis) (Eickhoff et al., 2009b).
ALE was performed in Talairach space using GingerALE 2.0. Coordinates originally published in MNI space were converted to Talairach space using the Lancaster (icbm2tal) transformation (Lancaster et al., 2007). The resultant ALE map was thresholded at a false discovery rate (FDR) corrected threshold of p < 0.005 (Laird et al., 2005b), a conservative threshold that was selected to determine only the most strongly concordant regions. Images were viewed in Mango (multi-image analysis GUI), developed at the Research Imaging Center in San Antonio (http://ric.uthscsa.edu/mango/).
Analysis of behavioral domain profiles.
For any given region of interest, a frequently posed question in neuroimaging studies regards what mental processes the region plays a role in executing. In BrainMap, metadata are included on the cognitive, perceptual, or motor process isolated by the statistical contrast. The domain of behavioral system is classified according to six main categories and their related subcategories: cognition, action, perception, emotion, interoception, or pharmacology (a complete list of BrainMap's behavioral domains can be accessed at http://brainmap.org/scribe/). We analyzed the behavioral domain (BD) metadata associated with each cluster from the ALE results to determine the frequency of domain “hits” relative to its distribution across the whole brain (i.e., the entire database). For each DMN region, a χ2 test was performed to evaluate the regional distribution as compared to the overall database distribution. If the region's distribution was significantly different, a binomial test was performed to determine which individual domains were over- or under-represented. When a significant domain was observed, the test was repeated on the corresponding subcategories of that domain, yielding a hierarchical analysis of BD profiles that identifies the neural processes associated with activation of the default mode regions.
Meta-analytic connectivity modeling.
Once the location and associated mental processes were identified for each region in the DMN, we investigated the individual connectivity patterns observed when these regions are active. As an alternative to pooling studies that share a common feature of experimental design, ALE meta-analyses can focus on a specific anatomical region and look for global coactivation patterns across a diverse range of tasks. The theory behind this type of meta-analysis is that groups of coordinates that coactivate across experiments can be pooled to identify functionally connected networks in the brain. Like other methods of analyzing functional connectivity (Xiong et al., 1999; Cordes et al., 2000; Rogers et al., 2007), these structure-based meta-analyses are based on the co-occurrence of spatially separate neurophysiological events (Koski and Paus, 2000; Postuma and Dagher, 2006; Toro et al., 2008). A large-scale meta-analysis of the functional connectivity of the amygdala was recently performed using this technique, termed meta-analytic connectivity modeling (MACM) (Robinson et al., 2009).
To analyze the whole-brain meta-analytic connectivity of task-related increases associated with DMN regions, regions of interest (ROIs) were seeded in BrainMap for each ALE cluster observed in the deactivations meta-analysis. Searches were conducted to find all experiments that reported increased activation in these regions during task conditions (i.e., Activations, not Deactivations) in normal subjects. Whole brain coordinates were downloaded and meta-analyzed with ALE using the same procedure detailed above to create ROI-based coactivation images. Thus, while the deactivations meta-analysis was designed to identify regions that are functionally connected when engaged in the default mode of brain function, MACM of regional coactivations was designed to establish connectivity patterns for task-related increases for each node of the DMN. MACM maps were computed at an FDR-corrected threshold of p < 0.01.
Results
ALE meta-analysis to identify the default mode network
The BrainMap database search for deactivations yielded 119 contrasts from 62 papers, which included data from 840 subjects and 1056 coordinate brain locations. ALE meta-analysis of these foci revealed nine regions of convergence in the precuneus (pC), posterior cingulate cortex (PCC), ventral anterior cingulate cortex (vACC), dorsal medial prefrontal cortex (MPFC), bilateral inferior parietal lobules (IPLs), bilateral middle temporal gyri (MTG), and left middle frontal gyrus (LMFG) (Fig. 1, Table 1). These regions are consistent with previous DMN analyses of task-induced decreases (Shulman et al., 1997; Binder et al., 1999; Mazoyer et al., 2001), functional connectivity (Greicius et al., 2003; Fox et al., 2005; Fransson, 2005), independent component analysis (Damoiseaux et al., 2006), and a deactivation analysis across 12 functional magnetic resonance imaging (fMRI) studies (Schilbach et al., 2008). Additionally, a recent ALE meta-analysis of 16 studies examining the default mode network via task-independent deactivations found similar results (Spreng et al., 2009). In the present results, our ALE meta-analysis yielded a smaller number of ALE clusters of larger volume, likely due to the increased power provided by a larger sample size.
Figure 1.

Meta-analytic identification of regions in the DMN (p < 0.005, corrected). These results were used to define ROIs for the BD profile analyses and MACM. z values for each axial slice are reported in Talairach space (top panel), while x values denote sagittal slices (bottom panel).
Table 1.
ALE meta-analysis of task-independent deactivations in the BrainMap database
| Anatomical region | BA | x | y | z | ALE(×10−3) | Vol.(mm3) |
|---|---|---|---|---|---|---|
| Precuneus | 7,31 | −4 | −58 | 44 | 9.74 | 15,632 |
| Posterior cingulate | 31 | −4 | −52 | 22 | 8.09 | — |
| Ventral anterior cingulate | 32 | 2 | 32 | −8 | 9.31 | 6696 |
| R inferior parietal lobule | 40 | 52 | −28 | 24 | 6.75 | 4320 |
| Medial prefrontal cortex | 9 | −2 | 50 | 18 | 4.96 | 2304 |
| R middle temporal gyrus | 39 | 46 | −66 | 16 | 7.14 | 1864 |
| L middle frontal gyrus | 8 | −26 | 16 | 44 | 6.41 | 1224 |
| L inferior parietal lobule | 40 | −56 | −36 | 28 | 5.56 | 1000 |
| L middle temporal gyrus | 39 | −42 | −66 | 18 | 4.99 | 912 |
BA, Brodmann area; Vol., volume of cluster; R, right: L, left. x,y,z coordinates are provided in Talairach space.
The only notable exception to this good agreement with previous results was the lack of concordance in the medial temporal lobe (MTL). This is unusual considering the frequent mention of this region in association with the DMN. The meta-analysis included multiple coordinates that were located in medial temporal regions. At a less conservative threshold, an ALE cluster was observed in the amygdala; however, this cluster was overly influenced by the multiple contrasts published in a single study. While the revised ALE algorithm includes an inference method that does not allow for a single paper to drive the formation of an ALE cluster (Eickhoff et al., 2009), this does not control for cases when more than one contrast is included from a single publication. As a solution, we suggest that (1) only one contrast per study be included in a meta-analysis, or (2) results be inspected post hoc to eliminate suspect clusters. In this meta-analysis, we chose the latter option. Upon inspecting the relevant MTL coordinates, we determined that this negative finding is indicative of the high spatial variability associated with deactivations in this area or the reduced prominence of this area in task-related deactivations (Buckner et al., 2008). Hippocampal involvement in the default mode component extracted using independent component analysis (ICA) is reportedly weaker than other major areas of the DMN, in terms of the BOLD effect size (Damoiseaux et al., 2006), which is possibly due to the large susceptibility artifacts in this area of cortex. Thus, it is not surprising that deactivations in the MTL generally do not reach threshold, leading to their omission as coordinate results in journal publications.
Behavioral domain profiles in the DMN
Histograms of the behavioral domains associated with DMN regions in task-related activations were analyzed to determine the functional specialization of each region using behavioral domain metadata extracted from BrainMap. Figure 2 illustrates the results from the three largest ALE regions in graphic form: BD analysis revealed a uniform distribution for the precuneus, decreased action in the PCC and vACC, and increased emotion, interoception, action preparation, and interoception (specifically, thirst) in the vACC. Significant BD domains for all regions in the DMN are seen in Figure 3. Both the vACC and MPFC were strongly loaded toward emotional processing, while the right IPL (RIPL) and left IPL (LIPL) tend to activate during motor and attentional tasks. The most complex profiles were associated with the vACC, RIPL, and LIPL, respectively involving three, seven, and four levels of the behavioral domain hierarchy. In contrast, uniform domain profiles were observed in the precuneus, PCC, and right MTG (RMTG), a result that indicates a potential lack a functional specialization in these regions. While several domain profile analyses yielded unsurprising results (e.g., emotion was increased in vACC and MPFC but decreased in RIPL and LIPL), other significant domains were unexpected yet plausible (e.g., increased music in RIPL and LIPL).
Figure 2.
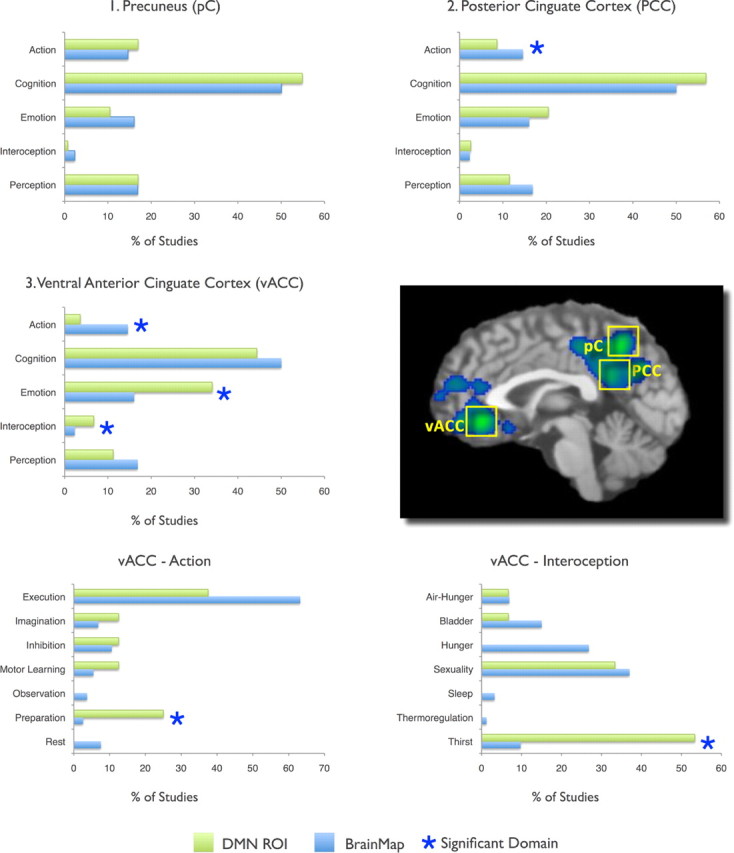
Behavioral Domain Profiles for the Top 3 Highly Concordant DMN Regions. BrainMap counts (blue histograms) represent values observed across the entire database, while DMN ROIs (green histograms) were restricted to the nodes defined in Figure 1. All values are normalized. A complete listing of significant domains for all regions is reported in Figure 3.
Figure 3.

Behavioral domain profiles for individual DMN regions. Significant behavioral domains are listed for each region in the default mode network. Black upward triangles indicate domains in which the observed regional number of experiments was higher than expected compared with the distribution across the BrainMap database, while gray downward triangles indicate domains that were lower than expected. The entire set of domains tested is available at http://brainmap.org/scribe.
In addition to the modular approach of testing BD profiles of individual regions, we tested the network as a collective. The sum of regions contributing to the DMN tends to activate for studies involving action preparation and perception, with decreased preference for emotion. These results demonstrate that during task-specific increases these regions collectively specialize in activities similar to the introspective, monitoring activities of resting behaviors. Thus, there is overlap in the functional traits attributed to the DMN both at task and at rest that relate to perception of external cues and self-referential mental activity (Gusnard and Raichle, 2001; Raichle et al., 2001).
MACM of DMN regions
Meta-analytic connectivity modeling (MACM) of coactivations was performed on the nine DMN nodes to yield individual functional connectivity maps. These nine whole brain MACM maps were compared to the default mode meta-analysis results described above to determine regions of overlap between task-related increases and decreases (Fig. 4). For many regions, we observed a strong dissociation between the two types of coactivations. For example, the MACM map of the left inferior parietal lobule revealed connectivity with only one other default mode region: the right inferior parietal lobule (the contralateral equivalent of this was observed in the MACM map for the RIPL). Similarly, the only default mode region observed in the left middle frontal gyrus MACM map was the medial prefrontal cortex. No overlap was observed in medial posterior regions for the precuneus and posterior cingulate maps, providing evidence to support these regions as distinct functional nodes. Seven out of nine regions displayed limited connectivity (one to two regions) with DMN nodes during increases in activation [pC, vACC, MPFC, bilateral IPL, left MTG (LMTG), and LMFG]. Only the PCC and the right middle temporal gyrus exhibited more extensive connectivity with the rest of the DMN (three and five regions, respectively), and can therefore be considered to act as “hubs” within this network. Notably, these regions have been shown to function as global hubs in previous analyses of intrinsic functional connectivity across the brain (Hagmann et al., 2008; Buckner et al., 2009).
Figure 4.

Composite image of the deactivations meta-analysis (blue) and MACM maps for each DMN region (red). Substantial overlap was observed for some regions (e.g., PCC and RMTG), while other regions showed minimal overlap (e.g., RIPL and vACC).
To facilitate interpretation of the nine MACM maps, we constructed a model summarizing these connectivity patterns between default mode regions (Fig. 5). In this model, the paths between regions indicate the observations of one ROI in another ROI's MACM map. For example, the RIPL was observed in the MACM map computed for the precuneus; therefore a path was drawn from the pC to the RIPL. For nine regions, 18 paths were observed in the MACMs (out of a total of 64), representing a highly specified model of DMN connectivity derived solely from meta-analytic methods.
Figure 5.

Meta-analytic model of connectivity between DMN regions. MACM overlap between ROIs observed in Figure 4 was used to construct a model representing connectivity between regions. Directionality of paths indicates that an ROI was observed (ending point) in another ROIs MACM (starting point). Color-coding of cliques in the model was determined by BD analysis of sets of nodes comprising these subnetworks.
Integration of BD profiles and MACM maps
An algorithm was implemented to search for cliques (i.e., loops) in the network that involved three or more nodes. Simple path searches were performed starting at each ROI and moving successively through connected ROIs until ending at the initial node. Revisiting a node other than the node of origin was not allowed. The maximum number of ROIs was limited to five to reduce complexity of loops, and the minimum number required to form a clique was three. In this manner, eight subnetworks were identified in the DMN connectivity model: four that were constrained by the direction of the paths in the model, and four that were not constrained. To characterize the functional specialization of these cliques, we analyzed the behavioral domain profiles for the node sets (Fig. 6). A smaller subset of significant domains were observed for the cliques as compared to the individual nodes, reflecting an increased functional precision of these regions when acting in concert. Six out of eight of the cliques originated in the PCC, confirming previous work specifying its critical role in the DMN (Raichle et al., 2001; Greicius et al., 2003). The simplest, non-overlapping subnetworks composed of three nodes are depicted in Figure 5: (1) PCC→MPFC→ vACC→PCC (increased emotion and decreased action), (2) PCC→LMTG→RMTG→PCC (decreased action), and (3) LIPL→RIPL→RMTG→LIPL (increased perception and somesthesis, decreased emotion). The remaining network in the non-overlapping model included 5 nodes (LMFG→pC→ RIPL→RMTG→MPFC→LMFG) and was found to have domain peaks in perception and somesthesis.
Figure 6.

Behavioral domain profiles for DMN subnetworks. Significant behavioral domains are listed for each DMN subnetwork. Black upward triangles indicate clique domain counts that were higher than expected as compared across the BrainMap database, while gray downward triangles indicate lower than expected domains. A–G depict each of the subnetworks identified in the analysis of DMN coactivations, extracted from the observed connections in Figure 5. A and B are subnetworks composed of 3 nodes, constrained by the direction of paths in the model; C and D include 3 nodes unconstrained by path direction; E includes 4 constrained nodes; F includes 4 unconstrained nodes; G includes 5 constrained nodes; and H includes 5 unconstrained nodes.
Domain profiles of DMN cliques were generally observed to focus on cognitive processes that are relevant to rest. Decreases in action and increases in action preparation indicate a lack of movement, while increases in perception (specifically, somesthesis) suggest monitoring of external stimuli. Emotion was another frequent domain contribution, providing support for previous evidence that unconstrained thoughts tend toward those of a social or emotional context (Schilbach et al., 2008). Some studies have hypothesized that episodic or semantic retrieval are key components of the default mode (Andreasen et al., 1995; Binder et al., 1999; Greicius and Menon, 2004). However, no peaks were observed in any memory or language domains, suggesting that this aspect of default mode processing was not isolated in the given network organization, which is likely due to the lack of convergence observed in medial temporal regions.
In Figure 5, DMN cliques exhibited either a decreased preference for action (red and green arrows; majority of nodes are anterior) or an increased preference for somesthesis (blue and black arrows; majority of nodes are posterior). The spatial distribution of nodes for these two DMN components agrees with previous observations of separate anterior and posterior ICA components of the DMN (Damoiseaux et al., 2006; Uddin et al., 2009). In a more global comparison, the model in Figure 5 also mirrors the contrast in strong lateral hemispheric versus medial connections that were reported in a whole brain analysis of the low-frequency fluctuations during rest using small-world models (Salvador et al., 2005).
Discussion
A large-scale, coordinate-based meta-analysis of task-related deactivations was performed on studies archived in the BrainMap database to identify consistent nodes of the default mode network. Using ALE (Eickhoff et al., 2009b), DMN regions were identified in the precuneus, posterior and ventral anterior cingulate cortices, medial prefrontal cortex, bilateral inferior parietal lobules, bilateral middle temporal gyri, and left middle frontal gyrus. For each DMN node, behavioral profiles were constructed using BrainMap tools to quantitatively assess their functional attributes when active (not during rest), and MACM were created to identify dissociable patterns of functional connectivity when unconstrained by any specific task. MACM maps were compared to determine which DMN nodes had the greatest degree of connectivity with other nodes, yielding a meta-analytic model of connectivity between default mode regions. Behavioral profiles of node sets were tested to determine significant functional properties of decomposed subnetworks in this model. Using this technique, affective and perceptual cliques of the DMN were identified, as well as the cliques associated with a reduced preference for motor processing.
The behavioral domain (BD) profiles and MACM maps definitively identified nine functional regions within the DMN. The PCC was observed as the central hub in six of the eight cliques identified in the DMN connectivity model (Fig. 6), in agreement with other studies that this cortical region is a critical node in the DMN (Raichle et al., 2001; Greicius et al., 2003; Fransson and Marrelec, 2008). BD profiles revealed that even during tasks, functional specialization of DMN regions is limited: significant preference for two or fewer mental operations was observed for six regions. The precuneus and the right middle temporal gyrus (BA 39) displayed no domain preferences, while the PCC displayed the second least complex profile, with a simple decreased preference for action. In contrast, the RIPL and LIPL showed considerable functional specialization, with nine to 15 significant domains, which suggests a different role within the DMN for these nodes.
In the comparison of individual MACM maps, the PCC and RMTG displayed the highest levels of functional coactivation with other regions, giving further confirmation of their crucial roles in the DMN. There was some, but not overly extensive, overlap across maps for the other seven regions. For all MACM maps, our analysis procedure was structured to first identify regions that are consistently deactivated during tasks, and then analyze their functional connectivity across experiments in which they were observed to be active. It has been postulated that characterizing the functional roles of DMN regions may be best undertaken by studying how these regions interact with other regions (Uddin et al., 2009). The idea that the function of the DMN can be simplistically determined, or that each node contributes equally to this function is unlikely. This reasoning led us to investigate the functional specialization of the DMN regions with both modular and subnetwork approaches. We believe that the MACM maps represent generalized functional connectivity for each region, which includes some component of interaction with other default mode regions as well as other components of other networks. Although it has been observed that connectivity of the DMN persists in passive and active tasks states (Greicius and Menon, 2004; Fransson, 2006; Buckner et al., 2009), these regions are also known to be involved in various other behaviors in addition to default mode functioning. The inclusion of both DMN and non-DMN regions in the MACM maps is therefore not surprising.
Collective review of the MACM and BD profile results revealed that the degree of connectivity between DMN regions (i.e., number of coactivations across DMN regions) was inversely correlated with the complexity of their behavioral domain profiles (i.e., number of domain peaks) (p < 0.024); correlation was computed using square roots of the values to reduce the skew associated with the large number of peaks in the RIPL and LIPL. This observation indicates that the more critical default mode regions exhibit functional nonspecialization, while more highly specialized nodes exhibit a reduced degree of default mode connectivity. Particularly, the RIPL and LIPL displayed low connectivity with other DMN regions. In contrast, these two regions exhibit strong connectivity with regions identified in a large-scale meta-analysis of executive function tasks (Minzenberg et al., 2009), which includes regions that have previously been identified as being anti-correlated with the DMN (Fox et al., 2005; Fransson, 2005; Uddin et al., 2009). This leads us to speculate that bilateral IPLs are dynamic, bimodal regions that are self-referential during rest (consistent with significant behavioral profiles in interoception and somesthesis), and, upon receiving input from external stimuli, transition to a more extrospective functional role during the execution of goal-directed behaviors (consistent with significant behavioral profiles in action and attention). This type of transfer or facilitative node has previously been observed in association with resting state networks (Seeley et al., 2007; Sridharan et al., 2008; Uddin et al., 2009), and may be a universal component of neural network architecture.
Limitations
Application of the ALE method was a critical step in the analysis of concordance across studies; other coordinate-based meta-analysis methods are conceptually similar (Wager et al., 2009), and are likely to produce similar results (Salimi-Khorshidi et al., 2009). This preliminary effort toward functional labeling requires further evaluation and may be limited by a potentially significant lack of data in BrainMap, in terms of the database sample size, study distribution, and the specificity of the behavioral taxonomy. Negative results for BD profiles in several DMN regions may not indicate a lack of functional specialization, but rather a lack of relevant dimensions of the taxonomy. However, analysis of regions outside this network conducted during development of the method consistently revealed more complex profiles, suggesting that many DMN regions actually do differ in their uniform domain distributions. We acknowledge that this analysis would yield more precise results if the granularity of the behavioral domains was increased. Testing for taxonomy-based differences in BD profiles may be a useful strategy for developing and validating a data-driven ontology of behavioral domains.
Future work
The behavioral profile analyses potentially provide a systematic method for evaluating the many-to-many mappings of brain regions to mental functions (Price and Friston, 2005). Here, we pursued a modular formalism of networks by analyzing the behavioral profiles of individual regions, but also investigated a network-focused approach by analyzing cliques of multiple brain regions. This illustrates our first efforts at performing quantitative functional labeling of regions using the BrainMap database. Our goal is to establish a method for creating a probabilistic brain atlas (Laird et al., 2009), similar to anatomical labeling using the Talairach Daemon (Lancaster et al., 2000) and probabilistic cytoarchitectonic atlases (Eickhoff et al., 2005). Such a tool could be useful in interpreting the observed results of any given functional neuroimaging study, and may potentially reduce the generally non-data-driven and impressionistic naming that has been heretofore applied when identifying networks of brain regions.
We investigated the DMN since this network appears to represent an archetypal mode of brain function. However, the general analysis strategy illustrated here can similarly be applied to unpack other modes of function, such as the resting state networks identified by ICA (Damoiseaux et al., 2006; De Luca et al., 2006). The joint strategy of applying MACM and BD profile analyses yields valuable connectivity information in conjunction with a schema for functional labeling, and is unique to other techniques in its ability to assign functional attributes to distinct network circuits. Recent results indicate that resting state networks derived via ICA of resting state fMRI data explicitly match activation networks derived via ICA of BrainMap coordinate data (Smith et al., 2009). These provocative results highlight the need to fully decompose and define RSNs since they potentially represent a foundational building block of the brain's functional framework.
Other future work will involve testing the meta-analytic model generated here as a proposed model of effective connectivity in resting state data. If the model presented in Figure 5 is found to match the covariance structure of the DMN in resting data, which is reasonable given the recent results of Smith et al. (2009), then the analysis detailed in this study may be useful in developing more informed a priori models of brain circuitry. Determining a priori models is one of the most complex stages of structural equation modeling (SEM) or dynamic causal modeling, and the development of a method that refines this procedure in an unbiased manner would represent significant progress for the community. If valid, this method could then be applied to determine how the DMN is disrupted in pathologies that are known to effect connectivity, such as Alzheimer's disease and schizophrenia (Broyd et al., 2009). Thus far, neuroimaging studies have analyzed temporal or spatial covariances separately, with little effort being made to integrate the results. Generating effective connectivity models using MACM to be tested in fMRI time series data offers the opportunity to link temporal and spatial covariance analyses, and may yield significant new insights into both resting and task-based brain activity.
Footnotes
This work was supported by the National Institute of Mental Health (Grants R01-MH074457 to P.T.F. and R01-MH084812 to A.R.L.), the Department of Defense (STRONGSTAR Neuroimaging Core to P.T.F.), and the Helmholz Initiative on Systems-Biology (S.B.E.). Special thanks to Reese McKay for his input and to Steve Smith, Donald Dudley, and Robert Huff for insightful discussions.
References
- Andreasen NC, O'Leary DS, Cizadlo T, Arndt S, Rezai K, Watkins GL, Ponto LL, Hichwa RD. Remembering the past: Two facets of episodic memory explored with positron emission tomography. Am J Psychiatry. 1995;152:1576–1585. doi: 10.1176/ajp.152.11.1576. [DOI] [PubMed] [Google Scholar]
- Beckmann CF, DeLuca M, Devlin JT, Smith SM. Investigations into resting-state connectivity using independent component analysis. Philos Trans R Soc Lond B Biol Sci. 2005;360:1001–1013. doi: 10.1098/rstb.2005.1634. [DOI] [PMC free article] [PubMed] [Google Scholar]
- Binder JR, Frost JA, Hammeke TA, Bellgowan PSF, Rao SM, Cox RW. Conceptual processing during the conscious resting state: a functional MRI study. J Cogn Neurosci. 1999;11:80–93. doi: 10.1162/089892999563265. [DOI] [PubMed] [Google Scholar]
- Biswal B, Yetkin FZ, Haughton VM, Hyde JS. Functional connectivity in the motor cortex of resting human brain using echo-planar MRI. Magn Reson Med. 1995;34:537–541. doi: 10.1002/mrm.1910340409. [DOI] [PubMed] [Google Scholar]
- Broyd SJ, Demanuele C, Debener S, Helps SK, James CJ, Sonuga-Barke EJ. Default-mode brain dysfunction in mental disorders: A systematic review. Neurosci Biobehav Rev. 2009;33:279–296. doi: 10.1016/j.neubiorev.2008.09.002. [DOI] [PubMed] [Google Scholar]
- Buckner RL, Andrews-Hanna JR, Schacter DL. The brain's default network: anatomy, function, and relevance to disease. Ann N Y Acad Sci. 2008;1124:1–38. doi: 10.1196/annals.1440.011. [DOI] [PubMed] [Google Scholar]
- Buckner RL, Sepulcre J, Talukdar T, Krienen FM, Liu H, Hedden T, Andrews-Hanna JR, Sperling RA, Johnson KA. Cortical hubs revealed by intrinsic functional connectivity: Mapping, assessment of stability, and relation to Alzheimer's disease. J Neurosci. 2009;29:1860–1873. doi: 10.1523/JNEUROSCI.5062-08.2009. [DOI] [PMC free article] [PubMed] [Google Scholar]
- Chan RC, Huang J, Di X. Dexterous movement complexity and cerebellar activation: a meta-analysis. Brain Res Rev. 2009;59:316–323. doi: 10.1016/j.brainresrev.2008.09.003. [DOI] [PubMed] [Google Scholar]
- Cordes D, Haughton VM, Arfanakis K, Wendt GJ, Turski PA, Moritz CH, Quigley MA, Meyerand ME. Mapping functionally related regions of brain with functional connectivity MR imaging. Am J Neuroradiol. 2000;21:1636–1644. [PMC free article] [PubMed] [Google Scholar]
- Costafreda SG, Brammer MJ, David AS, Fu CH. Predictors of amygdala activation during the processing of emotional stimuli: A meta-analysis of 385 PET and fMRI studies. Brain Res Rev. 2008;58:57–70. doi: 10.1016/j.brainresrev.2007.10.012. [DOI] [PubMed] [Google Scholar]
- Damoiseaux JS, Rombouts SA, Barkhof F, Scheltens P, Stam CJ, Smith SM, Beckmann CF. Consistent resting-state networks across healthy subjects. Proc Natl Acad Sci U S A. 2006;103:13848–13853. doi: 10.1073/pnas.0601417103. [DOI] [PMC free article] [PubMed] [Google Scholar]
- Decety J, Lamm C. The role of the right tempoparietal junction in social interaction: How low-level computational processes contribute to meta-cognition. Neuroscientist. 2007;13:580–593. doi: 10.1177/1073858407304654. [DOI] [PubMed] [Google Scholar]
- De Luca M, Beckmann CF, De Stefano N, Matthews PM, Smith SM. fMRI resting state networks define distinct modes of long-distance interactions in the human brain. Neuroimage. 2006;29:1359–1367. doi: 10.1016/j.neuroimage.2005.08.035. [DOI] [PubMed] [Google Scholar]
- Derrfuss J, Brass M, Neumann J, von Cramon YD. Involvement of the inferior frontal junction in cognitive control: Meta-analyses of switching and Stroop studies. Hum Brain Mapp. 2005;25:22–34. doi: 10.1002/hbm.20127. [DOI] [PMC free article] [PubMed] [Google Scholar]
- Eickhoff SB, Stephan KE, Mohlberg H, Grefkes C, Fink GR, Amunts K, Zilles K. A new SPM toolbox for combining probabilistic cytoarchitectonic maps and functional imaging data. Neuroimage. 2005;25:1325–1335. doi: 10.1016/j.neuroimage.2004.12.034. [DOI] [PubMed] [Google Scholar]
- Eickhoff SB, Heim S, Zilles K, Amunts K. A systems perspective on the effective connectivity of overt speech production. Philos Transact A Math Phys Eng Sci. 2009a;367:2399–2421. doi: 10.1098/rsta.2008.0287. [DOI] [PMC free article] [PubMed] [Google Scholar]
- Eickhoff SB, Laird AR, Grefkes C, Wang LE, Zilles K, Fox PT. Coordinate-based activation likelihood estimation meta-analysis of neuroimaging data: A random-effects approach based on empirical estimates of spatial uncertainty. Hum Brain Mapp. 2009b;30:2907–2926. doi: 10.1002/hbm.20718. [DOI] [PMC free article] [PubMed] [Google Scholar]
- Fox MD, Snyder AZ, Vincent JL, Corbetta M, Van Essen DC, Raichle ME. The human brain is intrinsically organized into dynamic, anticorrelated functional networks. Proc Natl Acad Sci U S A. 2005;102:9673–9678. doi: 10.1073/pnas.0504136102. [DOI] [PMC free article] [PubMed] [Google Scholar]
- Fox PT, Lancaster JL. Mapping context and content: the BrainMap model. Nat Rev Neurosci. 2002;3:319–321. doi: 10.1038/nrn789. [DOI] [PubMed] [Google Scholar]
- Fransson P. Spontaneous low-frequency BOLD signal fluctuations: An fMRI investigation of the resting-state default mode of brain function hypothesis. Hum Brain Mapp. 2005;26:15–29. doi: 10.1002/hbm.20113. [DOI] [PMC free article] [PubMed] [Google Scholar]
- Fransson P. How default is the default mode of brain function? Further evidence from intrinsic BOLD signal fluctuations. Neuropsychologia. 2006;44:2836–2845. doi: 10.1016/j.neuropsychologia.2006.06.017. [DOI] [PubMed] [Google Scholar]
- Fransson P, Marrelec G. The precuneus/posterior cingulate cortex plays a pivotal role in the default mode network: Evidence from a partial correlation network analysis. Neuroimage. 2008;42:1178–1184. doi: 10.1016/j.neuroimage.2008.05.059. [DOI] [PubMed] [Google Scholar]
- Greicius MD, Menon V. Default-mode activity during a passive sensory task: uncoupled from deactivation but impacting activation. J Cogn Neurosci. 2004;16:1484–1492. doi: 10.1162/0898929042568532. [DOI] [PubMed] [Google Scholar]
- Greicius MD, Krasnow B, Reiss AL, Menon V. Functional connectivity in the resting brain: A network analysis of the default mode hypothesis. Proc Natl Acad Sci U S A. 2003;100:253–258. doi: 10.1073/pnas.0135058100. [DOI] [PMC free article] [PubMed] [Google Scholar]
- Gusnard DA, Raichle ME. Searching for a baseline: Functional imaging and the resting human brain. Nat Rev Neurosci. 2001;2:685–694. doi: 10.1038/35094500. [DOI] [PubMed] [Google Scholar]
- Hagmann P, Cammoun L, Gigandet X, Meuli R, Honey CJ, Wedeen VJ, Sporns O. Mapping the structural core of human cerebral cortex. PLoS Biol. 2008;6:e159. doi: 10.1371/journal.pbio.0060159. [DOI] [PMC free article] [PubMed] [Google Scholar]
- Harrison BJ, Pujol J, López-Solà M, Hernández-Ribas R, Deus J, Ortiz H, Soriano-Mas C, Yücel M, Pantelis C, Cardoner N. Consistency and functional specialization in the default mode brain network. Proc Natl Acad Sci U S A. 2008;105:9781–9786. doi: 10.1073/pnas.0711791105. [DOI] [PMC free article] [PubMed] [Google Scholar]
- Koski L, Paus T. Functional connectivity of the anterior cingulate cortex with the human frontal lobe: A brain-mapping meta-analysis. Exp Brain Res. 2000;133:55–65. doi: 10.1007/s002210000400. [DOI] [PubMed] [Google Scholar]
- Laird AR, McMillan KM, Lancaster JL, Kochunov P, Turkeltaub PE, Pardo JV, Fox PT. A comparison of label-based review and activation likelihood estimation in the Stroop task. Hum Brain Mapp. 2005a;25:6–21. doi: 10.1002/hbm.20129. [DOI] [PMC free article] [PubMed] [Google Scholar]
- Laird AR, Fox PM, Price CJ, Glahn DC, Uecker AM, Lancaster JL, Turkeltaub PE, Kochunov P, Fox PT. ALE meta-analysis: controlling the false discovery rate and performing statistical contrasts. Hum Brain Mapp. 2005b;25:155–164. doi: 10.1002/hbm.20136. [DOI] [PMC free article] [PubMed] [Google Scholar]
- Laird AR, Lancaster JL, Fox PT. BrainMap: The social evolution of a human brain mapping database. Neuroinformatics. 2005c;3:65–78. doi: 10.1385/ni:3:1:065. [DOI] [PubMed] [Google Scholar]
- Laird AR, Robbins JM, Li K, Price LR, Cykowski MD, Narayana S, Laird RW, Franklin C, Fox PT. Modeling motor connectivity using TMS/PET and structural equation modeling. Neuroimage. 2008;41:424–436. doi: 10.1016/j.neuroimage.2008.01.065. [DOI] [PMC free article] [PubMed] [Google Scholar]
- Laird AR, Eickhoff SB, Kurth F, Fox PM, Uecker AM, Turner JA, Robinson JL, Lancaster JL, Fox PT. ALE meta-analysis workflows via the BrainMap database: progress towards a probabilistic functional brain atlas. Front Neuroinformatics. 2009;3:23. doi: 10.3389/neuro.11.023.2009. [DOI] [PMC free article] [PubMed] [Google Scholar]
- Lancaster JL, Woldorff MG, Parsons LM, Liotti M, Freitas CS, Rainey L, Kochunov PV, Nickerson D, Mikiten SA, Fox PT. Automated Talairach Atlas labels for functional brain mapping. Hum Brain Mapp. 2000;10:120–131. doi: 10.1002/1097-0193(200007)10:3<120::AID-HBM30>3.0.CO;2-8. [DOI] [PMC free article] [PubMed] [Google Scholar]
- Lancaster JL, Tordesillas-Gutiérrez D, Martinez M, Salinas F, Evans A, Zilles K, Mazziotta JC, Fox PT. Bias between MNI and Talairach coordinates analyzed using the ICBM-152 brain template. Hum Brain Mapp. 2007;28:1194–1205. doi: 10.1002/hbm.20345. [DOI] [PMC free article] [PubMed] [Google Scholar]
- Mazoyer B, Zago L, Mellet E, Bricogne S, Etard O, Houdé O, Crivello F, Joliot M, Petit L, Tzourio-Mazoyer N. Cortical networks for working memory and executive functions sustain the conscious resting state in man. Brain Res Bull. 2001;54:287–298. doi: 10.1016/s0361-9230(00)00437-8. [DOI] [PubMed] [Google Scholar]
- McMillan KM, Laird AR, Witt ST, Meyerand ME. Self-paced working memory: Validation of verbal variations of the n-back paradigm. Brain Res. 2007;1139:133–142. doi: 10.1016/j.brainres.2006.12.058. [DOI] [PMC free article] [PubMed] [Google Scholar]
- Menzies L, Chamberlain SR, Laird AR, Thelen SM, Sahakian BJ, Bullmore ET. Integrating evidence from neuroimaging and neuropsychological studies of obsessive compulsive disorder: The orbitofronto-striatal model revisited. Neurosci Biobehav Rev. 2008;32:525–549. doi: 10.1016/j.neubiorev.2007.09.005. [DOI] [PMC free article] [PubMed] [Google Scholar]
- Minzenberg MJ, Laird AR, Thelen S, Carter CS, Glahn DC. Meta-analysis of 41 functional neuroimaging studies of executive cognition reveals dysfunction in a general-purpose cognitive control system in schizophrenia. Arch Gen Psychiatry. 2009;66:811–822. doi: 10.1001/archgenpsychiatry.2009.91. [DOI] [PMC free article] [PubMed] [Google Scholar]
- Postuma RB, Dagher A. Basal ganglia functional connectivity based on a meta-analysis of 126 positron emission tomography and functional magnetic resonance imaging publications. Cereb Cortex. 2006;16:1508–1521. doi: 10.1093/cercor/bhj088. [DOI] [PubMed] [Google Scholar]
- Price CJ, Friston KJ. Functional ontologies for cognition: the systematic definition of structure and function. Cogn Neuropsychol. 2005;22:262–275. doi: 10.1080/02643290442000095. [DOI] [PubMed] [Google Scholar]
- Price CJ, Devlin JT, Moore CJ, Morton C, Laird AR. Meta-analyses of object naming: effect of baseline. Hum Brain Mapp. 2005;25:70–82. doi: 10.1002/hbm.20132. [DOI] [PMC free article] [PubMed] [Google Scholar]
- Ragland JD, Laird AR, Ranganath CS, Blumenfeld RS, Gonzales SM, Glahn DC. Prefrontal activation deficits during episodic memory in schizophrenia. Am J Psych. 2009;166:863–874. doi: 10.1176/appi.ajp.2009.08091307. [DOI] [PMC free article] [PubMed] [Google Scholar]
- Raichle ME, MacLeod AM, Snyder AZ, Powers WJ, Gusnard DA, Shulman GL. A default mode of brain function. Proc Natl Acad Sci U S A. 2001;98:676–682. doi: 10.1073/pnas.98.2.676. [DOI] [PMC free article] [PubMed] [Google Scholar]
- Robinson JL, Laird AR, Glahn DC, Lovallo WR, Fox PT. Meta-analytic connectivity modeling: delineating the functional connectivity of the human amygdala. Hum Brain Mapp. 2009 doi: 10.1002/hbm.20854. [DOI] [PMC free article] [PubMed] [Google Scholar]
- Rogers BP, Morgan VL, Newton AT, Gore JC. Assessing functional connectivity in the human brain by fMRI. Magn Reson Imaging. 2007;25:1347–1357. doi: 10.1016/j.mri.2007.03.007. [DOI] [PMC free article] [PubMed] [Google Scholar]
- Salvador R, Suckling J, Coleman MR, Pickard JD, Menon D, Bullmore E. Neurophysiological architecture of functional magnetic resonance image of human brain. Cereb Cortex. 2005;15:1332–1342. doi: 10.1093/cercor/bhi016. [DOI] [PubMed] [Google Scholar]
- Salimi-Khorshidi G, Smith SM, Keltner JR, Wager TD, Nichols TE. Meta-analysis of neuroimaging data: A comparison of image-based and coordinate-based pooling of studies. Neuroimage. 2009;45:810–823. doi: 10.1016/j.neuroimage.2008.12.039. [DOI] [PubMed] [Google Scholar]
- Schilbach L, Eickhoff SB, Rotarska-Jagiela A, Fink GR, Vogeley K. Minds at rest? Social cognition as the default mode of cognizing and its putative relationship to the “default system” of the brain. Conscious Cogn. 2008;17:457–467. doi: 10.1016/j.concog.2008.03.013. [DOI] [PubMed] [Google Scholar]
- Seeley WW, Menon V, Schatzberg AF, Keller J, Glover GH, Kenna H, Reiss AL, Greicius MD. Dissociable intrinsic connectivity networks for salience processing and executive control. J Neurosci. 2007;27:2349–2356. doi: 10.1523/JNEUROSCI.5587-06.2007. [DOI] [PMC free article] [PubMed] [Google Scholar]
- Shulman GL, Fiez JA, Corbetta M, Buckner RL, Miezin FM, Raichle ME, Petersen SE. Common blood flow changes across visual tasks: II. Decreases in cerebral cortex. J Cogn Neurosci. 1997;9:648–663. doi: 10.1162/jocn.1997.9.5.648. [DOI] [PubMed] [Google Scholar]
- Smith SM, Fox PT, Miller KL, Glahn DC, Fox PM, Mackay CE, Filippini N, Watkins KE, Toro R, Laird AR, Beckmann CF. The functional architecture of the human brain: Correspondence between resting FMRI and task-activation studies. Proc Natl Acad Sci U S A. 2009;106:13040–13045. doi: 10.1073/pnas.0905267106. [DOI] [PMC free article] [PubMed] [Google Scholar]
- Sörös P, Inamoto Y, Martin RE. Functional brain imaging of swallowing: An activation likelihood estimation meta-analysis. Hum Brain Mapp. 2009;30:2426–2439. doi: 10.1002/hbm.20680. [DOI] [PMC free article] [PubMed] [Google Scholar]
- Spreng RN, Mar RA, Kim AS. The common neural basis of autobiographical memory, prospection, navigation, theory of mind and the default mode: A quantitative meta-analysis. J Cogn Neurosci. 2009;21:489–510. doi: 10.1162/jocn.2008.21029. [DOI] [PubMed] [Google Scholar]
- Sridharan D, Levitin DJ, Menon V. A critical role for the right fronto-insular cortex in switching between central-executive and default mode networks. Proc Natl Acad Sci U S A. 2008;105:12569–12574. doi: 10.1073/pnas.0800005105. [DOI] [PMC free article] [PubMed] [Google Scholar]
- Toro R, Fox PT, Paus T. Functional coactivation map of the human brain. Cereb Cortex. 2008;18:2553–2559. doi: 10.1093/cercor/bhn014. [DOI] [PMC free article] [PubMed] [Google Scholar]
- Turkeltaub PE, Eden GF, Jones KM, Zeffiro TA. Meta-analysis of the functional neuroanatomy of single-word reading: method and validation. Neuroimage. 2002;16:765–780. doi: 10.1006/nimg.2002.1131. [DOI] [PubMed] [Google Scholar]
- Uddin LQ, Kelly AM, Biswal BB, Xavier Castellanos F, Milham MP. Functional connectivity of default mode network components: Correlation, anticorrelation, and causality. Hum Brain Mapp. 2009;30:625–637. doi: 10.1002/hbm.20531. [DOI] [PMC free article] [PubMed] [Google Scholar]
- Wager TD, Lindquist MA, Nichols TE, Kober H, Van Snellenberg JX. Evaluationg the consistency and specificity of neuroimaging data using meta-analysis. Neuroimage. 2009;45:S210–S221. doi: 10.1016/j.neuroimage.2008.10.061. [DOI] [PMC free article] [PubMed] [Google Scholar]
- Xiong J, Parsons LM, Gao JH, Fox PT. Interregional connectivity to primary motor cortex revealed using MRI resting state images. Hum Brain Mapp. 1999;8:151–156. doi: 10.1002/(SICI)1097-0193(1999)8:2/3<151::AID-HBM13>3.0.CO;2-5. [DOI] [PMC free article] [PubMed] [Google Scholar]