Abstract
Tumor progression is driven by genetic mutations, but little is known about the environmental conditions that select for these mutations. Studying the transcriptomes of paired colorectal cancer cell lines that differed only in the mutational status of their KRAS or BRAF genes, we found that GLUT1, encoding glucose transporter-1, was one of three genes consistently upregulated in cells with KRAS or BRAF mutations. The mutant cells exhibited enhanced glucose uptake and glycolysis and survived in low glucose conditions, phenotypes that all required GLUT1 expression. In contrast, when cells with wild-type KRAS alleles were subjected to a low glucose environment, very few cells survived. Most surviving cells expressed high levels of GLUT1 and 4% of these survivors had acquired new KRAS mutations. The glycolysis inhibitor, 3-bromopyruvate preferentially suppressed the growth of cells with KRAS or BRAF mutations. Together, these data suggest that glucose deprivation can drive the acquisition of KRAS pathway mutations in human tumors.
Mutations in oncogenes and tumor suppressor genes endow cancer cells with the ability to outgrow their neighboring cells in situ (1). Though numerous studies have identified the downstream effects of such mutations and their biochemical mediators, there is relatively little known about the microenvironmental conditions that provide the selective advantage that allows cells with such mutations to clonally expand. Mutations in KRAS commonly occur in colorectal, pancreatic, and some forms of lung cancer, while BRAF mutations occur commonly in melanomas as well as in colorectal tumors without KRAS mutations (2–4). BRAF and KRAS mutations are mutually exclusive, that is, do not occur in the same tumor, suggesting a common origin and effect. Indeed, KRAS binds to and activates BRAF, thereby activating MAPK signaling pathways (5, 6). Despite advances in the molecular delineation of the RAS/RAF pathway, the specific environmental pressures that drive KRAS and BRAF mutations and how KRAS and BRAF mutations alleviate these pressures are unknown.
To explore this issue, we developed isogenic colorectal cancer (CRC) cell lines in which the endogenous wild-type (wt) or mutant alleles had been inactivated through targeted homologous recombination (table S1, fig. S1 and fig. S2) (7). We chose to use targeted homologous recombination instead of the more commonly used overexpression or siRNA-dependent systems because only the former permits examination of cells expressing normal or mutant proteins at physiological, normally regulated levels (8). For the investigation of BRAF mutations, we used RKO and VACO432, CRC lines with valine to glutamate mutations at codon 600 (V600E) of BRAF. This is the most common BRAF mutation in human tumors, accounting for over 90% of BRAF mutations (3). To analogously investigate KRAS, we used HCT116 and DLD1, CRC lines with glycine to aspartate mutations at codon 13 (G13D). This mutation is one of the most common in CRC, accounting for ~20% of KRAS mutations (2). These paired lines essentially differ in only one base pair - the base that is mutated or wild-type in KRAS or BRAF. At least two independent clones of each of the derivatives of each of the four parental cell lines were developed (table S1). In all cases, independent clones with the same genotype behaved similarly in the assays described below.
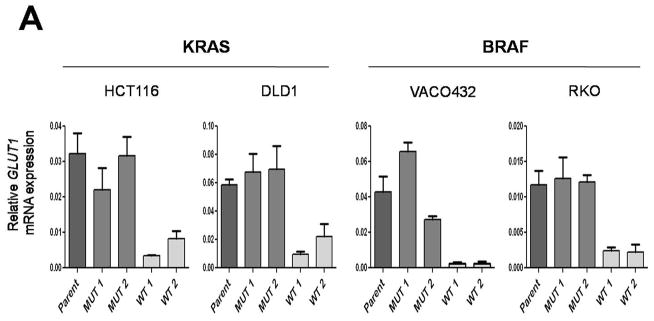
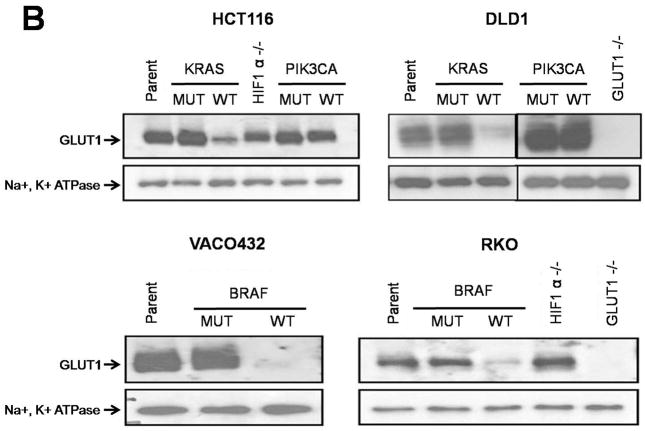
Based on the mutual exclusivity of KRAS and BRAF mutations and knowledge of the KRAS pathway described above, we reasoned that mutations of both genes would result in common deregulation of a discrete set of transcripts. We performed expression analysis on clones of various genotypes with microarrays as well as with massively parallel sequencing of serial analysis of gene expression (SAGE) tags. Only three genes were found to be more than two-fold upregulated in all four lines containing mutant KRAS or BRAF alleles compared to their isogenic counterparts containing wt alleles: GLUT1 (also known as SLC2A1), DUSP5 and DUSP6 (fig. S3). DUSP5 and DUSP6 are known feedback regulators of MAPK signaling pathway, up-regulated when the pathway is active (9) and were thus unlikely to be positive effectors of KRAS and BRAF tumorigenesis. On the other hand, GLUT1 was intriguing as it encodes a glucose transporter known to be over-expressed in many types of cancer and its high expression in tumors has been associated with poor prognosis (10, 11). We confirmed the results of the microarray and SAGE expression analyses through quantitative-PCR. GLUT1 transcript expression was always higher, ranging from 3- to 22- fold, in the clones with mutant KRAS or BRAF alleles compared to the isogenic clones with wt alleles (Fig. 1A and fig. S3). Accordingly, we found that the expression of the GLUT1 protein was markedly higher in cells with mutant KRAS or BRAF alleles (Fig. 1B). Targeted disruptions of both alleles of GLUT1 in RKO and DLD1 cells (table S1 and fig. S4) were used as negative controls to ensure the specificity of the antibodies to GLUT1 (Fig. 1B). As expected, the GLUT1 protein was found in the membrane fraction of cells, regardless of BRAF or KRAS mutational status. Of the 12 human glucose transporter homologs present in the human genome (10), only GLUT1 was upregulated in the mutant BRAF or KRAS-containing lines compared to those with wt alleles.
Fig. 1.
Expression of GLUT1 in matched pairs of isogenic clones. (A) Expression levels of GLUT1 transcripts were determined by real-time PCR and normalized to those of β-actin. Each panel includes the parental line (Parent), which harbors both mutant and wild-type alleles of KRAS or BRAF, two independent clones with only mutant alleles (MUT1 and MUT2) and two independent clones with only wild-type alleles (WT1 and WT2). The data represent the mean and SD of triplicate experiments. The differences between MUT and WT clones were statistically significant in all cases (P < 0.05, Student’s t-test). (B) Expression of GLUT1 membrane-associated protein levels as determined by immunoblotting. Na+,K+-ATPase, a membrane associated protein, was used as a loading control.
To further test the specificity of the upregulation of GLUT1, we evaluated its expression in cell lines in which the mutant or wt alleles of PIK3CA had been disrupted by targeted homologous recombination (12). PIK3CA has been implicated in the RAS/RAF pathways as well as in metabolic regulation and is commonly mutated in cancers (12, 13). Unlike KRAS and BRAF, the PIK3CA genotype did not have a clear effect on GLUT1 protein expression (Fig. 1B). We also tested lines with targeted disruptions of both alleles of HIF1A (14) (table S1). Though HIF1A has been shown to regulate transcription of GLUT1 in hypoxic conditions (15–17), GLUT1 expression was found to be largely independent of HIF1A status when cells were grown in normal oxygen concentrations (Fig. 1B).
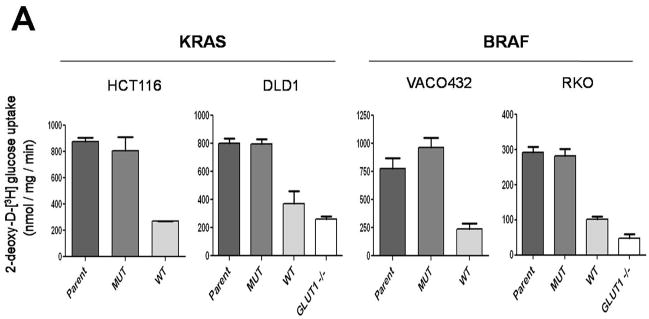
We suspected that the upregulation of GLUT1 would result in increased glucose uptake in the clones with mutant KRAS or BRAF alleles. To test this hypothesis, we incubated cells with 2-deoxy-D-[3H] glucose (2-DG), a non-hydrolyzable glucose analog, and measured its uptake. We found that the upregulation of GLUT1 was accompanied by significant increase in glucose uptake in all cells with mutant KRAS or BRAF alleles compared to the isogenic cells with wt alleles (Fig. 2A). Disruption of GLUT1 substantially inhibited glucose uptake, demonstrating that GLUT1 was the major glucose transporter in these cancer cells (Fig. 2A).
Fig. 2.
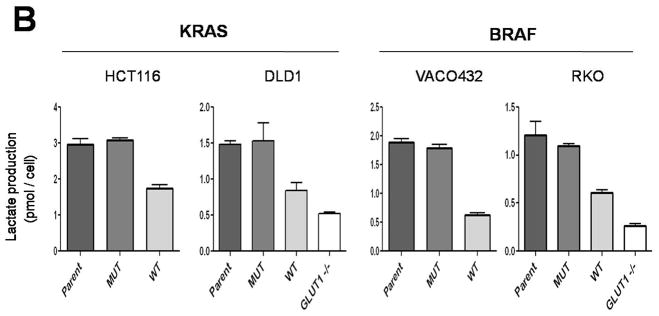
Glucose uptake and lactate production in cells with KRAS or BRAF mutations. (A) Glucose uptake, as determined using [3H] 2-deoxyglucose, was normalized to total protein. Differences between MUT and WT clones were statistically significant (P < 0.01, Student’s t-test). (B) Lactate production was normalized to cell number. The differences between MUT and WT clones were statistically significant in all cases (P < 0.03, Student’s t-test). The data represent the mean and SD of triplicate experiments.
We next determined whether the increased glucose transport was associated with increased lactate production. Lactate production was indeed significantly increased in cells with mutant KRAS or BRAF alleles, indicating an increased rate of glycolysis and consistent with higher glucose uptake (Fig. 2B). Lactate production was very low in cells without GLUT1 genes, as would be expected if GLUT1 was the major glucose transporter in these cells (Fig. 2B). On the other hand, oxygen consumption was not different in cells with mutant KRAS or BRAF alleles than in cells with wt alleles of these genes, suggesting that mitochondrial function and oxidative respiration were not affected by KRAS or BRAF mutation (fig. S5). Accordingly, there were no consistent differences in cellular ATP concentrations or ATP/ADP ratios in cells with mutant KRAS or BRAF alleles compared to their wt counterparts (figs. S6 and S7).
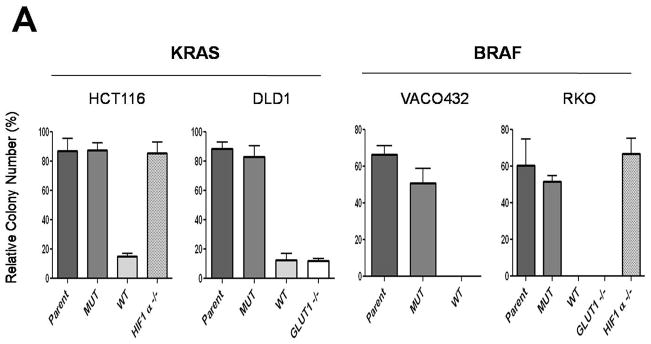
These results suggested that the increase in glucose uptake and glycolysis might provide a growth advantage to cells with KRAS or BRAF mutations in low glucose environments. When grown in standard, commercially available media (25 mM glucose), all cell lines, including those without GLUT1 gene, grew reasonably well (fig. S8) and formed colonies when plated at low density. However, when placed in media containing low glucose concentrations (0.5 mM), only cell lines with KRAS or BRAF mutant alleles were able to survive (Fig. 3A). This growth was dependent on GLUT1, as cells in which the GLUT1 gene was inactivated by targeted homologous recombination lost their ability to form colonies in low glucose, even though they contained mutant KRAS or BRAF genes (Fig. 3A). In contrast, such growth was independent of HIF1A, as cells with mutant KRAS or BRAF alleles survived in low glucose when the HIF1A gene was inactivated by targeted homologous recombination (Fig. 3A).
Fig. 3.
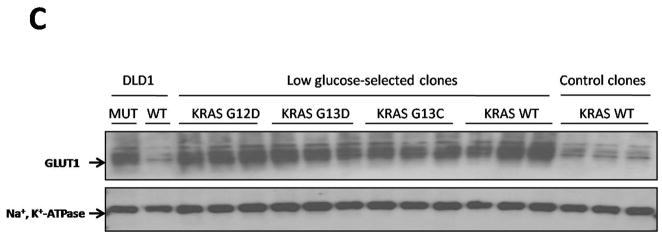
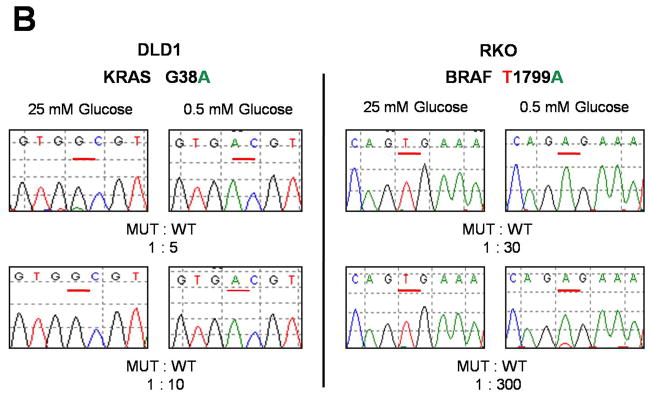
KRAS and BRAF mutations confer a selective growth advantage in hypoglycemic conditions. (A) Cells were subjected to a low glucose environment (0.5 mM) for two (RKO and VACO432) or four (HCT116 and DLD1) days, then dissociated and plated in media containing standard concentrations of glucose (25 mM). Colony counts were normalized to those obtained in cells subjected to the same experimental procedure with the exception that standard glucose levels were substituted for low glucose. See (7) for details. The differences between MUT and WT clones were statistically significant in all cases (P < 0.004, Student’s t-test). (B) MUT and WT clones were mixed at the indicated ratios and grown in media with 0.5 mM glucose for two days (RKO) or five days (DLD1). The media was replaced with one containing 25 mM glucose and the cells incubated for another 10–16 days. RNA was purified from the cells that survived and the KRAS or BRAF genes were PCR-amplified and sequenced. G and A nucleotides at the underlined positions in the sequencing chromatograms represent wt and mutant alleles of KRAS, respectively, in DLD1 cells. T and A nucleotides represent wt and mutant alleles of BRAF, respectively, in RKO cells. (C) DLD1 cells in which the mutant KRAS allele had been deleted by targeted recombination (KRAS (−/+)), were plated in low glucose (0.5 mM). After 25–30 days, the few clones that survived were grown in standard glucose (25 mM) and assessed for GLUT1 expression and the sequence of the KRAS gene. Clones which harbored mutant alleles of KRAS (G12D, G13D, or G13C) are indicated, as are clones in which KRAS remained WT. As controls, the same cells (KRAS (−/+)) were plated at limiting dilution in media containing 25 mM glucose and individual clones assessed for GLUT1 expression (“Control Clones”). The parental cells used for these experiments (DLD1, WT) are also included, as were their isogenic counterparts in which the wt rather than the mutant allele was disrupted by homologous recombination (DLD1, MUT). All clones had been growing in media containing 25 mM glucose for at least 20 days when harvested for the assessment of GLUT1 expression by immunoblotting. Na+,K+-ATPase was used as a loading control. A diagram of the selection scheme is provided in fig. S10 and detailed methods are provided in (7).
We then determined whether clones with mutant KRAS or BRAF genes could selectively outgrow cells without these mutations. For this purpose, cells with mutant KRAS or BRAF alleles were mixed with an excess of cells containing wt KRAS or BRAF alleles, respectively, and were incubated in either low glucose (0.5 mM) or standard concentrations of glucose (25 mM). Cells with mutant KRAS or BRAF alleles preferentially survived in low glucose and overtook the population within two weeks after changing the medium to one containing 25 mM glucose. In contrast, the cells with wt alleles remained predominant when they were not exposed to low glucose conditions (Fig. 3B).
To further mimic situations that might occur in vivo, we subjected cells with only wt alleles (obtained by disrupting the mutant KRAS or BRAF alleles; figs. S1 and S2) to a low glucose environment in vitro and isolated the few colonies that survived (fig. S10). We reasoned that in the ~35 generations that had elapsed between targeted disruption and this experiment, a small fraction of cells would have spontaneously acquired mutations in genes that could potentially permit them to survive in medium containing low glucose concentrations. The fact that the two cell lines used for this experiment were both mismatch repair deficient should have facilitated the development of such de novo mutations (18). We found that the fraction of DLD1 KRAS (−/+) or RKO BRAF (−/−/+) cells that could form colonies in low glucose conditions was ~0.05%. Once formed, the colonies were grown in medium containing standard concentrations of glucose (25 mM). We found that more than 75% of the clones derived from either cell line after selection in low glucose stably expressed high levels of GLUT1 protein, even when subsequently grown in standard medium (25 mM glucose; Fig. 3C and fig. S11). Thus, the selection for growth in low glucose resulted in a permanent upregulation of GLUT1 expression in the majority of clones that survived, and this upregulation persisted after normoglycemia was reinstituted, indicating a heritable change. Control clones derived analogously, but with 25 mM glucose substituted for 0.5 mM glucose during the selection period, did not show elevated GLUT1 expression (Fig. 3C and fig. S11). When the clones derived from DLD1 KRAS (−/+) cells were assessed for mutations, 4.4% of the clones arising under hypoglycemic conditions had mutations in KRAS (73.5% of these had G12D, 25.2% had G13D, 1.3% had G13C; and 0% had BRAF V600E or other mutations in KRAS at codon 12 or 13). No KRAS or BRAF mutations were identified in 2,000 DLD1 KRAS (−/+) clones generated in the presence of standard concentrations of glucose (p<0.000001, χ2). In the clones derived from RKO BRAF(−/−/+) cells, 0.8% of the clones surviving low glucose exposure had a G12D KRAS mutation, while none of 2,000 clones grown in the presence of standard glucose concentrations had such mutations (p<0.01, χ2).
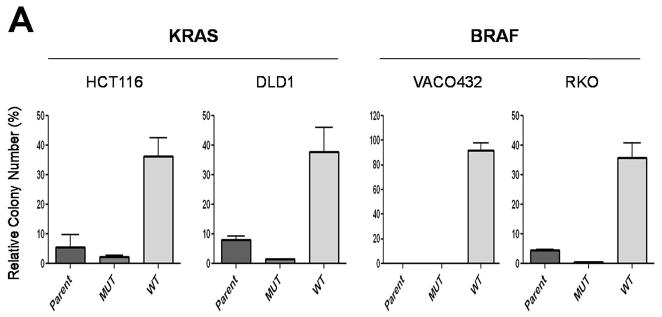
We next attempted to exploit this phenotype to specifically target cancer cells with KRAS or BRAF mutations. We reasoned that cells with KRAS or BRAF mutations had stably reprogrammed their metabolic pathways and might be dependent on glycolysis for growth. Accordingly, an agent such as 3-bromopyruvate (3-BrPA), that inhibits glucose metabolism through inhibition of hexokinase (19), might be selectively toxic to cells with KRAS or BRAF mutations. When this hypothesis was tested experimentally in the paired isogenic cell lines, it was found that 3-BrPA was highly toxic to HCT116, DLD1, VACO432 and RKO cells with KRAS or BRAF mutations but was much less toxic to the matched cell lines lacking KRAS or BRAF mutant alleles (Fig. 4A).
Fig. 4.
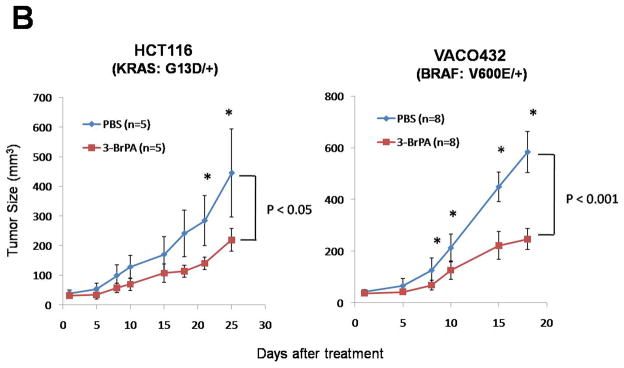
The glycolysis inhibitor 3-BrPA is selectively toxic to cells with mutant KRAS or BRAF alleles. (A) Colony formation was assessed after 3-BrPA treatment (110 μM) for three days. Colony counts were normalized to those obtained from cells subjected to the same procedure without exposure to 3-BrPA. The differences between MUT and WT clones were statistically significant in all cases (P < 0.008, Student’s t-test). (B) Mice with subcutaneous tumors established from HCT116 (KRAS: G13D/+) or VACO432 (BRAF: V600E/+) cells were injected intraperitoneally with 3-BrPA or phosphate buffered saline (PBS) daily for two weeks. “n” represents the number of mice used in each group. Points and error bars represent the means and SD for each group of mice. Asterisks denote times when there were significant differences between the tumor sizes in the PBS vs. 3-BrPA groups (P < 0.05, Student’s t-test).
We next wished to determine whether this approach might be applicable in experimental tumors in animals. As a prelude, we found that cells with disrupted mutant KRAS or BRAF alleles grew poorly as xenografts in nude mice compared to their isogenic counterparts with mutant alleles (fig. S12). DLD1 and RKO cells in which the GLUT1 gene was disrupted also grew poorly in nude mice, even though these cells contained mutant KRAS and BRAF alleles, respectively (fig. S12). These results indicated that the microenvironment in xenografts in some ways mimicked the low glucose environment in vitro and provided a reasonable system to test the effects of glycolytic inhibitors. Indeed, 3-BrPA significantly inhibited the growth of established xenografts derived from HCT116 and VACO432 cells (Fig. 4B). Though this result was not sufficiently robust to warrant implementation in a clinical setting, it provided proof-of-principle that glycolytic inhibitors can retard tumor growth at doses that are non-toxic to normal tissues in vivo.
Our results led us to investigate glucose metabolism in a completely unbiased way, thereby considerably complementing previous work by other investigators. For example, a role for metabolic abnormalities in cancer has become increasingly recognized (20, 21). These metabolic abnormalities often appear to involve abnormal glycolysis, as first demonstrated decades ago by Otto Warburg (22). Insightful hypotheses about the manifold ways in which such metabolic abnormalities can promote tumor progression have been described (23–25). It has also been demonstrated that transformation of rodent fibroblasts by several oncogenes, including HRAS, can upregulate glucose transporter expression (16, 26–28). However, because transformation by overexpressed oncogenes affects the expression of hundreds of genes and dramatically alters the phenotype of rodent fibroblasts, the relationship between increased glucose transporter expression and tumorigenesis was not clear. In human tumor cells, no obvious relationship between GLUT1 and RAS mutations has been identified (29, 30). Moreover, in many previous experimental studies in rodent cells, the increased GLUT1 expression was ascribed to induction of HIF1A and linked to hypoxia (15, 16, 31, 32). Our results show that the increased GLUT1 transcription was unrelated to HIF1A because genetic disruption of the HIF1A gene did not affect the expression of GLUT1, nor did it affect survival under hypoglycemic conditions. Notably, cells without mutant KRAS or BRAF alleles were remarkably sensitive to hypoglycemia, but not to hypoxia (Fig. 3 and fig. S9). Furthermore, the changes in GLUT1 expression and resultant metabolic changes in human colorectal cancer cells were stable phenotypes rather than transient responses to low glucose, as they persisted under normoglycemic conditions. This stability is consistent with them being the consequence of specific genetic mutations, such as those in KRAS or BRAF. In aggregate, our results suggest that low glucose environments are a driving force underlying the development of KRAS and BRAF mutations during tumorigenesis.
F-18-Fluoro-deoxyglucose (FDG)-Positron Emission Tomography (PET) scans are routinely used to image cancers in the clinic. Positive signals in cancers are the result of increased glucose transporter expression or glucose uptake (33). Our data showed that in four different human cancer cell lines, an increase in GLUT1 expression and glucose uptake was critically dependent on KRAS or BRAF mutations. It is interesting that abnormal FDG-PET signals can be observed in progressing pre-malignant colorectal neoplasms (adenomas) congruent with the time during tumorigenesis in which KRAS or BRAF mutations appear (34, 35).
The results also raise a variety of as yet unanswered questions. One concerns the relationship between hypoxia and hypoglycemia. Though both these deficiencies are likely to be encountered in tumor microenvironments, it is possible that each condition sets the stage for selection of particular genetic abnormalities (23). For example, hypoglycemic conditions favor the selection of cells with KRAS or BRAF mutations, while hypoxic conditions may favor the selection of cells with PIK3CA, CMYC or TP53 mutations (20, 36). Another issue for consideration is that 90% of colorectal cancers exhibit high FDG-PET signals and GLUT1 expression (34, 37, 38), whereas KRAS or BRAF mutations are only observed in ~50% of such cancers (4). One possibility to explain this discrepancy is that other genetic alterations that impact the same pathway can substitute for KRAS and BRAF mutations in upregulating GLUT1. This idea is consistent with recent data indicating that the same pathway can be mutationally activated through disparate mutations in numerous genes (1, 39, 40). It is also consistent with our in vitro selection experiments. Though the majority of clones that survived hypoglycemia upregulated GLUT1, only a minority of these clones had acquired KRAS or BRAF mutations.
Supplementary Material
References and Notes
- 1.Vogelstein B, Kinzler KW. Nat Med. 2004;10:789. doi: 10.1038/nm1087. [DOI] [PubMed] [Google Scholar]
- 2.Bos JL. Cancer Res. 1989;49:4682. [PubMed] [Google Scholar]
- 3.Davies H, et al. Nature. 2002;417:949. doi: 10.1038/nature00766. [DOI] [PubMed] [Google Scholar]
- 4.Rajagopalan H, et al. Nature. 2002;418:934. doi: 10.1038/418934a. [DOI] [PubMed] [Google Scholar]
- 5.Marshall CJ. Curr Opin Cell Biol. 1996;8:197. doi: 10.1016/s0955-0674(96)80066-4. [DOI] [PubMed] [Google Scholar]
- 6.Downward J. Nat Rev Cancer. 2003;3:11. doi: 10.1038/nrc969. [DOI] [PubMed] [Google Scholar]
- 7.See supporting material on Science Online.
- 8.Van Dyke T, Jacks T. Cell. 2002;108:135. doi: 10.1016/s0092-8674(02)00621-9. [DOI] [PubMed] [Google Scholar]
- 9.Owens DM, Keyse SM. Oncogene. 2007;26:3203. doi: 10.1038/sj.onc.1210412. [DOI] [PubMed] [Google Scholar]
- 10.Macheda ML, Rogers S, Best JD. J Cell Physiol. 2005;202:654. doi: 10.1002/jcp.20166. [DOI] [PubMed] [Google Scholar]
- 11.Sakashita M, et al. Eur J Cancer. 2001;37:204. doi: 10.1016/s0959-8049(00)00371-3. [DOI] [PubMed] [Google Scholar]
- 12.Samuels Y, et al. Cancer Cell. 2005;7:561. doi: 10.1016/j.ccr.2005.05.014. [DOI] [PubMed] [Google Scholar]
- 13.Yuan TL, Cantley LC. Oncogene. 2008;27:5497. doi: 10.1038/onc.2008.245. [DOI] [PMC free article] [PubMed] [Google Scholar]
- 14.Dang DT, et al. Cancer Res. 2006;66:1684. doi: 10.1158/0008-5472.CAN-05-2887. [DOI] [PubMed] [Google Scholar]
- 15.Zhang JZ, Behrooz A, Ismail-Beigi F. Am J Kidney Dis. 1999;34:189. doi: 10.1016/s0272-6386(99)70131-9. [DOI] [PubMed] [Google Scholar]
- 16.Chen C, Pore N, Behrooz A, Ismail-Beigi F, Maity A. J Biol Chem. 2001;276:9519. doi: 10.1074/jbc.M010144200. [DOI] [PubMed] [Google Scholar]
- 17.Airley RE, Mobasheri A. Chemotherapy. 2007;53:233. doi: 10.1159/000104457. [DOI] [PubMed] [Google Scholar]
- 18.Modrich P, Lahue R. Annu Rev Biochem. 1996;65:101. doi: 10.1146/annurev.bi.65.070196.000533. [DOI] [PubMed] [Google Scholar]
- 19.Ko YH, et al. Biochem Biophys Res Commun. 2004;324:269. doi: 10.1016/j.bbrc.2004.09.047. [DOI] [PubMed] [Google Scholar]
- 20.Kim JW, Gao P, Dang CV. Cancer Metastasis Rev. 2007;26:291. doi: 10.1007/s10555-007-9060-4. [DOI] [PubMed] [Google Scholar]
- 21.Gatenby RA, Gillies RJ. Nat Rev Cancer. 2004;4:891. doi: 10.1038/nrc1478. [DOI] [PubMed] [Google Scholar]
- 22.Warburg O. Science. 1956;123:309. doi: 10.1126/science.123.3191.309. [DOI] [PubMed] [Google Scholar]
- 23.Gillies RJ, Robey I, Gatenby RA. J Nucl Med. 2008;49(Suppl 2):24S. doi: 10.2967/jnumed.107.047258. [DOI] [PubMed] [Google Scholar]
- 24.Hsu PP, Sabatini DM. Cell. 2008;134:703. doi: 10.1016/j.cell.2008.08.021. [DOI] [PubMed] [Google Scholar]
- 25.Vander Heiden MG, Cantley LC, Thompson CB. Science. 2009;324:1029. doi: 10.1126/science.1160809. [DOI] [PMC free article] [PubMed] [Google Scholar]
- 26.Flier JS, Mueckler MM, Usher P, Lodish HF. Science. 1987;235:1492. doi: 10.1126/science.3103217. [DOI] [PubMed] [Google Scholar]
- 27.Hausdorff SF, Frangioni JV, Birnbaum MJ. J Biol Chem. 1994;269:21391. [PubMed] [Google Scholar]
- 28.Chiaradonna F, et al. Oncogene. 2006;25:5391. doi: 10.1038/sj.onc.1209528. [DOI] [PubMed] [Google Scholar]
- 29.Noguchi Y, et al. Cancer Lett. 2000;154:137. doi: 10.1016/s0304-3835(00)00354-2. [DOI] [PubMed] [Google Scholar]
- 30.Ramanathan A, Wang C, Schreiber SL. Proc Natl Acad Sci U S A. 2005;102:5992. doi: 10.1073/pnas.0502267102. [DOI] [PMC free article] [PubMed] [Google Scholar]
- 31.Airley R, et al. Clin Cancer Res. 2001;7:928. [PubMed] [Google Scholar]
- 32.Blum R, Jacob-Hirsch J, Amariglio N, Rechavi G, Kloog Y. Cancer Res. 2005;65:999. [PubMed] [Google Scholar]
- 33.Gu J, et al. Dig Dis Sci. 2006;51:2198. doi: 10.1007/s10620-006-9428-2. [DOI] [PubMed] [Google Scholar]
- 34.Yasuda S, et al. J Nucl Med. 2001;42:989. [PubMed] [Google Scholar]
- 35.van Kouwen MC, Nagengast FM, Jansen JB, Oyen WJ, Drenth JP. J Clin Oncol. 2005;23:3713. doi: 10.1200/JCO.2005.02.401. [DOI] [PubMed] [Google Scholar]
- 36.Matoba S, et al. Science. 2006;312:1650. doi: 10.1126/science.1126863. [DOI] [PubMed] [Google Scholar]
- 37.Delbeke D, et al. J Nucl Med. 1997;38:1196. [PubMed] [Google Scholar]
- 38.Abdel-Nabi H, et al. Radiology. 1998;206:755. doi: 10.1148/radiology.206.3.9494497. [DOI] [PubMed] [Google Scholar]
- 39.Lin J, et al. Genome Res. 2007;17:1304. doi: 10.1101/gr.6431107. [DOI] [PMC free article] [PubMed] [Google Scholar]
- 40.Parsons DW, et al. Science. 2008;321:1807. doi: 10.1126/science.1164382. [DOI] [PMC free article] [PubMed] [Google Scholar]
- 41.We thank Y. He for helpful discussions, W. Yu for help with the microarray experiments and E. Watson for expert technical assistance. This work was supported by the Virginia and D.K. Ludwig Fund for Cancer Research and The US National Institutes of Health grants CA43460 and CA62924. Under agreements between the Johns Hopkins University, Genzyme Molecular Oncology, Novartis, Wyeth, Amgen, Glaxo-Smith-Kline and Horizon, J.Y., V.V., H.R., R.P., C.L., K.W. K., B.V., and N.P. are entitled to a share of the royalties and licensing fees received by the University on cell lines described in this paper, some of which are the subject of patent application. The University and V.V., K.W.K., and B.V. also own stock in Genzyme, which is subject to certain restrictions under University policy. The terms of these arrangements are being managed by the University in accordance with its conflict of interest policies.
Associated Data
This section collects any data citations, data availability statements, or supplementary materials included in this article.


