

Abstract
Salla disease and infantile sialic acid storage disease are autosomal recessive lysosomal storage disorders caused by mutations in the gene encoding sialin, a membrane protein that transports free sialic acid out of the lysosome after it is cleaved from sialoglycoconjugates undergoing degradation. Accumulation of sialic acid in lysosomes defines these disorders, and the clinical phenotype is characterized by neurodevelopmental defects, including severe CNS hypomyelination. In this study, we used a sialin-deficient mouse to address how loss of sialin leads to the defect in myelination. Behavioral analysis of the sialin−/− mouse demonstrates poor coordination, seizures, and premature death. Analysis by histology, electron microscopy, and Western blotting reveals a decrease in myelination of the CNS but normal neuronal cytoarchitecture and normal myelination of the PNS. To investigate potential mechanisms underlying CNS hypomyelination, we studied myelination and oligodendrocyte development in optic nerves. We found reduced numbers of myelinated axons in optic nerves from sialin−/− mice, but the myelin that was present appeared grossly normal. Migration and density of oligodendrocyte precursor cells were normal; however, a marked decrease in the number of postmitotic oligodendrocytes and an associated increase in the number of apoptotic cells during the later stages of myelinogenesis were observed. These findings suggest that a defect in maturation of cells in the oligodendrocyte lineage leads to increased apoptosis and underlies the myelination defect associated with sialin loss.
Introduction
Sialic acids are amino sugars that play an important role in nervous system development and function. As negatively charged terminal residues of glycan chains, sialic acids have been implicated in electrostatic-based intermolecular interactions that mediate cell–cell recognition, cell adhesion, and intercellular signaling (Vyas and Schnaar, 2001; Sampathkumar et al., 2006). Modulation of sialic acid content in glycoproteins and glycolipids (gangliosides) is crucial for normal neurodevelopment and requires tightly regulated expression and efficient downregulation of sialic-acid-containing macromolecules (Rösner, 2003).
A primary pathway for catabolism of sialoglycoconjugates is lysosomal degradation. Once these macromolecules are trafficked to the lysosome, sialic acid residues are sequentially removed through hydrolysis of the terminal glycosidic linkages by acid sialidases (neuraminidases). The liberated free sialic acid is then exported from the lysosome through the sialic acid transporter, sialin. Mutations in the gene encoding sialin lead to the recessive allelic lysosomal storage disorders, Salla disease, and infantile sialic acid storage disease (ISSD) (Verheijen et al., 1999). Biochemical studies have shown a direct correlation between sialin transport activity and severity of disease phenotype (Morin et al., 2004; Wreden et al., 2005; Myall et al., 2007; Ruivo et al., 2008). Mutations that produce a functional but less active transporter, as found in Salla disease, show a less severe phenotype than mutations with complete loss of function, typical of ISSD (Aula et al., 2000).
In both Salla disease and ISSD, the nervous system is predominantly affected with varying degrees of developmental delay in motor and cognitive skills, epilepsy, and premature death. The small number of neuropathological studies have consistently identified cytoplasmic vacuoles typical of lysosomal storage disorders and hypomyelination as prominent features (Autio-Harmainen et al., 1988; Pueschel et al., 1988; Mancini et al., 1991; Lemyre et al., 1999). Clinical imaging studies also indicate a defect in white matter formation (Haataja et al., 1994; Morse et al., 2005). However, the limited number and descriptive nature of these studies leave many unanswered questions regarding the progression of the cellular and molecular pathophysiology associated with the loss of sialin.
To identify potential mechanisms underlying the pathology of these disorders, we have characterized a sialin-deficient mouse. Through behavioral and neuropathological analyses, we show that the sialin−/− mouse strain has a phenotype consistent with the free sialic acid storage disorders. Our observations reveal poor coordination, seizures, a failure to thrive, and premature death associated with loss of sialin expression. In addition to prominent vacuolar lesions, our histological characterization demonstrates a marked decrease in myelin throughout the CNS with normal-appearing myelin in the PNS. Using ultrastructural and molecular characterization of myelinogenesis in the sialin−/− mice, we further find that there is normal migration and proliferation of oligodendrocyte precursor cells (OPCs) but a reduction in mature myelin-producing oligodendrocytes that is likely a consequence of oligodendrocyte lineage apoptosis. Finally, we find a delay in the developmentally regulated reduction in expression of polysialic acid-neural cell adhesion molecule (PSA-NCAM), providing a potential molecular mechanism for the impaired myelination and reduction in oligodendrocyte number.
Materials and Methods
Experimental animals.
All experimental procedures were approved by the Stanford Institutional Animal Care and Use Committee. Three male mice heterozygous for the sialin gene (B6; 129S5–Slc17a5tm1Lex) were obtained from the Mutant Mouse Regional Resource Centers (MMRRC) (www.mmrrc.org). These mice were originally generated from 129S5/SvEvBrd-derived embryonic stem cells by Lexicon Genetics through use of targeted homologous recombination. Specifically, the 104 nucleotides beginning immediately after the first nucleotide of the coding sequence were replaced with an internal ribosomal entry site (IRES) domain, followed by a sequence coding for a β-galactosidase–neomycin (β-gal–neo) fusion protein. Subsequent to procurement from the MMRRC, heterozygous male mice were crossed to C57BL(Thy1.2) female mice, and the colony was maintained by sequentially crossing two generations of mice heterozygous for the mutation in sialin for every cross out to C57BL females.
Genotyping.
For PCR genotyping, sense and antisense oligonucleotide primers, their location, and predicted fragment lengths were as follows: sialin knock-out allele, 5′-GCAGCGCATCGCCTTCTATC-3′ and 5′-GCTAAGCGGAACCTGGCG-3′, 450 bp; wild-type sialin allele, 5′-GCTGGTGACACACATCTTGC-3′ and 5′-CCGCTTCGGTCTGCCGG-3′, 322 bp.
Reverse transcription-PCR.
Total RNA was isolated using TRIzol (Invitrogen) or PureLink Micro-to-Midi Total RNA Purification System (Invitrogen), and complementary DNA templates were prepared from 5–7 μg of total RNA using random primers (GE Healthcare) and 200 U of SuperScript II reverse transcriptase (Invitrogen) according to the instructions of the manufacturers. Sense and antisense oligonucleotide primer pairs used for PCR amplification of sialin cDNA fragments and the predicted product sizes were as follows: exon 1–exon 4, 5′-AAACGACGATGAGGAGAGCTC-3′ and 5′-GCGTGCATAGCTGGAAACGT-3′, 521 bp; exon 5–exon 11, 5′-CTGGACTTACGTCTTCTATC-3′ and 5′-GATACAGAAGACAGTCTGCC-3′, 711 bp; exon 6–exon 11, 5′-ACTCACAAGACAATCTCCCA-3′ and 5′-TCAGTTTCTGTGTCCGTGGT-3′, 728 bp; exon 10–exon 11, 5′-GTATGCTGGCATCCTCTTGG-3′ and 5′-GATACAGAAGACAGTCTGCC-3′, 126 bp; and exon 11, 5′-TGGCAGACTGTCTTCTGTAT-3′ and 5′-TCAGTTTCTGTGTCCGTGGT-3′, 103 bp. For transferrin receptor cDNA fragment amplification, the sense oligonucleotide was 5′-TGGGAACAGGTCTTCTGTTG-3′, the antisense was 5′-TGCAGTCCAGCTGGCAAAGA-3′, and the predicted product size was 120 bp.
Footprint analysis.
Hindpaws and forepaws of 3-week-old mice were dipped into blue ink and red ink, respectively, and the mice were placed at one end of a cardboard tube (7.6 cm diameter × 93.3 cm length) with a clean sheet of white paper placed on the floor to record the footprints. The end where the mice were placed was covered, the other end was left uncovered, and the mice were allowed to walk freely toward the open end. The paper was removed, and the average stride length and variability of stride length were determined based on the distances between sequential left hindprints measured over a 25 cm segment of the paper. Coefficient of variation (CV) was calculated by normalizing the variance in stride lengths to the mean for each animal analyzed.
Electron microscopy.
Mice were anesthetized with isoflurane and rapidly decapitated. The brain, optic nerves, cervical spinal cord, and sciatic nerves were dissected out and placed in ice-cold fixative (2% paraformaldehyde/3% glutaraldehyde/0.1 m sodium cacodylate/0.05% CaCl2). Within 3 h, the tissue was cut into 3 mm sections, fixed overnight at 4°C in the same fixative, and then washed with 0.1 m cacodylate. The tissue was incubated with 2% OsO4 for 2 h at room temperature, washed with water, progressively dehydrated in ethanol/water mixtures, and then embedded in Epon resin. Sections were stained with toluidine blue for light microscopy evaluation. For transmission electron microscopy, ultrathin sections (50 nm) were stained with 4% uranyl acetate and then 2.5% lead nitrate for 5 min each at room temperature. The sections were observed and images captured using a JEOL 1010 transmission electron microscope. Bright-field images were taken with a Nikon Eclipse E1000 equipped with a Diagnostic Instruments digital camera.
Western blot.
Tissue was harvested as above, immediately frozen on dry ice, and stored at −80°C for later use. Subsequently samples were placed on ice and brought up in PBS containing protease inhibitors (in μg/ml: 2 aprotinin, 1 leupeptin, 2 antipain, 10 benzamidine, 35 phenylmethanesulfonyl fluoride, 1 chymostatin, and 1 pepstatin) and 1 mm EDTA. The tissue was minced with scissors, homogenized, and sonicated. Samples (2–20 μg) were subjected to SDS-PAGE and Western blotting. Primary antibodies were used as follows: rat anti-myelin basic protein (MBP) (1:2000; Millipore Bioscience Research Reagents), mouse monoclonal anti-β-actin (1:10,000; Sigma), mouse monoclonal anti-neurofilament-68 (1:4000; Sigma), and mouse anti-PSA-NCAM clone 2-2B (1:6000; Millipore Bioscience Research Reagents). HRP-conjugated secondary antibodies (Pierce) were used at 1:10,000. Proteins were detected using an ECL Western blotting detection system (GE Healthcare) and exposure of the blot to autoradiography film (Midsci). Scanned images of the films were generated, and band intensities were measured using NIH ImageJ software.
Immunohistochemistry and histology.
Optic nerves and brains were dissected out and fixed with ice-cold 4% paraformaldehyde in PBS overnight at 4°C and then cryoprotected in 30% sucrose in PBS. Optic nerves were embedded in OCT (Tissue-Tek) and cut into 10 μm sections using a cryostat. Brains were cut into 25 or 40 μm sections using a freezing microtome. Sections were stained with cresyl violet or subjected to immunostaining. For immunostaining, tissue sections (free floating or mounted on slides) were blocked and permeabilized in 5% BSA/3% horse serum/0.2% Triton X-100, followed by overnight incubation at 4°C with the indicated primary antibodies. Dilutions for primary antibodies were as follows: rabbit anti-Olig2 (1:500; Millipore Bioscience Research Reagents), rabbit anti-NG2 (1:500; Millipore Bioscience Research Reagents), mouse anti-APC/CC1 (1:500; EMD Biosciences), rat anti-MBP (1:200; Millipore Bioscience Research Reagents), mouse anti-NF68 (1:400; Sigma), rabbit anti-cleaved caspase-3 (1:1000; Cell Signaling Technology), rabbit anti-sialin (1:3600; Alpha Diagnostic), and mouse anti-contactin-associated protein (Caspr)/paranodin clone K65/35 (1:200; NeuroMab). Primary antibodies were detected with Alexa Fluor dye-conjugated (1:1000; Invitrogen) or Rhodamine Red-X-conjugated (1:1000; Jackson ImmunoResearch) secondary antibodies. After antibody incubations, some optic nerves were stained with Fluoromyelin Red Fluorescent Myelin Stain (1:300; Invitrogen) for 20 min at room temperature. For samples in which total cell counts were determined, nuclei were counterstained for 5 min with 100 nm 4′,6′-diamidino-2-phenylindole dihydrochloride (DAPI) (Invitrogen). Coverslips were mounted with MOWIOL anti-fading medium. Confocal images were taken with a Leica TCS SPE Spectral confocal microscope, epifluorescence images with a Nikon Eclipse E800 microscope equipped with a Nikon digital camera, and bright-field images with a Nikon Eclipse E1000 equipped with a Diagnostic Instruments digital camera.
Cell counts and myelin segment analysis.
All cell counts were done blind to genotype by an investigator not involved in sample preparation. Two high-power (63× objective) images were taken for each optic nerve, and the number of cells expressing the marker of interest in each image was determined by manual counting. Cell migration was assessed by counting the number of Olig2-positive (Olig2+) cells in separate images taken at the chiasmal, middle, and retinal segments of the optic nerve. To determine the number of apoptotic cells per square millimeter, 10-μm-thick longitudinal optic nerve sections immunostained for activated caspase-3 were viewed through a 20× objective on an epifluorescence microscope, and all cells expressing the antigen were manually counted. Bright-field images were then taken of the entire nerve at 4× magnification using Spot Advanced software, and the total area was determined using NIH ImageJ software.
To count the number and determine the length of individual myelin segments, z-series of confocal images (taken at 1 μm steps) were analyzed. NIH ImageJ software was used for length measurements.
Statistical analyses.
Data were expressed as mean ± SEM. At least three pairs of sialin−/− and control littermates were used for each experiment. All groups were compared using two-tailed unpaired t test unless otherwise specified.
Results
Sialin-deficient mice are small, uncoordinated, and die prematurely
Although the biochemistry of sialin and the clinical picture of the free sialic acid storage disorders are well described, a mechanistic link from sialin function to the clinical phenotype is lacking. To address this issue, we analyzed a sialin-deficient mouse (http://www.informatics.jax.org/external/ko/lexicon/2361.html). These mice were generated using standard homologous recombination to replace the first coding exon of the sialin gene with an IRES–β-gal–neo gene (Fig. 1A). We obtained heterozygous male mice from the Mutant Mouse Regional Resource Centers and established our own breeding colony. The birth rates of wild-type, heterozygous, and homozygous mutant animals from heterozygous crosses (29:46:26; n = 203 animals from 28 litters) were consistent with Mendelian distributions, implying that there is no in utero lethality associated with complete sialin deficiency.
Figure 1.
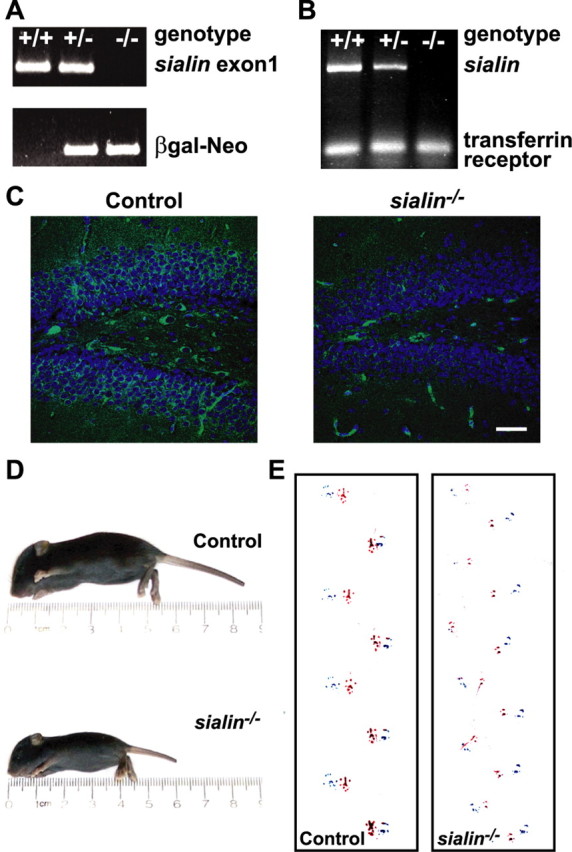
sialin−/− mice are small and uncoordinated. A, PCR amplification of genomic DNA with primers designed to detect the presence of exon 1 (top bands) and properly targeted β-galactosidase–neomycin gene (bottom bands) readily distinguishes wild-type (+/+), heterozygous (+/−), and homozygous mutant (−/−) animals. B, Analysis of RT-PCR of liver RNA with oligonucleotides designed to amplify exons 5–11 of sialin demonstrates the highest level of expression in wild-type animals, an intermediate level in heterozygous animals, and no detectable transcript in homozygous sialin mutant mice. RT-PCR of the transferrin receptor transcript was done to confirm the integrity of the samples. C, Immunofluorescence staining of the hippocampus from P21 mice with an anti-sialin antibody demonstrates strong expression in the granular layer and hilar neurons of the dentate gyrus in a heterozygous mouse (left) that is absent in a sialin−/− mouse (right). Nuclei are counterstained with DAPI. Background staining of blood vessels is seen in both images. D, P10 sialin mutant mice are smaller than age matched littermates. E, Representative footprint patterns from P21 control (left) and sialin−/− (right) mice show distinctly different strides. Stride lengths of sialin−/− mice are shorter (32.5 ± 1.1 vs 48.9 ± 3.6 mm; n = 3; ***p ≤ 0.001) and more variable (CV of 15.9 ± 1.6 vs 9.2 ± 1.5%; n = 3; *p ≤ 0.05). Scale bar, 150 μm.
Sialin is encoded by 11 exons with some suggestion of variable splicing (Verheijen et al., 1999). Because only the first exon was deleted, we sought to determine whether an alternatively spliced isoform of sialin was expressed in sialin−/− mice. We analyzed sialin mRNA expression by RT-PCR using oligonucleotide primers derived from several different exon pairs. No sialin transcript was detected in the sialin−/− mice, and a level approximately half of that in wild-type mice was present in the heterozygous mice (Fig. 1B). The absence of sialin expression in the sialin−/− mice was also confirmed by immunohistochemical analysis. Immunostained coronal brain sections of heterozygous mice showed sialin immunoreactivity in the granule cell layer and hilar neurons of the dentate gyrus that was not present in the sialin−/− mouse hippocampus (Fig. 1C).
As early as postnatal day 3 (P3), sialin−/− mice could be identified by their smaller size and underdeveloped features. sialin−/− mice failed to increase in size (Fig. 1D), developed a severe tremor and uncoordinated gait, appeared weak, and typically died during the third postnatal week. Throughout their observed lifespan, wild-type and heterozygous mice were grossly indistinguishable and were grouped together as controls for all analyses. To quantify gait abnormalities in the sialin−/− mice, we analyzed their footprint pattern as they walked down a cylindrical tube (Fig. 1E). The sialin−/− mice tended to stay at the entrance of the tube and took longer than control littermates to walk the length of the tube. The stride length for the sialin−/− mice was, on average, approximately two-thirds that of their littermate controls and had greater variability. During the footprint analysis studies, handling-induced tonic–clonic seizures were observed in the sialin−/− animals but never in littermate controls, consistent with the increased incidence of epilepsy in patients with the free sialic acid storage disorders (Varho et al., 2002).
Neuronal vacuoles, axonal spheroids, and decreased CNS myelin characterize the neuropathology of the sialin−/− mice
Neuropathological studies of tissue from Salla disease and ISSD patients have identified widespread neuronal storage, axonal spheroids, myelin loss, and cerebellar Purkinje cell loss (Autio-Harmainen et al., 1988; Pueschel et al., 1988; Mancini et al., 1991; Lemyre et al., 1999). If the sialin−/− mouse is an appropriate model for the human disorders, then similar findings should be present in these animals. On gross examination, the brains of the sialin−/− mice were notably smaller, showed decreased brainstem bulk, and had thinner optic nerves than control littermates (Fig. 2A). Light microscopic examination of cresyl violet-stained sections from the forebrain of P21 mice demonstrated normal neuronal cytoarchitecture, including neocortical and hippocampal lamination, but reduced numbers of cells in the corpus callosum of sialin−/− mice compared with control littermates (Fig. 2B). Prominent clear cytoplasmic structures consistent with vacuoles were evident in neurons of the cerebellum and spinal cord of sialin−/− mice (supplemental Fig. S1A, available at www.jneurosci.org as supplemental material). No such structures were found in tissue from the wild-type or heterozygous animals.
Figure 2.
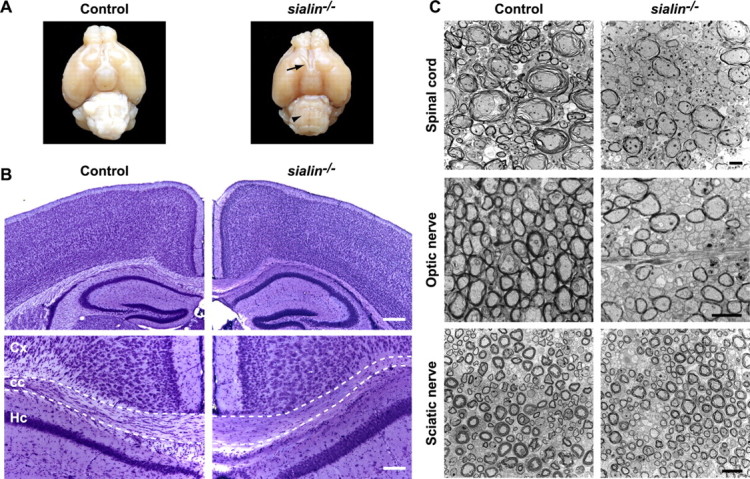
sialin−/− mouse brains have normal cortical cytoarchitecture but reduced CNS myelin. A, Gross examination from the ventral view of P21 control (left) and sialin−/− (right) mouse brains indicates decreased bulk of the brainstem (arrowhead), thinned optic nerves (arrow), and no appreciable postchiasmatic optic tracts in sialin−/− mouse brain. B, Representative images of cresyl violet-stained coronal brain sections from P21 control (left) and sialin−/− (right) mice. Brains from sialin−/− mice show normal cortical lamination and hippocampal formation with thinning of the corpus callosum as the most prominent defect (top). Decreased cellularity of the corpus callosum (outlined) is evident on higher magnification in the bottom images. Cx, Cortex; cc, corpus callosum; Hc, hippocampus. C, Ultrastructure images of P21 control (left) and sialin−/− (right) mouse cervical spinal cord (top), optic nerve (middle), and sciatic nerve (bottom) cut in cross section demonstrate a decrease in the number of myelinated axons in the ventral white matter of the spinal cord and optic nerve of the sialin−/− animals, whereas myelination of the sciatic nerve appears normal. Scale bars: B, top, 200 μm; bottom, 100 μm; C, top and middle, 2 μm; bottom, 10 μm.
To define further the histological abnormalities, we used electron microscopy. In addition to the neuronal vacuoles (supplemental Fig. S1B, available at www.jneurosci.org as supplemental material), a reduction in the density of myelinated axons in the ventral white matter of the spinal cord and in the optic nerve was evident (Fig. 2C). The myelin structures that were present in the tissue from the sialin−/− mice were relatively normal in appearance. In the sciatic nerve, myelin density and structure were similar in control and sialin−/− mice. Ultrastructural examination of the optic nerve also showed abnormal swellings containing electron-dense material, typical of axonal spheroids, in both myelinated and unmyelinated axons (supplemental Fig. S1C, available at www.jneurosci.org as supplemental material). Similar pathological findings were seen in cerebellar and spinal cord axons.
Myelin basic protein expression is decreased centrally but not peripherally in sialin−/− mice
To investigate further the myelination defect in sialin−/− mice, we examined the expression of MBP, a major structural protein of central and peripheral myelin, using quantitative Western blotting and immunostaining. Consistent with the histological analysis, the expression level of MBP was similar in the sciatic nerves from control and sialin−/− mice (Fig. 3A,B), whereas MBP levels in sialin−/− mouse cervical spinal cord samples were less than half those from control animals. The relative reduction in MBP expression in brain samples from sialin−/− mice was even greater with levels reaching only ∼10% of controls. In contrast, levels of NF68, an axonal protein, were similar in control and sialin−/− animals in the PNS and CNS. These results suggest that a reduced level of myelin is specific to the CNS and is not secondary to axonal loss.
Figure 3.

sialin−/− mice have reduced CNS myelin protein expression. A, Representative Western blot of PNS and CNS tissue from P21 sialin−/− and control mice demonstrates that levels of neurofilament (NF68) in sciatic nerve, cervical spinal cord, and brain are comparable between sialin−/− and control littermates. Expression of MBP is similar in sciatic nerves of sialin−/− and control mice but markedly reduced in spinal cord and brain of sialin−/− mice compared with controls. Actin levels are equivalent across samples. B, Quantification of Western blots demonstrates that these differences are consistent across samples. Values are mean ± SEM expression levels of protein in sialin−/− mouse tissue relative to control tissue (n = 3; **p ≤ 0.01, ***p ≤ 0.001; one population t test). SN, sciatic nerve; SC, spinal cord; B, brain. C, Immunofluorescence staining of coronal sections of P28 mouse brains for MBP (green) shows intense expression throughout the corpus callosum (cc), cortex (cx), striatum (CPu), anterior commissure (aca), and lateral olfactory tract (lo) in the control brain (left) but sparse staining throughout the sialin−/− brain (right). D, Higher magnification of P21 immunostained sections showing the cortex, corpus callosum, and striatum. The density of MBP staining (green) structures is substantially lower in the sialin−/− brain (right) compared with the control brain (left). Density of NF68-immunoreactive axons (red) is comparable between control and sialin−/− brains. Scale bar, 40 μm.
To determine whether there is regional variability to the myelination defect, we immunolabeled coronal brain sections for MBP (Fig. 3C). Although dense MBP staining was seen in all white matter structures of the control brain, we found a near complete absence of MBP immunofluorescence in the brains of sialin−/− mice. The MBP staining that was present in the sections from the sialin−/− mice occurred as isolated clusters of brightly stained elongated structures that appeared to originate from single cells. These myelin segments were present in the corpus callosum, deep layers of the cortex, more dorsal aspects of striatum, and the lateral olfactory tracts. Immunolabeling for NF68 showed that the axons were grossly intact in the sialin−/− brain (Fig. 3D), again suggesting minimal axonal loss in the sialin−/− mice.
We next assessed whether the myelin segments formed by oligodendrocytes in the sialin−/− mice were of normal number and length. We found the number of myelin segments originating from individual MBP+ cell bodies (range of 18–41) in the striatum (supplemental Fig. S2A, available at www.jneurosci.org as supplemental material) and lengths of myelin segments (range of ∼70–200 μm) labeled by MBP in the corpus callosum (supplemental Fig. S2B, available at www.jneurosci.org as supplemental material) to be consistent with published values for the rodent CNS (Butt et al., 1994; Bjartmar, 1996; Murtie et al., 2007).
Sialin loss leads to attenuated optic nerve myelination
The optic nerve is a discrete CNS white matter tract in which essentially all axons are myelinated in orderly and well characterized stages (Miller, 2002; Raff, 2007). Because loss of sialin has a profound effect on optic nerve myelination, we anticipated that examining myelin formation in this structure in sialin−/− mice might provide insight into underlying cellular and molecular pathophysiological mechanisms. As a first step, we analyzed the time course of optic nerve myelination. Myelination of the mouse optic nerve starts at approximately P7 with OPC differentiation into postmitotic, myelin protein-producing cells and continues over the first few postnatal weeks (Pernet et al., 2008). We assessed myelination at P7, P15, and P21 by immunostaining optic nerves for MBP and by using the lipophilic dye Fluoromyelin Red to identify compact myelin (Watkins et al., 2008).
MBP expression was evident at P7 in optic nerves of control and sialin−/− mice but to a much lesser extent in the sialin−/− mice, suggesting a delay in the onset of myelination. Furthermore, fine linear MBP+ structures suggestive of axonal ensheathment were more abundant in the optic nerves from P7 control mice. Consistent with the MBP staining, Fluoromyelin Red staining of the optic nerves from the P7 mice was faint but stronger in the tissue from the control animals. At P15 and P21, we saw an increase in density of MBP and Fluoromyelin Red staining in optic nerves from control and sialin−/− mice, but, at each time point, we found less MBP immunofluorescence and Fluoromyelin Red staining in optic nerves from sialin-deficient mice compared with controls (Fig. 4A).
Figure 4.

Myelin maturation is delayed in the optic nerves of sialin−/− mice. A, Representative longitudinal sections of optic nerves from P7 (top), P15 (middle), and P21 (bottom) mice demonstrate increasing expression of MBP (green) and intensity of the lipophilic dye Fluoromyelin Red staining with age in control (left) and sialin−/− (right) optic nerves. At all ages, both MBP immunostaining and Fluoromyelin Red staining are more intense in the control animals. B, Western blot of optic nerve protein expression during development indicates that NF68 expression is similar in control and sialin−/− at P7, P15, and P21. Although the level of MBP expression increases with age in both genotypes, less protein is expressed in the sialin−/− optic nerve compared with control at each age. Actin levels are equivalent across samples. C, Quantification of Western blot data shows MBP expression normalized to actin expression increases with age with less MBP expression in sialin−/− optic nerves compared with control optic nerves (n = 3; *p ≤ 0.05, **p ≤ 0.01). Levels of NF68 expression are indistinguishable between sialin−/− and control optic nerves. Scale bar, 40 μm.
To assess MBP expression quantitatively during optic nerve development, we performed Western blots on P7, P15, and P21 optic nerve samples (Fig. 4B,C). Consistent with the optic nerve staining, we found age-related increases in MBP expression in control and sialin−/− mice. At P7, MBP expression was not readily detectable by Western blotting. At P15 and P21, MBP expression levels were greater than twice as high in control compared with the sialin−/− mice. Similar levels of NF68 were present in optic nerves from control and sialin−/− mice at each age analyzed. Throughout this time period, MBP and NF68 levels in control and sialin−/− mouse sciatic nerves were indistinguishable (data not shown), indicating that the defect in myelination is specific to the CNS.
A final stage of myelinated fiber maturation is formation of distinct domains along the axon, including the nodes of Ranvier and flanking paranodal regions (Poliak and Peles, 2003). The paranode is a region of axo-glial septate-like junctions that is thought to attach the myelin sheath to the axon and to restrict lateral diffusion of axonally expressed channels involved in saltatory conduction (Poliak and Peles, 2003). To determine whether this late stage of myelination is reached in the sialin−/− mice, we analyzed distribution of the axonal protein Caspr in optic nerves from P21 mice. Caspr, a cell adhesion glycoprotein related to neurexins, is initially expressed along the length of the axon and is redistributed to the paranodal junctions during myelin maturation (Einheber et al., 1997; Menegoz et al., 1997). Unlike the persistently diffuse pattern of Caspr localization seen in many myelin mutants (Dupree et al., 1999; Rasband et al., 1999; Mathis et al., 2001), we found paired clusters of Caspr protein in the optic nerves of sialin−/− mice, indicating that these animals were able to form mature paranodal structures (Fig. 5A). As expected, there were far fewer paired Caspr clusters in the optic nerves of the sialin−/− mice but similar numbers of unpaired clusters (Fig. 5B). We also found a broader distribution in cluster length (Fig. 5C). Identification of nodes (supplemental Fig. S3A, available at www.jneurosci.org as supplemental material) and heminodes (supplemental Fig. S3B, available at www.jneurosci.org as supplemental material) on electron microscopic examination of optic nerves from the sialin−/− mice further demonstrates that an advanced stage of myelin maturation is achieved as indicated by the Caspr staining. These findings suggest that, although myelination of the optic nerve is reduced in the sialin−/− mice throughout development, the myelin that does form is mature and relatively normal in structure and organization.
Figure 5.

Caspr clusters in sialin−/− mouse optic nerves are fewer in number and more variable in length. A, Longitudinal sections of optic nerves from P21 control (left) and sialin−/− (right) mice immunolabeled with antibodies against the paranodal protein Caspr. B, Average number of paired (left) and unpaired (right) Caspr clusters in control (black bar) and sialin−/− (white bar) optic nerves. There is a significant decrease in paired Caspr clusters in sialin−/− optic nerves compared with control optic nerves (n = 4; ***p ≤ 0.001) but a similar density of unpaired clusters. C, Histogram showing the distribution in length of paired Caspr clusters (bracketed line in A) in control (black bars) and sialin−/− (white bars) optic nerves. The average length of Caspr clusters was greater in the sialin−/− optic nerves (1.60 ± 0.04, mean ± SEM; n = 4) than in control optic nerves (1.19 ± 0.01 μm). Scale bar, 2 μm.
Sialin−/− mice have normal numbers of oligodendrocyte precursor cells but reduced numbers of mature oligodendrocytes
The decreased myelination in the sialin−/− mouse could be caused by a decrease in the number of mature oligodendrocytes or by an inability of oligodendrocytes to produce myelin. A decrease in the number of mature oligodendrocytes could in turn be attributable to a defect in migration, proliferation, differentiation, or survival of cells in the oligodendrocyte lineage.
Optic nerve OPCs are born in the floor of the third ventricle, migrate into the optic chiasm, and proliferate as they migrate along the optic nerve toward the retina (Small et al., 1987; Ono et al., 1997). OPCs can be visualized by immunolabeling with the transcription factor Olig2, which predominantly labels nuclei of oligodendrocyte lineage cells in white matter tracts (Lu et al., 2000; Zhou et al., 2000; Dimou et al., 2008). In the mouse, Olig2+ OPCs are first detected in the optic nerve at embryonic day 17.5 and reach the optic nerve head by P4 (Pernet et al., 2008). To determine whether hypomyelination in the sialin−/− mouse could be caused by a defect in OPC development, proliferation, or migration, we immunostained P7 optic nerves for Olig2 and quantified number of Olig2+ cells in the chiasmal, middle, and retinal portions of the nerves. Olig2+ cells were evenly distributed throughout the optic nerves of control and sialin−/− P7 mice, and the densities of Olig2+ cells in the optic nerves of control and sialin−/− mice were not significantly different (Table 1). These findings suggest that development, migration, and proliferation of optic nerve OPCs are essentially normal in the sialin−/− mice and not underlying causes for the myelination defect.
Table 1.
Distribution of Olig2+ cells in P7 mouse optic nerve (cells/mm2)
| Genotype | Chiasmal | Middle | Retinal |
|---|---|---|---|
| Control | 2112 ± 141 | 2525 ± 264 | 2286 ± 247 |
| sialin−/− | 1916 ± 89 | 2133 ± 214 | 2112 ± 170 |
| p = 0.31 | p = 0.31 | p = 0.60 |
Distribution of Olig2+ cells in P7 mouse optic nerve. Olig2+ cells were counted in the chiasmal, middle, and retinal segments of optic nerves from P7 control and sialin−/− mice. Sections from three individual animals were analyzed for each genotype.
To determine whether a defect in oligodendrocyte differentiation could be contributing to the reduction in myelination, we next examined expression of Olig2 along with CC1, a marker of postmitotic oligodendrocytes (Bhat et al., 1996), in optic nerves from P7, P15, and P21 mice (Fig. 6A) (supplemental Fig. S4, available at www.jneurosci.org as supplemental material). As noted above, P7 Olig2+ cell densities were similar in the control and sialin−/− mice, but, at P15 and to a greater extent at P21, Olig2+ cell densities were reduced in optic nerves from the sialin−/− mice compared with those from control mice (Fig. 6B). As expected, CC1+ cell densities in optic nerves from control mice continuously increased from P7 to P21. By comparison, the CC1+ cell density was lower in the sialin−/− optic nerves at P7 and increased, but to a lesser extent, from P7 to P15. There was no change in the CC1+ cell density in the sialin−/− nerves between P15 and P21. The reduction in Olig2+ cells in the sialin−/− mice compared with controls is accounted for by the difference in CC1+ cells, indicating that the density of OPCs (Olig2+/CC1− cells) is similar in the optic nerves from control and sialin−/− mice. This is further supported by the similar staining of P21 optic nerves from sialin−/− and control littermate mice with an antibody to the OPC marker NG2 (supplemental Fig. S5, available at www.jneurosci.org as supplemental material).
Figure 6.
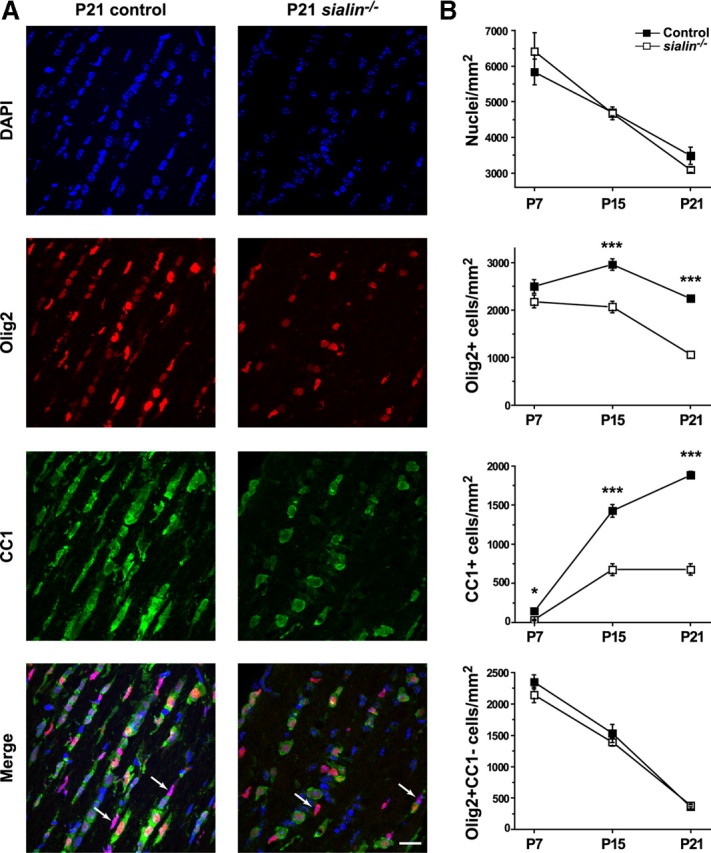
The number of mature oligodendrocytes is decreased in sialin−/− mouse optic nerves. A, Immunohistochemical analysis of optic nerve longitudinal sections. Oligodendrocytes are labeled with antibodies recognizing Olig2 (red) and CC1 (green) in P21 control (left) and sialin−/− (right) optic nerves. Nuclei are counterstained with DAPI (blue). Note the decreased number and the round morphology of CC1+ cells in sialin−/− optic nerves compared with the linear chains of elongated CC1+ cells in control optic nerves. Arrows identify Olig2+/CC1− cells. B, Quantification of cell types in P7, P15, and P21 optic nerves. The number of CC1+ cells plateaus in sialin−/− at P15 but continues to increase in control optic nerves. Average ± SEM was obtained from three to five pairs of control and sialin−/− animals from each time point (*p ≤ 0.05, ***p ≤ 0.001). Scale bar, 20 μm.
The analysis of Olig2+ and CC1+ cell densities suggests that loss of sialin leads to delayed or impaired differentiation of cells in the oligodendrocyte lineage or to selective loss of the more mature cells. This is supported by the cytoarchitecture of oligodendrocytes in the sialin−/− mouse optic nerves. In the optic nerves from P21 control mice, the CC1+ cells had elongated cell bodies and were present in chains oriented along the long axis of the nerve, whereas CC1+ cell bodies in P21 sialin−/− mouse optic nerves were typically found in isolation and had rounder cell bodies. This rounder morphology of CC1+ cell bodies in sialin−/− optic nerves is reminiscent of the pattern seen in immature, P7 control nerves (supplemental Fig. S4, available at www.jneurosci.org as supplemental material).
To assess further the health of the surviving oligodendrocytes, we performed electron microscopy on longitudinal sections of P21 optic nerves. Oligodendrocytes were identified by clumped chromatin adjacent to the nuclear envelope, dark cytoplasm, and prominent rough endoplasmic reticulum (Peters et al., 1991). Consistent with the immunostaining, we found that sialin−/− oligodendrocytes typically appeared in isolation rather than in long chains of cell bodies seen in control nerves. While the majority of oligodendrocytes in sialin−/− mice (supplemental Fig. S3D, available at www.jneurosci.org as supplemental material) appeared similar to oligodendrocytes in control mice (supplemental Fig. S3C, available at www.jneurosci.org as supplemental material), rare sialin−/−optic nerve oligodendrocytes had vacuoles (supplemental Fig. S3E, available at www.jneurosci.org as supplemental material), in contrast to sialin−/− cerebellar and spinal cord neurons, in which vacuoles were common (supplemental Fig. S1, available at www.jneurosci.org as supplemental material).
Increased apoptosis occurs in the optic nerves of sialin−/− mice
Presumably to ensure that axons are fully myelinated, oligodendrocytes are produced in excess. During normal myelination of the rodent optic nerve, ∼50% of postmitotic oligodendrocytes undergo apoptosis within 2–3 d of differentiation (Barres et al., 1992; Trapp et al., 1997). We wondered whether the decrease in CC1+ cell densities in sialin−/− mouse optic nerves might be attributable to enhanced apoptosis at this stage. To identify apoptotic cells, we immunostained optic nerves with an antibody to activated caspase-3. In the nerves from P7 animals, we found a number of cells with faintly labeled MBP+ extensions expressing activated caspase-3 (data not shown), consistent with previous reports (Ueda et al., 1999). The numbers of activated caspase-3+ cells in optic nerves from control and sialin−/− mice were not statistically different, suggesting that the rates of apoptotic cell death were similar at this time point. Because the number of optic nerve Olig2+ cells peaks at P10 (Pernet et al., 2008) and the relative reduction in the density of CC1+ cells in the sialin−/− nerves was greater at later time points, we immunolabeled for activated caspase-3 in P15 optic nerves (Fig. 7A). We found more than twice as many activated caspase-3+ cells in the optic nerves of sialin−/− mice compared with control (Fig. 7B). Although MBP staining was too dense at this stage to demonstrate colabeling of individual cells with activated caspase-3, the increased number of apoptotic cells correlates with the increased rate of Olig2+ cell loss between P15 and P21, suggesting that the apoptotic cells are of the oligodendrocyte lineage.
Figure 7.

Loss of sialin leads to increased apoptosis. A, Longitudinal sections of P15 optic nerves immunolabeled for activated caspase-3 (red) demonstrates increased apoptosis in sialin−/− (right) compared with control (left) optic nerves. B, Quantification of the density of activated caspase-3+ cells in P7 and P15 optic nerves of control and sialin−/− mice. The number of apoptotic cells was normalized to the surface area of the optic nerve (n = 4–6; **p ≤ 0.01). Scale bar, 40 μm.
It has been suggested that, once differentiated, oligodendrocytes require axonal contact to survive (Barres and Raff, 1999; Barres, 2008). Without this interaction, by 3 d, the oligodendrocytes undergo apoptosis. The heavily sialylated PSA-NCAM is a cell-surface adhesion protein that has been postulated to inhibit myelination. PSA-NCAM is downregulated at the onset of myelination, and its overexpression in vitro leads to a delay in oligodendrocyte maturation and myelin formation (Charles et al., 2000; Franceschini et al., 2004; Fewou et al., 2007). To test whether loss of sialin leads to impairment of the endosomal–lysosomal pathways responsible for PSA-NCAM downregulation, we examined quantitatively PSA-NCAM expression levels in P7, P15, and P21 optic nerves. We found that PSA-NCAM expression levels were progressively reduced from P7 to P21 in both genotypes (Fig. 8A). However, the extent of the reduction was less in the sialin−/− mice such that, at P21, the level was nearly twice as high in the optic nerves from sialin−/− mice compared with optic nerves from control mice (Fig. 8B). Although other mechanisms are undoubtedly involved, the impaired downregulation of PSA-NCAM likely contributes to the delayed myelin formation in the sialin−/− mice.
Figure 8.

Downregulation of PSA-NCAM expression is impaired in sialin−/− mouse optic nerves. A, Western blot of optic nerve samples indicates that PSA-NCAM expression decreases during development from P7 to P21 in control and sialin−/− mice. However, at P15 and P21, relative expression is greater in the sialin−/− animals. Actin expression serves as a loading control. B, Quantification of Western blots demonstrates consistency across samples. Values are mean ± SEM relative expression levels of PSA-NCAM (normalized to actin) in sialin−/− mouse optic nerves relative to control optic nerves (n = 3; *p ≤ 0.05; one population t test).
Discussion
Although the genetic and biochemical basis of Salla disease and ISSD have been well characterized, meaningful advances in our understanding of the pathophysiology of these diseases have been hindered by their rarity and the lack of an animal model. We have examined the behavioral and neuropathological phenotype of sialin-deficient mice to determine whether they appropriately reflect the free sialic acid storage disorders. We found that the mice express many of the cardinal features of these disorders, including marked CNS hypomyelination, and are thus an appropriate model in which to identify pathophysiological mechanisms and to investigate potential treatments of these disorders.
What is the ontogenic basis of hypomyelination in the sialin−/− mouse?
The effect of sialin loss on development of the nervous system appears remarkably specific. In stark contrast to the normal gross CNS neuronal cytoarchitecture and PNS myelination, the sialin−/− mouse shows a severe CNS myelination defect. Our ultrastructural analysis of optic nerves demonstrates a reduction in the number of myelinated axons in P21 sialin−/− mice when essentially all optic nerve axons are myelinated in control animals. The myelin that is present appears grossly normal with a thickness similar to that in littermate controls.
Myelination of the CNS is a complex, multistep process that begins with the specification of proliferating, migratory OPCs, followed by differentiation of these cells into postmitotic oligodendrocytes that ensheath axons and ultimately form compact multilamellar myelin membranes (Baumann and Pham-Dinh, 2001). Although a defect at any one of these steps or defects in multiple steps could underlie the impaired myelination associated with loss of sialin, the normal complement of optic nerve OPCs suggests that the primary defect occurs during or after postmitotic differentiation.
As myelin matures, there is precise matching of surviving oligodendrocytes with the axons that require myelination (Barres et al., 1993; Barres and Raff, 1994). Our data indicate that the reduction in myelin corresponds to a reduction in the number of these mature myelinating oligodendrocytes. The relative reduction in postmitotic oligodendrocyte number is evident as early as P7 and is more pronounced at P15. Between P15 and P21, the number of oligodendrocytes increases in the control animals, whereas there is no increase in sialin−/− mice. Interestingly, the myelin content (as indicated by MBP expression levels and Fluoromyelin Red staining) in the sialin−/− optic nerves increases between P15 and P21, although the postmitotic oligodendrocyte count does not. This suggests that, in the sialin−/− mice, although the number of mature oligodendrocytes that are formed is reduced, the few cells that are present are robustly producing myelin. The impression that sialin−/− mice can form mature myelin is further supported by our finding that normal-appearing paranodal structures, including Caspr clusters, are present in these animals.
During normal development of the rodent optic nerve, it has been estimated that, between P4 and P10, ∼50% of oligodendrocytes undergo apoptotic cell death as a result of a competition for survival signals that are provided by astrocytes and axons (Barres et al., 1992; Trapp et al., 1997). Could this process be enhanced in the sialin−/− mice and contribute to the reduction in oligodendrocytes? Although at P7 (when this process is peaking in wild-type animals) we find similar numbers of activated caspase-3+ cells in control and sialin−/− mouse optic nerves, at P15, we find more than double the number in the optic nerves from the sialin−/− mice. Although the density of MBP expression in P15 nerves prohibited identification of individual cells colabeled with activated caspase-3, we suspect that the apoptotic cells in the optic nerves from P15 sialin−/− mice are oligodendrocytes. Two factors support our suspicion. First, it is very likely that the apoptotic cells are of the oligodendrocyte lineage because a corresponding decrease in Olig2+ cells occurs with the increase in apoptosis. Because Olig2+/CC1− cell counts and NG2 staining are very similar in the optic nerves of sialin−/− and control mice, it is likely that the apoptotic cells are not OPCs but rather oligodendrocytes. Second, as mentioned, apoptosis of a significant portion of oligodendrocytes occurs as part of the normal developmental process, suggesting that these cells can be readily induced to undergo programmed cell death.
How does loss of a lysosomal sialic acid transporter lead to a reduction in the number of oligodendrocytes?
The simplest explanation for the decrease in numbers of myelinating oligodendrocytes is that the there is a pathological increase of the normal process of apoptosis-mediated competitive cellular pruning. Could loss of sialin lead to a generalized lysosomal defect that enhances apoptosis of oligodendrocytes? Because apoptosis is inhibited by lysosomal-dependent processes, including autophagy (Ferraro and Cecconi, 2007) and growth factor receptor signaling (Sweeney and Davis, 2002), loss of sialin might enhance oligodendrocyte apoptosis. However, other lysosomal storage disorders in which lysosomal function is likely to be equally impaired do not have hypomyelination as a prominently reported component of the pathological phenotype (Cherqui et al., 2002; de Geest et al., 2002; Barranger and Cabrera-Salazar, 2007).
If a generalized defect in lysosome function does not fully explain the hypomyelination of the sialin−/− mice, could a specific alteration in the metabolism of sialic-acid-containing molecules explain these defects? Our finding that PSA-NCAM downregulation is impaired suggests an intriguingly simple mechanism for the myelination defect. It has been shown that in vitro myelination can be accelerated by the addition of a sialic-acid-cleaving neuraminidase and that overexpression of PSA-NCAM leads to a delay in oligodendrocyte maturation and myelin formation (Charles et al., 2000; Franceschini et al., 2004; Fewou et al., 2007). Although alterations in PSA-NCAM expression might not lead directly to increased apoptosis of oligodendrocytes, a delay in the rate at which newly generated oligodendrocytes contact axons and form mature myelin could reduce survival of newly differentiated oligodendrocytes (Barres and Raff, 1999; Barres, 2008).
Could sustained PSA-NCAM expression alone explain the complex phenotype of the free sialic acid storage disorders? It is unlikely because metabolism of gangliosides, the major sialic acid-bearing conjugates in the vertebrate brain (Holian et al., 1971), is also influenced by loss of sialin function (Pitto et al., 1996). The expression of specific gangliosides is highly regulated during neurodevelopment and overall abundance increases during stages of neurogenesis, axon elongation, and myelination (Holian et al., 1971; Rösner, 2003). Mice double mutant for two critical ganglioside-specific glycosyltransferase genes (Siat9 and Galgt1) are unable to synthesize the major class of brain gangliosides (including GM1, GD1a, GD1b, and GT1b) and show severe white matter pathology (Yamashita et al., 2005). GD1a and GT1b are found in axons and are thought to interact with myelin-associated glycoprotein (MAG), a protein expressed in the periaxonal myelin membrane of oligodendrocytes. It has been suggested that the hypomyelination in the ganglioside-deficient mice is attributable to loss of these gangliosides as functional binding sites for MAG during the initiation of myelination (Sheikh et al., 1999). If loss of sialin leads to altered ganglioside expression profiles, it follows that crucial MAG–ganglioside interactions might not occur.
In summary, we have demonstrated the validity of the sialin−/− mouse as a model for the free sialic acid storage disorders. We have provided evidence that an increase in the apoptotic death of cells in the oligodendrocyte lineage occurs in these mice and have identified delayed downregulation of PSA-NCAM as a potential upstream event. These mice can now be used to dissect the specific molecular mechanism (or mechanisms) underlying the hypomyelination characteristic of these disorders.
Footnotes
This work was supported by National Institutes of Health Grants NS050417 and NS045634 (R.J.R.) and NS065664 (L.M.P.), the March of Dimes (R.J.R.), and a Howard Hughes Research Training Fellowship for Medical Students (L.M.P.). L.M.P. is in the Medical Scientist Training Program at Stanford University School of Medicine. We thank Ben Barres, Ben Emery, Trent Watkins, Craig Garner, Marion Buckwalter, and members of the Reimer laboratory for helpful comments. We thank Anita Briley and Isabel Parada for invaluable assistance with electron microscopy and histological studies.
References
- Aula N, Salomäki P, Timonen R, Verheijen F, Mancini G, Månsson JE, Aula P, Peltonen L. The spectrum of SLC17A5-gene mutations resulting in free sialic acid-storage diseases indicates some genotype-phenotype correlation. Am J Hum Genet. 2000;67:832–840. doi: 10.1086/303077. [DOI] [PMC free article] [PubMed] [Google Scholar]
- Autio-Harmainen H, Oldfors A, Sourander P, Renlund M, Dammert K, Simila S. Neuropathology of Salla disease. Acta Neuropathol. 1988;75:481–490. doi: 10.1007/BF00687135. [DOI] [PubMed] [Google Scholar]
- Barranger JA, Cabrera-Salazar MA. Lysosomal storage disorders. New York: Springer; 2007. [Google Scholar]
- Barres BA. The mystery and magic of glia: a perspective on their roles in health and disease. Neuron. 2008;60:430–440. doi: 10.1016/j.neuron.2008.10.013. [DOI] [PubMed] [Google Scholar]
- Barres BA, Hart IK, Coles HS, Burne JF, Voyvodic JT, Richardson WD, Raff MC. Cell death and control of cell survival in the oligodendrocyte lineage. Cell. 1992;70:31–46. doi: 10.1016/0092-8674(92)90531-g. [DOI] [PubMed] [Google Scholar]
- Barres BA, Jacobson MD, Schmid R, Sendtner M, Raff MC. Does oligodendrocyte survival depend on axons? Curr Biol. 1993;3:489–497. doi: 10.1016/0960-9822(93)90039-q. [DOI] [PubMed] [Google Scholar]
- Barres BA, Raff MC. Control of oligodendrocyte number in the developing rat optic nerve. Neuron. 1994;12:935–942. doi: 10.1016/0896-6273(94)90305-0. [DOI] [PubMed] [Google Scholar]
- Barres BA, Raff MC. Axonal control of oligodendrocyte development. J Cell Biol. 1999;147:1123–1128. doi: 10.1083/jcb.147.6.1123. [DOI] [PMC free article] [PubMed] [Google Scholar]
- Baumann N, Pham-Dinh D. Biology of oligodendrocyte and myelin in the mammalian central nervous system. Physiol Rev. 2001;81:871–927. doi: 10.1152/physrev.2001.81.2.871. [DOI] [PubMed] [Google Scholar]
- Bhat RV, Axt KJ, Fosnaugh JS, Smith KJ, Johnson KA, Hill DE, Kinzler KW, Baraban JM. Expression of the APC tumor suppressor protein in oligodendroglia. Glia. 1996;17:169–174. doi: 10.1002/(SICI)1098-1136(199606)17:2<169::AID-GLIA8>3.0.CO;2-Y. [DOI] [PubMed] [Google Scholar]
- Bjartmar C. Oligodendroglial sheath lengths in developing rat ventral funiculus and corpus callosum. Neurosci Lett. 1996;216:85–88. doi: 10.1016/0304-3940(96)12990-6. [DOI] [PubMed] [Google Scholar]
- Butt AM, Colquhoun K, Tutton M, Berry M. Three-dimensional morphology of astrocytes and oligodendrocytes in the intact mouse optic nerve. J Neurocytol. 1994;23:469–485. doi: 10.1007/BF01184071. [DOI] [PubMed] [Google Scholar]
- Charles P, Hernandez MP, Stankoff B, Aigrot MS, Colin C, Rougon G, Zalc B, Lubetzki C. Negative regulation of central nervous system myelination by polysialylated-neural cell adhesion molecule. Proc Natl Acad Sci U S A. 2000;97:7585–7590. doi: 10.1073/pnas.100076197. [DOI] [PMC free article] [PubMed] [Google Scholar]
- Cherqui S, Sevin C, Hamard G, Kalatzis V, Sich M, Pequignot MO, Gogat K, Abitbol M, Broyer M, Gubler MC, Antignac C. Intralysosomal cystine accumulation in mice lacking cystinosin, the protein defective in cystinosis. Mol Cell Biol. 2002;22:7622–7632. doi: 10.1128/MCB.22.21.7622-7632.2002. [DOI] [PMC free article] [PubMed] [Google Scholar]
- de Geest N, Bonten E, Mann L, de Sousa-Hitzler J, Hahn C, d'Azzo A. Systemic and neurologic abnormalities distinguish the lysosomal disorders sialidosis and galactosialidosis in mice. Hum Mol Genet. 2002;11:1455–1464. doi: 10.1093/hmg/11.12.1455. [DOI] [PubMed] [Google Scholar]
- Dimou L, Simon C, Kirchhoff F, Takebayashi H, Götz M. Progeny of Olig2-expressing progenitors in the gray and white matter of the adult mouse cerebral cortex. J Neurosci. 2008;28:10434–10442. doi: 10.1523/JNEUROSCI.2831-08.2008. [DOI] [PMC free article] [PubMed] [Google Scholar]
- Dupree JL, Girault JA, Popko B. Axo-glial interactions regulate the localization of axonal paranodal proteins. J Cell Biol. 1999;147:1145–1152. doi: 10.1083/jcb.147.6.1145. [DOI] [PMC free article] [PubMed] [Google Scholar]
- Einheber S, Zanazzi G, Ching W, Scherer S, Milner TA, Peles E, Salzer JL. The axonal membrane protein Caspr, a homologue of neurexin IV, is a component of the septate-like paranodal junctions that assemble during myelination. J Cell Biol. 1997;139:1495–1506. doi: 10.1083/jcb.139.6.1495. [DOI] [PMC free article] [PubMed] [Google Scholar]
- Ferraro E, Cecconi F. Autophagic and apoptotic response to stress signals in mammalian cells. Arch Biochem Biophys. 2007;462:210–219. doi: 10.1016/j.abb.2007.02.006. [DOI] [PubMed] [Google Scholar]
- Fewou SN, Ramakrishnan H, Büssow H, Gieselmann V, Eckhardt M. Down-regulation of polysialic acid is required for efficient myelin formation. J Biol Chem. 2007;282:16700–16711. doi: 10.1074/jbc.M610797200. [DOI] [PubMed] [Google Scholar]
- Franceschini I, Vitry S, Padilla F, Casanova P, Tham TN, Fukuda M, Rougon G, Durbec P, Dubois-Dalcq M. Migrating and myelinating potential of neural precursors engineered to overexpress PSA-NCAM. Mol Cell Neurosci. 2004;27:151–162. doi: 10.1016/j.mcn.2004.05.006. [DOI] [PubMed] [Google Scholar]
- Haataja L, Parkkola R, Sonninen P, Vanhanen SL, Schleutker J, Aärimaa T, Turpeinen U, Renlund M, Aula P. Phenotypic variation and magnetic resonance imaging (MRI) in Salla disease, a free sialic acid storage disorder. Neuropediatrics. 1994;25:238–244. doi: 10.1055/s-2008-1073028. [DOI] [PubMed] [Google Scholar]
- Holian O, Dill D, Brunngraber EG. Incorporation of radioactivity of D-glucosamine-1–14C into heteropolysaccharide chains of glycoproteins in adult and developing rat brain. Arch Biochem Biophys. 1971;142:111–121. doi: 10.1016/0003-9861(71)90265-7. [DOI] [PubMed] [Google Scholar]
- Lemyre E, Russo P, Melançon SB, Gagné R, Potier M, Lambert M. Clinical spectrum of infantile free sialic acid storage disease. Am J Med Genet. 1999;82:385–391. [PubMed] [Google Scholar]
- Lu QR, Yuk D, Alberta JA, Zhu Z, Pawlitzky I, Chan J, McMahon AP, Stiles CD, Rowitch DH. Sonic hedgehog-regulated oligodendrocyte lineage genes encoding bHLH proteins in the mammalian central nervous system. Neuron. 2000;25:317–329. doi: 10.1016/s0896-6273(00)80897-1. [DOI] [PubMed] [Google Scholar]
- Mancini GM, Verheijen FW, Beerens CE, Renlund M, Aula P. Sialic acid storage disorders: observations on clinical and biochemical variation. Dev Neurosci. 1991;13:327–330. doi: 10.1159/000112181. [DOI] [PubMed] [Google Scholar]
- Mathis C, Denisenko-Nehrbass N, Girault JA, Borrelli E. Essential role of oligodendrocytes in the formation and maintenance of central nervous system nodal regions. Development. 2001;128:4881–4890. doi: 10.1242/dev.128.23.4881. [DOI] [PubMed] [Google Scholar]
- Menegoz M, Gaspar P, Le Bert M, Galvez T, Burgaya F, Palfrey C, Ezan P, Arnos F, Girault JA. Paranodin, a glycoprotein of neuronal paranodal membranes. Neuron. 1997;19:319–331. doi: 10.1016/s0896-6273(00)80942-3. [DOI] [PubMed] [Google Scholar]
- Miller RH. Regulation of oligodendrocyte development in the vertebrate CNS. Prog Neurobiol. 2002;67:451–467. doi: 10.1016/s0301-0082(02)00058-8. [DOI] [PubMed] [Google Scholar]
- Morin P, Sagné C, Gasnier B. Functional characterization of wild-type and mutant human sialin. EMBO J. 2004;23:4560–4570. doi: 10.1038/sj.emboj.7600464. [DOI] [PMC free article] [PubMed] [Google Scholar]
- Morse RP, Kleta R, Alroy J, Gahl WA. Novel form of intermediate salla disease: clinical and neuroimaging features. J Child Neurol. 2005;20:814–816. doi: 10.1177/08830738050200100601. [DOI] [PubMed] [Google Scholar]
- Murtie JC, Macklin WB, Corfas G. Morphometric analysis of oligodendrocytes in the adult mouse frontal cortex. J Neurosci Res. 2007;85:2080–2086. doi: 10.1002/jnr.21339. [DOI] [PubMed] [Google Scholar]
- Myall NJ, Wreden CC, Wlizla M, Reimer RJ. G328E and G409E sialin missense mutations similarly impair transport activity, but differentially affect trafficking. Mol Genet Metab. 2007;92:371–374. doi: 10.1016/j.ymgme.2007.08.121. [DOI] [PMC free article] [PubMed] [Google Scholar]
- Ono K, Yasui Y, Rutishauser U, Miller RH. Focal ventricular origin and migration of oligodendrocyte precursors into the chick optic nerve. Neuron. 1997;19:283–292. doi: 10.1016/s0896-6273(00)80939-3. [DOI] [PubMed] [Google Scholar]
- Pernet V, Joly S, Christ F, Dimou L, Schwab ME. Nogo-a and myelin-associated glycoprotein differently regulate oligodendrocyte maturation and myelin formation. J Neurosci. 2008;28:7435–7444. doi: 10.1523/JNEUROSCI.0727-08.2008. [DOI] [PMC free article] [PubMed] [Google Scholar]
- Peters A, Palay SL, Webster H. Ed 3. New York: Oxford UP; 1991. The fine structure of the nervous system: neurons and their supporting cells. [Google Scholar]
- Pitto M, Chigorno V, Renlund M, Tettamanti G. Impairment of ganglioside metabolism in cultured fibroblasts from Salla patients. Clin Chim Acta. 1996;247:143–157. doi: 10.1016/0009-8981(95)06243-2. [DOI] [PubMed] [Google Scholar]
- Poliak S, Peles E. The local differentiation of myelinated axons at nodes of Ranvier. Nat Rev Neurosci. 2003;4:968–980. doi: 10.1038/nrn1253. [DOI] [PubMed] [Google Scholar]
- Pueschel SM, O'Shea PA, Alroy J, Ambler MW, Dangond F, Daniel PF, Kolodny EH. Infantile sialic acid storage disease associated with renal disease. Pediatr Neurol. 1988;4:207–212. doi: 10.1016/0887-8994(88)90032-x. [DOI] [PubMed] [Google Scholar]
- Raff M. Intracellular developmental timers. Cold Spring Harb Symp Quant Biol. 2007;72:431–435. doi: 10.1101/sqb.2007.72.007. [DOI] [PubMed] [Google Scholar]
- Rasband MN, Peles E, Trimmer JS, Levinson SR, Lux SE, Shrager P. Dependence of nodal sodium channel clustering on paranodal axoglial contact in the developing CNS. J Neurosci. 1999;19:7516–7528. doi: 10.1523/JNEUROSCI.19-17-07516.1999. [DOI] [PMC free article] [PubMed] [Google Scholar]
- Rösner H. Developmental expression and possible roles of gangliosides in brain development. Prog Mol Subcell Biol. 2003;32:49–73. doi: 10.1007/978-3-642-55557-2_3. [DOI] [PubMed] [Google Scholar]
- Ruivo R, Sharifi A, Boubekeur S, Morin P, Anne C, Debacker C, Graziano JC, Sagné C, Gasnier B. Molecular pathogenesis of sialic acid storage diseases: insight gained from four missense mutations and a putative polymorphism of human sialin. Biol Cell. 2008;100:551–559. doi: 10.1042/BC20070166. [DOI] [PubMed] [Google Scholar]
- Sampathkumar SG, Li A, Yarema KJ. Sialic acid and the central nervous system: perspectives on biological functions, detection, imaging methods and manipulation. CNS Neurol Disord Drug Targets. 2006;5:425–440. doi: 10.2174/187152706777950729. [DOI] [PubMed] [Google Scholar]
- Sheikh KA, Sun J, Liu Y, Kawai H, Crawford TO, Proia RL, Griffin JW, Schnaar RL. Mice lacking complex gangliosides develop Wallerian degeneration and myelination defects. Proc Natl Acad Sci U S A. 1999;96:7532–7537. doi: 10.1073/pnas.96.13.7532. [DOI] [PMC free article] [PubMed] [Google Scholar]
- Small RK, Riddle P, Noble M. Evidence for migration of oligodendrocyte-type-2 astrocyte progenitor cells into the developing rat optic nerve. Nature. 1987;328:155–157. doi: 10.1038/328155a0. [DOI] [PubMed] [Google Scholar]
- Sweeney ST, Davis GW. Unrestricted synaptic growth in spinster-a late endosomal protein implicated in TGF-beta-mediated synaptic growth regulation. Neuron. 2002;36:403–416. doi: 10.1016/s0896-6273(02)01014-0. [DOI] [PubMed] [Google Scholar]
- Trapp BD, Nishiyama A, Cheng D, Macklin W. Differentiation and death of premyelinating oligodendrocytes in developing rodent brain. J Cell Biol. 1997;137:459–468. doi: 10.1083/jcb.137.2.459. [DOI] [PMC free article] [PubMed] [Google Scholar]
- Ueda H, Levine JM, Miller RH, Trapp BD. Rat optic nerve oligodendrocytes develop in the absence of viable retinal ganglion cell axons. J Cell Biol. 1999;146:1365–1374. doi: 10.1083/jcb.146.6.1365. [DOI] [PMC free article] [PubMed] [Google Scholar]
- Varho TT, Alajoki LE, Posti KM, Korhonen TT, Renlund MG, Nyman SR, Sillanpää ML, Aula PP. Phenotypic spectrum of Salla disease, a free sialic acid storage disorder. Pediatr Neurol. 2002;26:267–273. doi: 10.1016/s0887-8994(01)00406-4. [DOI] [PubMed] [Google Scholar]
- Verheijen FW, Verbeek E, Aula N, Beerens CE, Havelaar AC, Joosse M, Peltonen L, Aula P, Galjaard H, van der Spek PJ, Mancini GM. A new gene, encoding an anion transporter, is mutated in sialic acid storage diseases. Nat Genet. 1999;23:462–465. doi: 10.1038/70585. [DOI] [PubMed] [Google Scholar]
- Vyas AA, Schnaar RL. Brain gangliosides: functional ligands for myelin stability and the control of nerve regeneration. Biochimie. 2001;83:677–682. doi: 10.1016/s0300-9084(01)01308-6. [DOI] [PubMed] [Google Scholar]
- Watkins TA, Emery B, Mulinyawe S, Barres BA. Distinct stages of myelination regulated by gamma-secretase and astrocytes in a rapidly myelinating CNS coculture system. Neuron. 2008;60:555–569. doi: 10.1016/j.neuron.2008.09.011. [DOI] [PMC free article] [PubMed] [Google Scholar]
- Wreden CC, Wlizla M, Reimer RJ. Varied mechanisms underlie the free sialic acid storage disorders. J Biol Chem. 2005;280:1408–1416. doi: 10.1074/jbc.M411295200. [DOI] [PubMed] [Google Scholar]
- Yamashita T, Wu YP, Sandhoff R, Werth N, Mizukami H, Ellis JM, Dupree JL, Geyer R, Sandhoff K, Proia RL. Interruption of ganglioside synthesis produces central nervous system degeneration and altered axon-glial interactions. Proc Natl Acad Sci U S A. 2005;102:2725–2730. doi: 10.1073/pnas.0407785102. [DOI] [PMC free article] [PubMed] [Google Scholar]
- Zhou Q, Wang S, Anderson DJ. Identification of a novel family of oligodendrocyte lineage-specific basic helix-loop-helix transcription factors. Neuron. 2000;25:331–343. doi: 10.1016/s0896-6273(00)80898-3. [DOI] [PubMed] [Google Scholar]