

Abstract
The locus coeruleus (LC) is a dense cluster of neurons that projects axons throughout the neuroaxis and is located in the rostral pontine tegmentum extending from the level of the inferior colliculus to the motor nucleus of the trigeminal nerve. LC neurons are lost in the course of several neurodegenerative disorders, including Alzheimer's and Parkinson's diseases. In this study, we used Nissl staining and tyrosine hydroxylase (TH) immunoreactivity to compare the human LC with that of closely related primate species, including great and lesser apes, and macaque monkeys. TH catalyzes the initial and rate-limiting step in catecholamine biosynthesis. The number of TH-immunoreactive (TH-ir) neurons was estimated in each species using stereologic methods. In the LC of humans, the mean total number of TH-ir neurons was significantly higher compared to the other primates. Because the total number of TH-ir neurons in the LC was highly correlated with the species mean volume of the medulla oblongata, cerebellum, and neocortical gray matter, we conclude that much of the observed phylogenetic variation can be explained by anatomical scaling. Notably, the total number of LC neurons in humans was most closely predicted by the nonhuman allometric scaling relationship relative to medulla size, whereas the number of LC neurons in humans was considerably lower than predicted according to neocortex and cerebellum volume.
Keywords: Locus coeruleus, non-human primates, hominids, tyrosine hydroxylase, stereology
INTRODUCTION
The locus coeruleus (LC) is a densely packed cluster of norepinephrine (NE) producing cells located in the upper part of the pons near the floor of the fourth ventricle. In spite of its limited size, the LC is the largest accumulation of NE-containing neurons in the mammalian brain. The LC supplies NE to the entire central nervous system (CNS) via extensive efferent projections grouped into two major ascending fiber systems, the dorsal noradrenergic bundle and the rostral limb of the dorsal periventricular pathway. Through these projections, the LC innervates limbic regions such as the hippocampus, as well as the whole neocortex (Klimek et al., 1999).
While the noradrenergic system was initially proposed to be involved in learning and memory (Crow et al., 1968, 1973; Kety et al., 1970), several theories concerning the functional role of this system have been formulated more recently, proposing links to vigilance, attention, and memory processes, as well as development of higher-order models concerning prediction errors, decision making, and unexpected uncertainty (Aston-Jones et al., 1991; Servan-Schreiber et al., 1990; Sara and Segal, 1991; Sara et al., 1994; Clayton et al., 2004).
Studies in monkeys and rats have demonstrated that LC neurons are activated within behavioral contexts that require a cognitive shift, that is, an interruption of ongoing behavior and adaptation. This kind of LC activation occurs whenever there is a change in environmental imperative, such as the appearance of a novel, unexpected event, or a change in stimulus-reinforcement contingency within a formal learning situation. Within trials, LC neurons are driven by stimuli that require a rapid behavioral adjustment such as a preparatory signal or an unexpected reward (Bouret and Sara, 2005).
Central NE, derived from the LC in particular, is hypothesized to play an important role in attention, arousal, and behavioral activation (Aston-Jones et al., 1991; Aston-Jones et al., 2000; Charney et al., 1990; Foote et al., 1983; Puumala et al., 1997; Siegel and Rogawski, 1988). Furthermore, upregulation of the activity of tyrosine hydroxylase (TH), the rate-limiting enzyme in the synthesis of catecholamines, has been suggested to lead to changes in noradrenergic transmission that contribute to behavioral, cognitive, emotional, and physiological manifestations of depression and anxiety (Persson et al., 1997; Sands et al., 2000).
TH is the first and rate-limiting enzyme in dopamine synthesis. It converts tyrosine to L-DOPA and is present in most catecholamine synthesizing neurons (Smeets and Gonzalez, 2000). For this reason it is considered a general marker of catecholaminergic neurons, including noradrenergic neurons of the LC.
Because the catecholaminergic innervation originating from the LC is involved in the regulation of attention, working memory, and higher cognitive functions, we sought to determine whether the human brain contains a disproportionately large number of TH-immunoreactive (TH-ir) neurons within the LC compared to other primate species. To examine this possibility, we obtained stereologic estimates of the total number of TH-ir neurons in the LC from humans, chimpanzees, gorillas, gibbons, and macaque monkeys. Our study demonstrates the existence of quantitative differences in LC neurons among these species, which may have played a role in behavioral changes during primate evolution.
Methods and Materials
Specimens and tissue processing
We used serial sections from one side of the brain of humans (Homo sapiens; n = 4), common chimpanzees (Pan troglodytes; n = 2), Western lowland gorillas (Gorilla gorilla; n = 2), gibbons, including a Borneo gibbon (Hylobates muelleri; n = 1) and a white handed gibbon (Hylobates lar; n = 1), and rhesus monkeys (Macaca mulatta; n = 2) (for details, see Table 1). The non-human tissue came from captive zoo and research facility animals that were housed according to their respective institutional guidelines and had died from causes unrelated to the current study. The brains were immersion-fixed at the time of necropsy in 10% buffered formalin and the postmortem time never exceeded 14 hours. Prior to sectioning, the brainstem was dissected, and tissue was postfixed in 4% paraformaldehyde in phosphate-buffered saline (PBS; pH 7.4) at 4°C for 24 hours and then incubated in 10%, 20%, and 30% sucrose in PBS to avoid freezing artifacts. Each brainstem was processed for unilateral morphometric analysis. The brainstem was sectioned coronally at 50 μm using a cryostat. Every tenth serial section was collected for cresyl violet staining and the adjacent sections for immunohistochemistry. A total of 8–10 equidistant sections that spanned the entire LC were obtained from each animal.
Table 1.
Statistical information about each specimen (age in years at death, sex), number of specimens, their respective neuron counts.
| Species | Age | Sex | N | LC Neuron Count Estimated by Optical Fractionator |
|---|---|---|---|---|
| Homo sapiens | 87 | Male | 4 | 46,423 |
| 36 | Male | 45,567 | ||
| 53 | Male | 50,391 | ||
| 38 | Male | 48,991 | ||
| Pan troglodytes | 41 | Female | 2 | 33,333 |
| 35 | Female | 30,462 | ||
| Gorilla gorilla | 49 | Male | 2 | 34,106 |
| 39 | Female | 41,000 | ||
| Hylobates spp. | 8 | Female | 2 | 12,096 |
| 18 | Male | 12,014 | ||
| Macaca mulatta | 19 | Male | 2 | 10,568 |
| 19 | Male | 9,805 | ||
Immunohistochemistry
Every tenth section through the entire LC area was sampled into a 24-well plate for free-floating immunocytochemistry to visualize TH-synthesizing neurons. Immunoreactive neurons were stained using ABC method of Hsu et al. (1981). Briefly, Sections were quenched in 0.3% hydrogen peroxide for 30 minutes at room temperature, washed in 0.3% Triton X-100/PBS (3×10 minutes), and incubated in 5% normal goat serum (NGS) in PBS. Sections were then incubated in polyclonal rabbit anti-TH primary antibody (1:1,000 dilution, Chemicon International, Billerica, MA USA) at 4 °C overnight for 16–24 hours. Controls were made by omitting the primary antibody, and did not exhibit any labeling (Table 2). The following day, sections were rinsed in 0.3% Triton X-100/PBS (3×10 minutes) and exposed to biotinylated goat anti-rabbit IgG antibody (1:400 Vector Laboratories, Burlingame, CA, USA) for 2 hours. After rinsing in 0.3% Triton X-100/PBS, sections were incubated for 2 hours in avidin-biotin complex (Vector Laboratories), rinsed in PBS and exposed to a 0.03% 3,3'-diaminobenzidine (DAB) solution (Vector Laboratories) in 0.1 M phosphate buffer for 20 minutes. After a final PBS rinse, sections were mounted onto gelatin-coated glass slides (Fisher Scientific, Pittsburgh, PA, USA) and allowed to air-dry overnight. Slides were then counterstained with methyl green (Vector Laboratories) or cresyl violet (Sigma-Aldrich, St. Louis, MO, USA) for increased visualization of labeled neurons and fibers. They were then dehydrated through a graded alcohol series, cleared in xylene, and cover-slipped with DPX mountant (Sigma-Aldrich) for histology. Previous studies by Raghanti et al. (2008, 2009) show that the same anti-TH antibody we used in our study has a distribution of TH immunostaining similar to the one reported in our results. As shown by the work of Lewis et al. (1994) and Wolf et al. (1991), the antibody used in the present study recognizes the same 60 kDa TH protein in human and macaque monkey. Considering the phylogenetic relatedness of human and apes, the chance that differences in labeling patterns would be found among hominoids is virtually nil.
Table 2.
Details of the primary antibody used.
| Antigen | Immunogen | Manufacturer, species antibody was raised in, mono- vs. polyclonal, catalog no. | Dilution used |
|---|---|---|---|
| Tyrosine Hydroxylase | Denatured tyrosine hydroxylase from rat pheochromocytoma (denatured by sodium dodecyl sulfate) | Chemicon International, Billerica, MA USA; Rabbit anti-tyrosine hydroxylase affinity purified polyclonal antiserum; Catalog no. AB152 | 1:1,000 |
Stereology
All LC subregions with TH-ir neurons were outlined using a 4× objective (Fig. 1) and neurons in the one hemisphere of each species were counted using a 60× oilimmersion objective (1.4 numerical aperture; Nikon, Japan). The borders of the reference space for human were defined according to the stereotaxic brain atlas of Mai et al. (2008), and the atlas of Jurgen et al. (2000) was used to guide delineation in the other species. Because TH immunoreactivity was not confined to specific or readily definable LC subnuclei, we quantified the entire LC region, including the nucleus subcoeruleus (SubC) containing TH-ir neurons to avoid arbitrary delineation. Care was taken to avoid inclusion of other populations of TH-ir neurons, including the A5 and other groups that were readily distinguished from the LC and subcoeruleus on the basis of location and morphology. Subsequently, the optical fractionator method (West et al., 1991) was employed to estimate the total number of neurons in the LC at high magnification. Prior to the start of the experiment, a pilot study determined the optimal sampling parameters to place disector frames (60×60×17 μm) in a systematic-random manner so as to sample at least 200 immunolabeled LC neurons over 8–10 systematic-random sections through the LC in each brain (Long et al., 1999; Mouton, 1994). TH-ir neurons were identified by their brown-color staining within the disector frame. Counting frames and sampling grid sizes were optimized to achieve a mean coefficient of error (CE) of 10% or less (Gundersen and Jensen, 1987). A guard distance of 2.0 μm was used during neuron counting to avoid introduction of errors due to sectioning artifacts, including uneven section surfaces and lost caps (West et al., 1991).
Figure 1.

Photomicrograph through the LC showing TH-ir neurons; (A) human (B), chimpanzee, (C) gorilla, (D) gibbon, (E) rhesus Monkey. Bar = 200 μm, SCP (superior cerebellar peduncle), MV (nucleus of the mesencephalic tract of trigeminal nerve), SubC (nucleus subcoeruleus).
Photmicrographs presented in Figure 1 were collected using a Nikon i80 microscope fitted with a 4× objective (N.A. =1.4, Nikon Japan). Images were photographed at a resolution of 300 ppi using a digital camera and StereoInvestigator software (MBF Bioscience, Williston, VT). Photomicrographs were cropped and grayscale levels were optimized using Adobe Photoshop CS3 software. Photomicrographs were then imported into Adobe Illustrator CS3 software for labeling and layout of the image panels.
Statistics
We calculated the correlation and allometric scaling of species mean TH-ir LC neuron number with data on other neuroanatomical components available from the literature. We chose to analyze the scaling of LC neuron number against the medulla oblongata because it is the brain subdivision of the neuroaxis most proximate to the LC. Additionally, we also included the neocortical gray matter and cerebellum in analyses because they each represent a major target of LC neuron projections. Species mean medulla volume was taken from Sherwood et al. (2005), cerebellum volume came from MacLeod et al. (2003), and neocortical gray matter volume came from Rilling and Insel (1999). Medulla volumes reported in Sherwood et al. (2005) were consistent with the anatomical boundaries described in Stephan et al. (1981, 1991). In brief, the caudal boundary of the medulla was identified as the first appearance of the gracile nucleus. Because it is difficult to make a reliable distinction between the reticular formation of the medulla, pons and midbrain, the entire tegmentum extending rostrally to the level of the interpeduncular nucleus was included. The middle cerebellar penduncle and the pontine nuclei were excluded as they were considered to be part of the cerebellum in the original measurements of the Stephan collection (Stephan et al., 1981). Thus, although the LC is located in the located in the tegmentum of the rostral pons, according to these criteria it is included in the structure designated “medulla”.
For LC neuron number in Hylobates species, we calculated the genus average because volumes for other neuroanatomical components were only available in the literature for H. lar. The cube root of volumetric data was calculated to analyze scaling between variables in the same dimensional space. Logarithm (base 10)-transformed species means were used in allometric scaling analyses. After these transformations to the data, a slope of best-fit equal to 1 indicates isometry, or equally proportional changes in the dependent variable, LC neuron number, with the independent variable. To determine the exponent of scaling relationships, we used reduced major axis (RMA) line-fitting to bivariate data because it accounts for error in both independent and dependent variables (Sokal and Rohlf, 1995). All RMA routines and tests were calculated using (S) MATR software version 2.0 (Warton et al., 2006).
In addition to estimating scaling exponents, we also examined whether human LC neuron numbers represent significant deviations from allometric expectations based on the other primates. We calculated least-squares (LS) prediction equations and 95% prediction intervals for humans based on non-human data.
Phylogenetic independent contrasts were also calculated from the data to examine scaling relationships and predictions while controlling for the effects of phylogenetic relatedness in the dataset (Crow and Felsenstein, 1985). Standardized independent contrasts were calculated using the PDAP:PDTREE module (Garland and Ives, 2000) of Mesquite software version 1.12 (Maddison and Maddison, 2005) from log-transformed data based on a phylogeny of primates in Goodman et al. (2005). Branch lengths were transformed according to Pagel's method (1992), which assigns all branch lengths to 1 with the constraint that tips are contemporaneous. To generate phylogenetically informed predictions based on independent contrasts, humans were pruned from the tree, then an independent contrasts regression line was computed and mapped back into the original “tip” species space (Garland and Ives, 2000) (Fig. 2). After logarithmic detransformation of predictions, the percentage difference between observed and predicted values was calculated as the ratio of (observed-predicted)/observed. Statistical significance was set at P = 0.05.
Figure 2.
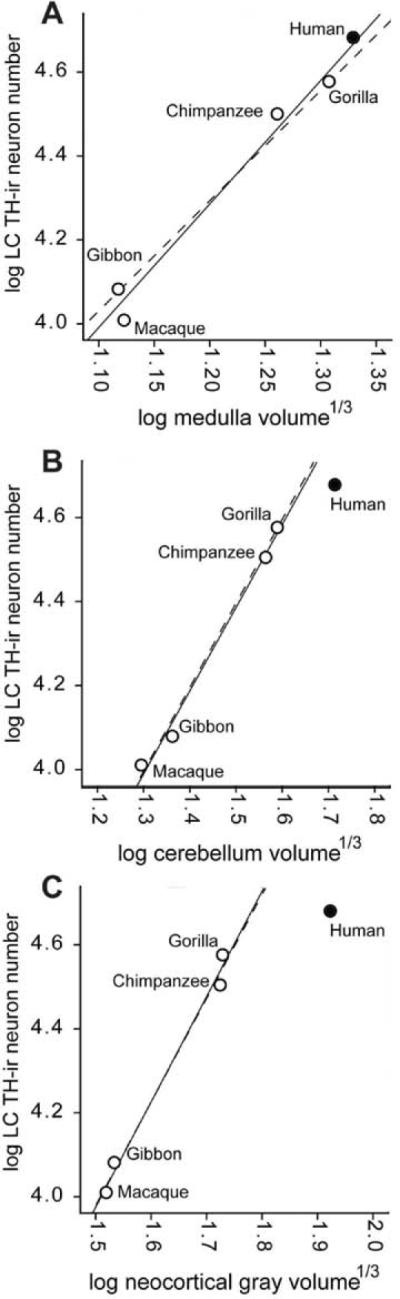
LC neuron number versus medulla volume (A), cerebellum volume (B), and neocortex volume (C). The solid lines represent the least-squares regression of nonhuman species mean data. The dotted lines represent the least-squares regression of nonhuman phylogenetic independent contrasts plotted in contemporary “tip” species data space.
Results
There was significant phylogenetic variation in the total number of TH-ir neurons among species (P < 0.05, Kruskal-Wallis ANOVA), as well as significant phylogenetic variation in total neuron numbers (χ2 = 10.46, P < 0.03). Pairwise comparisons using Mann-Whitney tests revealed a significant difference between humans and the rest of the non-human primate sample (Z = −2.72, P = 0.007), as well as a difference between humans and great apes (Z = −2.31, P = 0.03). LC neuron numbers in the great apes (i.e., chimpanzees and gorillas) was also significantly larger than in gibbons and rhesus monkeys (grouped together; Z = −2.31, P = 0.03; Fig. 3, Table 3).
Figure 3.

Graph showing the estimated number of TH-ir neurons in the examined primate species. Data show means and SD.
Table 3.
Reduced major axis (RMA) coefficients for the scaling of LC neuron number against brain structure volumes.
| Independent variable | Species data | Phylogenetic independent contrasts | ||||||
|---|---|---|---|---|---|---|---|---|
| RMA | Lower | Upper | RMA | |||||
| r2 | P | slope | 95% CI | 95% CI | r2 | P | slope | |
| Medulla oblongata volume | 0.982 | 0.001 | 3.00 | 2.36 | 3.83 | 0.977 | 0.001 | 2.89 |
| Cerebellum volume | 0.976 | 0.002 | 1.77 | 1.34 | 2.35 | 0.942 | 0.006 | 1.64 |
| Neocortex volume | 0.896 | 0.015 | 1.84 | 1.05 | 3.23 | 0.806 | 0.039 | 1.52 |
| * Note: volumes are cube root-transformed | ||||||||
Note: A slope of isometry would be 1.00
The number of TH-ir neurons in the LC was closely correlated with the volume of the medulla (Spearman's rho rs = 0.9, P = 0.04), cerebellum (rs = 1.0, P < 0.01), and neocortical gray matter (rs = 1.0, P < 0.01). Furthermore, LC neuron number scaled against each brain subdivision with a significant positive allometric exponent as revealed by analysis of both species mean data and phylogenetic independent contrasts (Fig. 3), indicating that TH-ir neurons in the LC increases in number at a rate that is disproportionately greater than the rate of increase in the volume of these brain components. It is notable that the scaling exponent for LC TH-ir neuron number was substantially higher when regressed against medulla as compared with the cerebellum or neocortical gray matter. Thus, the number of TH-ir neurons in the LC increases at a rate that is more similar to the brain subdivisions that it innervates (neocortex and cerebellum) than the one in which it is located (brainstem).
We calculated LS regression equations from non-human data to examine whether human LC TH-ir neuron numbers can be predicted by the size of other brain components. We found that human LC TH-ir neuron numbers were only 3% higher than predicted based on medulla volume (log observed LC TH-ir neuron number = 4.68; predicted = 4.66; lower 95% PI = 4.49; upper 95% PI = 4.85). Strikingly, however, human LC TH-ir neuron numbers were substantially lower than expected based on cerebellum volume (35% less; log observed LC TH-ir neuron number = 4.68; predicted = 4.81; lower 95% PI = 4.52; upper 95% PI = 4.95), and neocortical gray matter volume (126% less; log observed LC TH-ir neuron number = 4.68; predicted = 5.03; lower 95% PI = 4.31; upper 95% PI = 5.25) (Fig. 3). Because of the limited interspecific sample sizes, the 95% prediction intervals for all non-human regressions were wide and contained the observed human datapoint in each case. Human predictions calculated with phylogenetic independent contrasts yielded results that were consistent with the species mean data (Table 3).
Discussion
The LC is the major source of brain NE. It projects throughout most of the CNS, including the neocortex, hippocampus, thalamus, midbrain, brainstem, cerebellum, and spinal cord (Foote et al., 1983). Moreover, pharmacological and electrophysiological experiments have suggested that the LC plays a crucial role in the control of behavioral states, including vigilance and attention, and a critical but permissive role in the generation of paradoxical sleep (Aston-Jones et al., 1981a, b; McCarley et al., 1975). The neurons of the LC exhibit a regular tonic discharge during waking. During slow-wave sleep, they show decreased activity, and they almost stop firing during paradoxical sleep (Aston-Jones et al., 1981a). The mechanisms underlying these patterns of activity remain to be determined, although several hypotheses have been brought forward (Luppi et al., 1995). Despite considerable examination of the LC noradrenergic system and substantial progress in our understanding of the neurobiology of this system, the ultimate impact of LC neurotransmission on behavioral processes has, for the most part, remained unresolved. Notably, however, brain areas in primates that are associated with attention processing (e.g., parietal cortex, pulvinar nucleus, and superior colliculus) have particularly dense LC projections and noradrenergic receptors (Morrison and Foote, 1986).
Design-based unbiased stereology has been used in the LC, to refute earlier studies of age-related changes in neuronal density using assumption-based methods (Mouton et al., 1994; Ohm et al., 1997). Noradrenergic cell bodies in the LC and SubC area are easily recognized in all mammalian species studied thus far, although the number of cells varies from about 1,600 (unilaterally) in rat (Aston-Jones et al., 1995) to about 60,000 in human (Baker et al., 1999). In our study, we found in the LC of humans that the mean total number of TH-ir neurons was 47,493 ± 1,465. The occurrence of TH-ir neurons in the other LC subdivisions varies substantially among species (Kitahama et al., 1994; Tafti et al. 1997; Manger et al., 2003). In rats, rabbits, and primates including humans, the Kölliker-Fuse and parabrachial nuclei are almost devoid of NE-synthesizing neurons, but they occur in large numbers in the corresponding nuclei of dogs, sheep, and particularly in cats. The location of TH-ir neurons in the LC of all primate species in the present study was very consistent (Fig. 1).
In the present study, TH-ir neurons were significantly more numerous in humans compared to other primates. However, we also found that total TH-ir neuron number in the LC was highly correlated with the size of the medulla, cerebellum, and neocortical gray matter. The scaling exponent of LC TH-ir neuron number versus medulla volume (β = 3.00) indicates that LC neurons increase in number more rapidly than does the size of the medulla. The scaling of LC neuron number against cerebellum (β = 1.77) and neocortical volume (β = 1.84), although still positively allometric, was close to equal proportionality. These findings suggest that the addition of LC neurons across phylogeny is driven more by changes in the size of target structures rather than by changes in the size of a proximate portion of the neuroaxis in which the LC is located.
To examine the hypothesis that relatively increased numbers of LC TH-ir neurons might underlie some of the behavioral and cognitive specializations of humans, we examined whether humans possess relatively more LC TH-ir neurons that would be expected for a primate of their medulla, cerebellum, and neocortical gray matter size. However, when the non-human data were used to predict LC TH-ir neuron number based on medulla volume in humans, we did not find a significant departure from allometric expectations. Quite remarkably, when human LC TH-ir neuron numbers were predicted by non-human scaling trends for cerebellum and neocortex volume, it appeared that humans have significantly fewer LC TH-ir neurons than expected. Thus, these important targets of LC innervation are actually supplied by relatively fewer neurons in humans than in other closely related Old World primates. The widespread projections from the LC provide most of the noradrenergic innervation of the CNS and the sole noradrenergic innervation of several brain regions such as the neocortex, hippocampus, and cerebellum (Aston-Jones et al., 1995). LC neurons give rise to axons with vigorous bifurcation to cover the entire extent and layers of the neocortex. This would mean that cortical neurons are under the influence of such small bilateral clusters of the LC in human. Because, as demonstrated in the monkey (Maeda et al., 1995), noradrenergic axons from the LC are half ascending and another half descending efferents, a single neuron of the LC appears to cover many, if not all, neurons of the neocortex. Similarly, patterns of innervation of axons of LC of a relatively few neurons distribute classical neurotransmitters such as acetylcholine, serotonin, dopamine, adrenaline, and histamine widely in various brain regions. LC neurons may act as modulatory on various brain neurons to make a certain brain function harmoniously.
The comparative anatomy of LC redirects the functional challenge of understanding neuromodulatory systems towards their target networks, particularly to the dynamics of their interactions. Whereas there are many similarities in biology, evolutionary history, and behavior among hominids, there are also many striking differences that still need to be explored.
Acknowledgements
We thank Dr Eline Begio the South Western Medical Center, Dallas, TX, for generous provision of the human brains, Dr J.M. Erwin for providing access to the great ape specimens, Dr C. Bonar, Cleveland Metroparks Zoo for one of the gibbon brains. We also thank C. Simpson and V. Goubert for the histological preparation of the great ape brains.
Grant sponsor: the James McDonnell's Foundation, grant number: 22002078; Grant sponsor: NIH/NINDS, grant numbers: U54 NS39407 (Specialized Neuroscience Research Program) and NS42867; Grant sponsor: National Science Foundation, grant numbers: BCS-0515484, BCS-0549117, BCS-0827531, and DGE-0801634.
Literature cited
- Aston-Jones G, Bloom FE. Activity of norepinephrine-containing locus coeruleus neurons in behaving rats anticipates fluctuations in the sleep-waking cycle. J Neurosci. 1981a;1:876–886. doi: 10.1523/JNEUROSCI.01-08-00876.1981. [DOI] [PMC free article] [PubMed] [Google Scholar]
- Aston-Jones G, Bloom FE. Norepinephrine-containing locus coeruleus neurons in behaving rats exhibit pronounced responses to non-noxious environmental stimuli. J Neurosci. 1981b;1:887–900. doi: 10.1523/JNEUROSCI.01-08-00887.1981. [DOI] [PMC free article] [PubMed] [Google Scholar]
- Aston-Jones G, Chiang C, Alexinsky T. Discharge of noradrenergic locus coeruleus neurons in behaving rats and monkeys suggests a role in vigilance. Prog Brain Res. 1991;88:501–520. doi: 10.1016/s0079-6123(08)63830-3. [DOI] [PubMed] [Google Scholar]
- Aston-Jones G, Rajkowski J, Cohen J. Locus coeruleus and regulation of behavioral flexibility and attention. Prog Brain Res. 2000;126:165–182. doi: 10.1016/S0079-6123(00)26013-5. [DOI] [PubMed] [Google Scholar]
- Baker KG, Tork I, Hornung JP, Halasz P. The human locus coeruleus complex: an immunohistochemical and three dimensional reconstruction study. Exp Brain Res. 1989;77:257–270. doi: 10.1007/BF00274983. [DOI] [PubMed] [Google Scholar]
- Bouret S, Sara S. Network reset: Simplified overarching theory od locus coeruleus noradreline function. Trends Neurosci. 2005;28:574–582. doi: 10.1016/j.tins.2005.09.002. [DOI] [PubMed] [Google Scholar]
- Charney DS, Woods SW, Nagy LM, Southwick SM, Krystal JH, Heninger GR. Noradrenergic function in panic disorder. J Clin Psychiatry. 1990;51(Suppl A):5–11. [PubMed] [Google Scholar]
- Clayton EC, Rajkowski J, Cohen JD, Aston-Jones G. Phasic activation of monkey locus coeruleus neurons by simple decisions in a forced-choice task. J Neurosci. 2004;24:9914–9920. doi: 10.1523/JNEUROSCI.2446-04.2004. [DOI] [PMC free article] [PubMed] [Google Scholar]
- Crow TJ. Cortical synapses and reinforcement: a hypothesis. Nature. 1968;219:736–737. doi: 10.1038/219736a0. [DOI] [PubMed] [Google Scholar]
- Crow TJ. The coeruleo–cortical norepinehrine system and learning. In: Usdin E, Snyder S, editors. Frontiers in Catecholamine Research. Pergamon Press; Oxford UK: 1973. pp. 723–726. [Google Scholar]
- Crow TJ, Felsenstein J. Confidence limits on phylogenies: An approach using the bootstrap. Evolution. 1985;39:783–791. doi: 10.1111/j.1558-5646.1985.tb00420.x. [DOI] [PubMed] [Google Scholar]
- Foote SL, Bloom FE, Aston-Jones G. Nucleus locus coeruleus: new evidence of anatomical and physiological specificity. Physiol Rev. 1983;63:844–914. doi: 10.1152/physrev.1983.63.3.844. [DOI] [PubMed] [Google Scholar]
- Garland T, Jr, Ives AR. Using the past to predict the present: Confidence intervals for regression equations in phylogenetic comparative methods. Am Nat. 2000;155:346–364. doi: 10.1086/303327. [DOI] [PubMed] [Google Scholar]
- Goodman M, Grossman LI, Wildman DE. Moving primate genomics beyond the chimpanzee genome. Trends Genet. 2005;21:511–517. doi: 10.1016/j.tig.2005.06.012. [DOI] [PubMed] [Google Scholar]
- Gundersen HJ, Jensen EB. The efficiency of systematic sampling in stereology and its prediction. J Microsc. 1987;147:229–263. doi: 10.1111/j.1365-2818.1987.tb02837.x. [DOI] [PubMed] [Google Scholar]
- Hsu SM, Raine L, Fanger H. Use of avidin-biotin-peroxidase complex (ABC) in immunoperoxidase techniques: a comparison between ABC and unlabeled antibody (PAP) procedures. J Histochem Cytochem. 1981;29:577–580. doi: 10.1177/29.4.6166661. [DOI] [PubMed] [Google Scholar]
- Jurgen MK, Paxinos G, Voss T. Atlas of the Human brain. 3rd ed Academic Press, San Diego CA; San Diego, CA: 2008. Atlas of the human brain stereotaxic coordinates. [Google Scholar]
- Kety SS. The biogenic amines in the central nervous system: their possible roles in arousal, emotion, and learning. In: Schmitt FO, editor. The Neurosciences. Second Study Program. Rockefeller University Press; New York: 1970. pp. 324–336. [Google Scholar]
- Kitahama K, Nagatsu I, Pearson J. Catecholamine systems in mammalian midbrain and hindbrain: theme and variations. In: Smeets WJAJ, Reiner A, editors. Phylogeny and Development of Catecholamine Systems in the CNS of Vertebrates. Cambridge University Press, Cambridge; Cambridge: 1994. pp. 183–205. [Google Scholar]
- Klimek V, Rajkowska G, Luker SN, Dilley G, Meltzer HY, Overholser JC, Stockmeier CA, Ordway GA. Brain noradrenergic receptors in major depression and schizophrenia. Neuropsychopharmacology. 1999;21:69–81. doi: 10.1016/S0893-133X(98)00134-1. [DOI] [PubMed] [Google Scholar]
- Lewis DA, Melchitzky DS, Haycock JW. Expression and distribution of two isoforms of tyrosine hydroxylase in monkey brain. Brain Res. 1994;656:1–13. doi: 10.1016/0006-8993(94)91360-9. [DOI] [PubMed] [Google Scholar]
- Long JM, Mouton PR, Jucker M, Ingram DK. What counts in brain aging? Design-based stereological analysis of cell number. J Gerontol A Biol Sci Med Sci. 1999;54:B407–417. doi: 10.1093/gerona/54.10.b407. [DOI] [PubMed] [Google Scholar]
- Luppi PH, Aston-Jones G, Akaoka H, Chouvet G, Jouvet M. Afferent projections to the rat locus coeruleus demonstrated by retrograde and anterograde tracing with cholera-toxin B subunit and Phaseolus vulgaris leucoagglutinin. Neuroscience. 1995;65(1):119–160. doi: 10.1016/0306-4522(94)00481-j. [DOI] [PubMed] [Google Scholar]
- MacLeod CE, Zilles K, Schleicher A, Rilling JK, Gibson KR. Expansion of the neocerebellum in Hominoidea. J Hum Evol. 2003;44:401–429. doi: 10.1016/s0047-2484(03)00028-9. [DOI] [PubMed] [Google Scholar]
- Maddison WP, Maddison DR. Mesquite: a modular system for evolutionary analysis. Version 1.06. 2005. http://mesquiteproject.org. [Google Scholar]
- Maeda T, Ikemoto K, Satoh K, Kitahama K, Geffard M. Dopaminergic innervation of primate cerebral cortex. An immunohicochemical study in the Japanese macaque. Monogr Neural Sci. 1995;14:147–159. [Google Scholar]
- Manger PR, Ridgway SH, Siegel JM. The locus coeruleus complex of the bottlenose dolphin (Tursiops truncatus) as revealed by tyrosine hydroxylase Immunohistochemistry. J Sleep Res. 2003;2:149–55. doi: 10.1046/j.1365-2869.2003.00350.x. [DOI] [PMC free article] [PubMed] [Google Scholar]
- McCarley RW, Hobson JA. Neuronal excitability modulation over the sleep cycle: a structural and mathematical model. Science. 1975;189:58–60. doi: 10.1126/science.1135627. [DOI] [PubMed] [Google Scholar]
- Morrison JH, Foote SL. Noradrenergic and serotoninergic innervation of cortical, thalamic, and tectal visual structures in Old and New World monkeys. J Comp Neurol. 1986;243:117–138. doi: 10.1002/cne.902430110. [DOI] [PubMed] [Google Scholar]
- Mouton PR, Pakkenberg B, Gundersen HJ, Price DL. Absolute number and size of pigmented locus coeruleus neurons in young and aged individuals. J Chem Neuroanat. 1994;7:185–190. doi: 10.1016/0891-0618(94)90028-0. [DOI] [PubMed] [Google Scholar]
- Ohm TG, Busch C, Bohl J. Unbiased estimation of neuronal numbers in the human nucleus coeruleus during aging. Neurobiol Aging. 1997;18:393–9. doi: 10.1016/s0197-4580(97)00034-1. [DOI] [PubMed] [Google Scholar]
- Pagel MD. A method for the analysis of comparative data. J Theor Biol. 1992;156:431–442. [Google Scholar]
- Persson ML, Wasserman D, Geijer T, Jonsson EG, Terenius L. Tyrosine hydroxylase allelic distribution in suicide attempters. Psychiatry Res. 1997;72:73–80. doi: 10.1016/s0165-1781(97)00068-1. [DOI] [PubMed] [Google Scholar]
- Puumala T, Riekkinen P, Sr., Sirvio J. Modulation of vigilance and behavioral activation by alpha-1 adrenoceptors in the rat. Pharmacol Biochem Behav. 1997;56:705–712. doi: 10.1016/s0091-3057(96)00408-x. [DOI] [PubMed] [Google Scholar]
- Raghanti MA, Stimpson CD, Marcinkiewicz JL, Erwind JM, Hof PR, Sherwood CC. Cortical dopaminergic innervation among humans, chimpanzees, and macaque monkeys: A comparative study. Neurosci. 2008;155:203–220. doi: 10.1016/j.neuroscience.2008.05.008. [DOI] [PMC free article] [PubMed] [Google Scholar]
- Raghanti MA, Spocter MA, Stimpson CD, Erwin JM, Bonar CJ, Allman JM, Hof PR, Sherwood CC. Species-specific distributions of tyrosine hydroxylase-immunoreactive neurons in the prefrontal cortex of anthropoid primates. Neurosci. 2009;158:1551–9. doi: 10.1016/j.neuroscience.2008.10.058. [DOI] [PMC free article] [PubMed] [Google Scholar]
- Rilling JK, Insel TR. Differential expansion of neural projection systems in primate brain evolution. NeuroReport. 1999;10:1453–1459. doi: 10.1097/00001756-199905140-00012. [DOI] [PubMed] [Google Scholar]
- Sands SA, Strong R, Corbitt J, Morilak DA. Effects of acute restraint stress on tyrosine hydroxylase mRNA expression in locus coeruleus of Wistar and Wistar-Kyoto rats. Mol Brain Res. 2000;75:1–7. doi: 10.1016/s0169-328x(99)00255-7. [DOI] [PubMed] [Google Scholar]
- Sara SJ, Segal M. Plasticity of sensory responses of locus coeruleus neurons in the behaving rat: implications for cognition. Prog Brain Res. 1991;88:571–585. doi: 10.1016/s0079-6123(08)63835-2. [DOI] [PubMed] [Google Scholar]
- Sara SJ, Vankov A, Herve A. Locus coeruleus-evoked responses in behaving rats: a clue to the role of noradrenaline in memory. Brain Res Bull. 1994;35:457–465. doi: 10.1016/0361-9230(94)90159-7. [DOI] [PubMed] [Google Scholar]
- Servan-Schreiber D, Printz H, Cohen JD. A network model of catecholamine effects: gain, signal-to-noise ratio, and behavior. Science. 1990;249:892–895. doi: 10.1126/science.2392679. [DOI] [PubMed] [Google Scholar]
- Sherwood CC, Hof PR, Holloway RL, Semendeferi K, Gannon PJ, Frahm HD, Zilles K. Evolution of the brainstem orofacial motor system in primates: a comparative study of trigeminal, facial, and hypoglossal nuclei. J Hum Evol. 2005;48:45–84. doi: 10.1016/j.jhevol.2004.10.003. [DOI] [PubMed] [Google Scholar]
- Siegel JM, Rogawski MA. A function for REM sleep: regulation of noradrenergic receptor sensitivity. Brain Res. 1988;472:213–233. doi: 10.1016/0165-0173(88)90007-0. [DOI] [PMC free article] [PubMed] [Google Scholar]
- Smeets WJ, Gonzalez A. Catecholamine systems in the brain of vertebrates: new perspectives through a comparative approach. Brain Res Rev. 2000;33:308–379. doi: 10.1016/s0165-0173(00)00034-5. [DOI] [PubMed] [Google Scholar]
- Sokal RR, Rohlf FJ. Biometry: The Principles and Practice of Statistics in Biological Research. 3rd ed. W. H. Freeman and Co; New York: 1995. [Google Scholar]
- Stephan H, Frahm HD, Baron G. New and revised data on volumes of brain structures in insectivores and primates. Folia Primatol. 1981;35:1–29. doi: 10.1159/000155963. [DOI] [PubMed] [Google Scholar]
- Stephan H, Baron G, Frahm HD. Insectivora: With Stereotaxic Atlas of the Hedgehog Brain. Vol. 1. Springer Verlag; New York: 1991. Comparative Brain Research in Mammals. [Google Scholar]
- Tafti M, Nishino S, Liao W, Dement WC, Mignot E. Mesopontine organization of cholinergic and catecholaminergic cell groups in the normal and narcoleptic dog. J Comp Neurol. 1997;379:185–197. doi: 10.1002/(sici)1096-9861(19970310)379:2<185::aid-cne2>3.0.co;2-#. [DOI] [PubMed] [Google Scholar]
- Warton DI, Wright IJ, Falster DS, Westoby M. Bivariate line-fitting methods for allometry. Biol Rev. 2006;81:259–291. doi: 10.1017/S1464793106007007. [DOI] [PubMed] [Google Scholar]
- West MJ, Slomianka L, Gundersen HJ. Unbiased stereological estimation of the total number of neurons in the subdivisions of the rat hippocampus using the optical fractionator. Anat Rec. 1991;231:482–497. doi: 10.1002/ar.1092310411. [DOI] [PubMed] [Google Scholar]
- Wolf ME, LeWitt PA, Bannon MJ, Dragovic LJ, Kapatos G. Effect of aging on tyrosine hydroxylase protein content and the relative number of dopamine nerve terminals in human caudate. J. Neurochem. 1991;56:1191–1200. doi: 10.1111/j.1471-4159.1991.tb11410.x. [DOI] [PubMed] [Google Scholar]